3795
Multiexponential T1ρ spectroscopy in liver fibrosis: A prospective animal experiment at 11.7T MRI1Institute of Science and Technology for Brain-Inspired Intelligence, Fudan University, ShangHai, China, 2Human Phenome Institute, Fudan University, ShangHai, China, 3Department of Radiology, Xinhua Hospital, Shanghai Jiao Tong University, ShangHai, China
Synopsis
This study proposed a new method to assess the stage of liver fibrosis by signal curves clustering and multiexponential decay T1ρ spectral analysis. Compared to single component in normal tissue, liver fibrosis tissue has two T1ρ components, in carbon tetrachloride (CCI4) rat model. Meanwhile, T1ρ tends to increase with fibrosis score. Due to the spatial distribution of clusters reveal the fibrosis region, this method might contribute to diagnosis and staging of liver fibrosis.
Introduction
T1ρ is sensitive to mobile macromolecules at low frequencies and has been reported as a potential biomarker for assessing liver fibrosis1. Recently, multiexponential modeling of relaxation or diffusion MR signal decays approach has been developed for estimating and spatially mapping different microstructural tissue compartments2. However, the possibility of multicomponent analysis method in liver fibrosis has rarely been discussed, which will be focused on in this work.Methods
Liver Fibrosis Model and Data AcquisitionSeventeen rats of CCI4 model (kept with CCI4 injections for 2,4,7,10 weeks respectively) and six as sham group were imaged at an 11.7T preclinical MRI system (Bruker BioSpec, Billerica, MA, 117/16) using a Tx/Rx coil (Bruker BioSpin). 10 spin-lock times (TSL = 0, 10, 20, 30, 40, 50, 60, 70, 80, and 90 ms, frequency = 1250 HZ) preparation with a RARE readout was performed to quantify T1ρ. Liver fibrosis staging was assessed by two pathologists (with more than 10 years of hepatic disease experience), who were blinded to MRI results, according to the METAVIR system3: F0 (n = 6): no fibrosis, F1 (n = 7): fibrous portal expansion, F2 (n = 3): few bridges or septa, F3 (n = 3): obvious bridging fibrosis, F4 (n = 4): cirrhosis.
Clustering and T1ρ Multiexponential Decay Spectroscopy
In T1ρ acquisition, the ideal noiseless signal from a large voxel can be modeled as
$$S(TSL) = \int f(T1\rho) exp(-TSL/T1\rho) d(T1\rho) (1)$$
Where $$$f(T1\rho)$$$ is the continuous 1D distribution of T1ρ parameters that needs to be estimated from data. Considering the ill-posedness of the inverse problem is frequently prone to noise effects4, we used BM3D4 algorithm was applied to denoise all images. The ROI (Figure 1, top row) covered most of the liver parenchyma without vessels, bile ducts, and noticeable motion artifacts. Then Fuzzy-C means were used to cluster and smooth the signal decay curve in ROIs per rat. We set the fuzzy coefficient equal to 1.2 and cluster number as 6 following the parameter selection in previous study5. Then noisy signals can be eliminated according to the plot of curves and the minority pixels among ROIs. 300 T1ρ values were set ranging from 0.001~1s. The T1ρ distribution can be solved using Eq (2).
$$\hat{f} = argmin||Kf-S||^2 + \mu||f||^2, f \geq 0 (2)$$
Where factor
Statistical Analysis
The range of normal T1ρ was identified based on the peaks of the sham group. The abnormal pixels were selected as follow: 1) two peaks in spectrum; 2) peak T1ρ was outside the normal range. Then abnormal T1ρ of each rat was averaged weighting with percentage of abnormal pixels’ quantity. The differences of abnormal T1ρ and abnormal area among fibrosis stages were compared using U test (SPSS v.23.0, Chicago, USA) and one-way ANOVA test (R, 4.0.3, Vienna, Austria), respectively.
Results
Table 1 demonstrates the detail peak values and quantities of pixels in each cluster of five rats grading as F0, F1, F2, F3, F4, F5. Abnormal clusters were shown in bold fonts.The range of T1ρ of normal liver tissue is 0.0313 ~ 0.0515s, with mean T1ρ = 0.0408±0.0069s, which is consistent with previously reported7.
Figure 2 illustrates that the T1ρ peaks have a tendency towards to right from F0 to F4, which is consistent with Figure 1. T1ρ maps also reveal the higher T1ρ in severe fibrosis. Liver grading as F1-F4 have clusters with two T1ρ components, except two of F1 failed to be found different components from F0 group. As shown in Figure 3a), all abnormal T1ρ of F1-F4 are significantly different from F0 (p = 0.015,0.006,0.006 and 0.004, respectively). And F1 vs F3, F2 vs F4 also show slight differences (p = 0.070 and 0.077, respectively).
The area of tissue with abnormal T1ρ has been displayed in Figure 2 (right col). There is a phenomenon that the abnormal T1ρ area will increase with the severity of fibrosis. ANOVA test gives the similar results (Figure 3b)): significant differences between F0 and F4 (p = 0.002), slight differences between F2 and F0 (p = 0.098), F3 and F0 (p = 0.079), F4 and F1 (p = 0.080).
Discussion
In this work, the results suggest that the liver fibrosis has two T1ρ components. And the abnormal T1ρ has a tendency to increase from F0 to F4, which may be related to the pathomechanism such as collagen deposition. Cluster mapping has great potential to match the liver biopsy. Future studies will perform biopsy analysis and enlarge the sample size.Conclusion
We found fibrotic liver tissue has two T1ρ components by using multiexponential T1ρ spectroscopy. T1ρ and abnormal areas of liver tissue seem to increase from F0 to F4. Spatial distribution of cluster with abnormal T1ρ was visualized may helpful to noninvasive diagnosis of liver fibrosis staging.Acknowledgements
Funding: This work was supported by the National Natural Science Foundation of China (No. 81971583), National Key R&D Program of China (No. 2018YFC1312900), Shanghai Natural Science Foundation (No. 20ZR1406400), Shanghai Municipal Science and Technology Major Project (No.2017SHZDZX01, No.2018SHZDZX01) and ZJLab.References
1. Yi-Xiang J. Wang M, Jing Yuan , Eagle S. H. Chu, Minnie Y. Y. Go, , Hua Huang ATA, FRCR, Joseph J. Y. Sung JY. T1ρ MR Imaging Is Sensitive to Evaluate Liver Fibrosis: An Experimental Study in a Rat Biliary Duct Ligation Mlodel. Radiology 2011;259:712-719
2. Kim D, Wisnowski JL, Nguyen CT, et al. Multidimensional correlation spectroscopic imaging of exponential decays: From theoretical principles to in vivo human applications. NMR Biomed 2020;33:e4244
3. Petitclerc L, Sebastiani G, Gilbert G, et al. Liver fibrosis: Review of current imaging and MRI quantification techniques. J Magn Reson Imaging 2017;45:1276-1295
4. Kumar D, Nguyen TD, Gauthier SA, et al. Bayesian algorithm using spatial priors for multiexponential T(2) relaxometry from multiecho spin echo MRI. Magn Reson Med 2012;68:1536-1543
5. Schwammle V, Jensen ON. A simple and fast method to determine the parameters for fuzzy c-means cluster analysis. Bioinformatics 2010;26:2841-2848
6. Boyd MCaS. CVX: Matlab software for disciplined convex programming, version 20 beta. 2.0 ed. Matlab; September 2013
7. Lu Y, Wang Q, Zhang T, et al. Staging Liver Fibrosis: Comparison of Native T1 Mapping, T2 Mapping, and T1rho: An Experimental Study in Rats With Bile Duct Ligation and Carbon Tetrachloride at 11.7 T MRI. J Magn Reson Imaging 2021
Figures

Figure1: Original T1ρ images (TSL=0.06s, top row), T1ρ map (middle row) and Cluster spatial map (bottom row) of five CCI4 model rats (grading as F0, F1, F2, F3, F4, respectively).
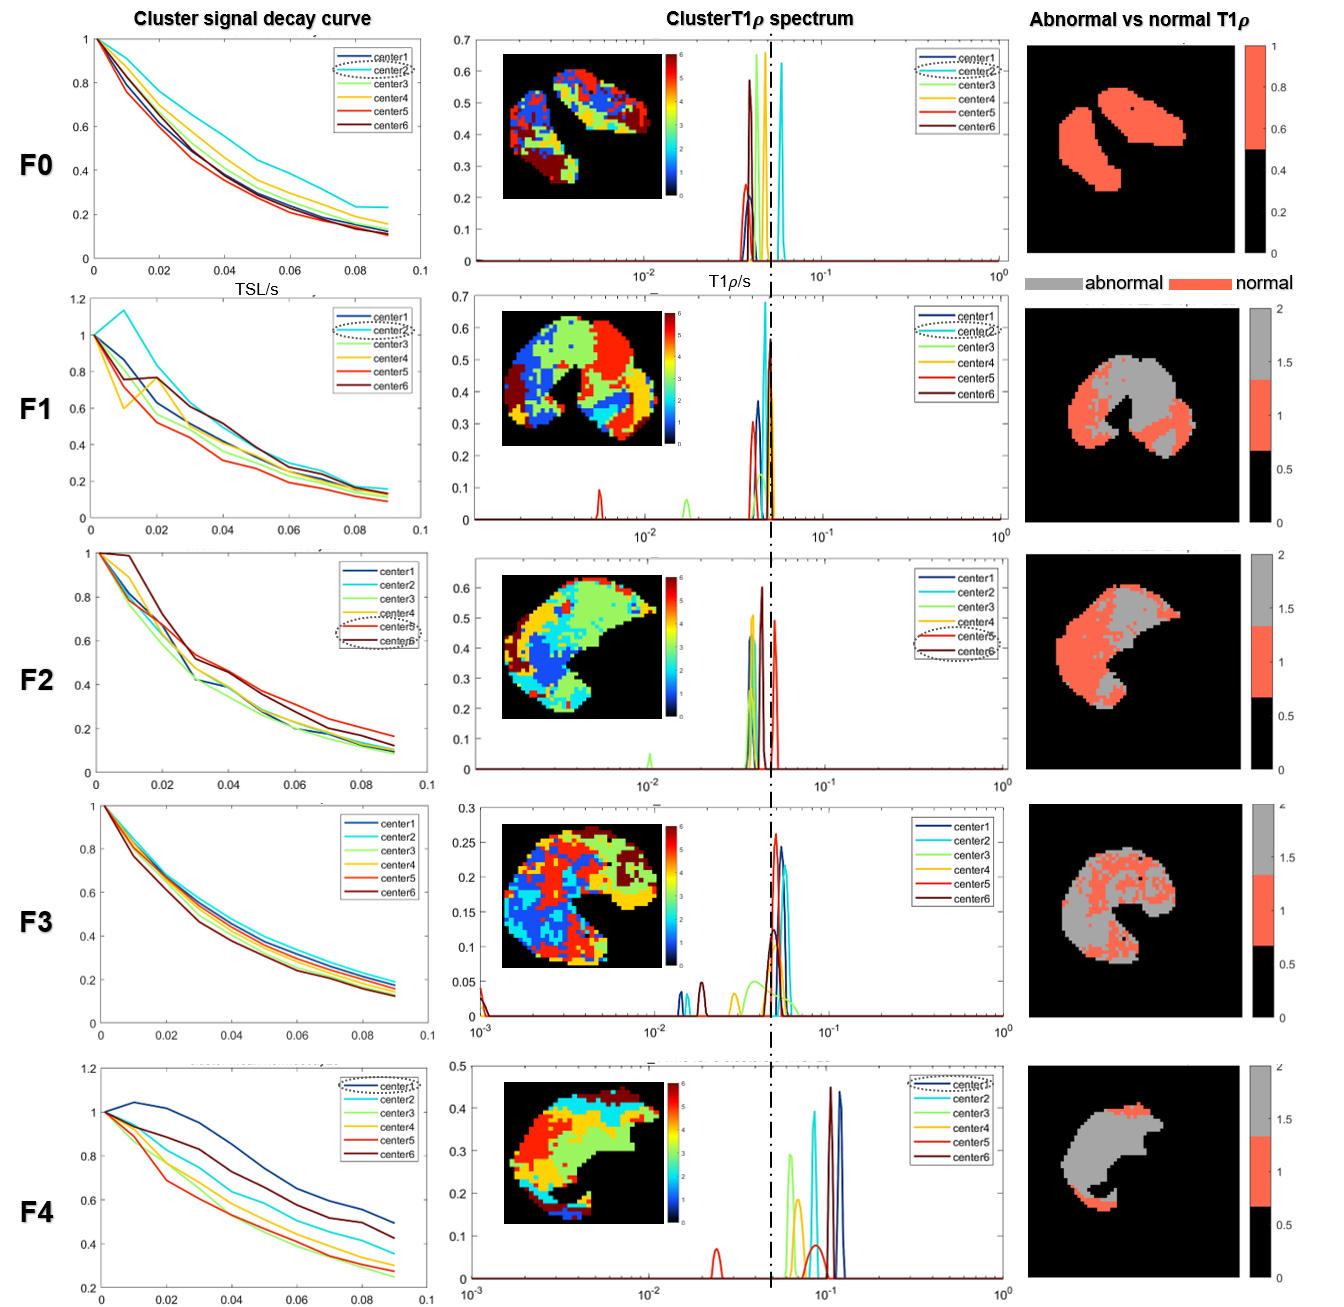
Figure 2: Plots of signal decay, T1ρ spectrum and clusters map. Left column: smoothed signal curve of centers representing 6 clusters of each rat in different fibrosis stages. Middle column: calculated T1ρ spectrum and clusters maps. “—·—·” is refence line distinguishing the normal and abnormal T1ρ peaks. Circle in dashed line means the eliminated noisy signals. Right column: spatial map of abnormal T1ρ clusters contrasted with normal region.
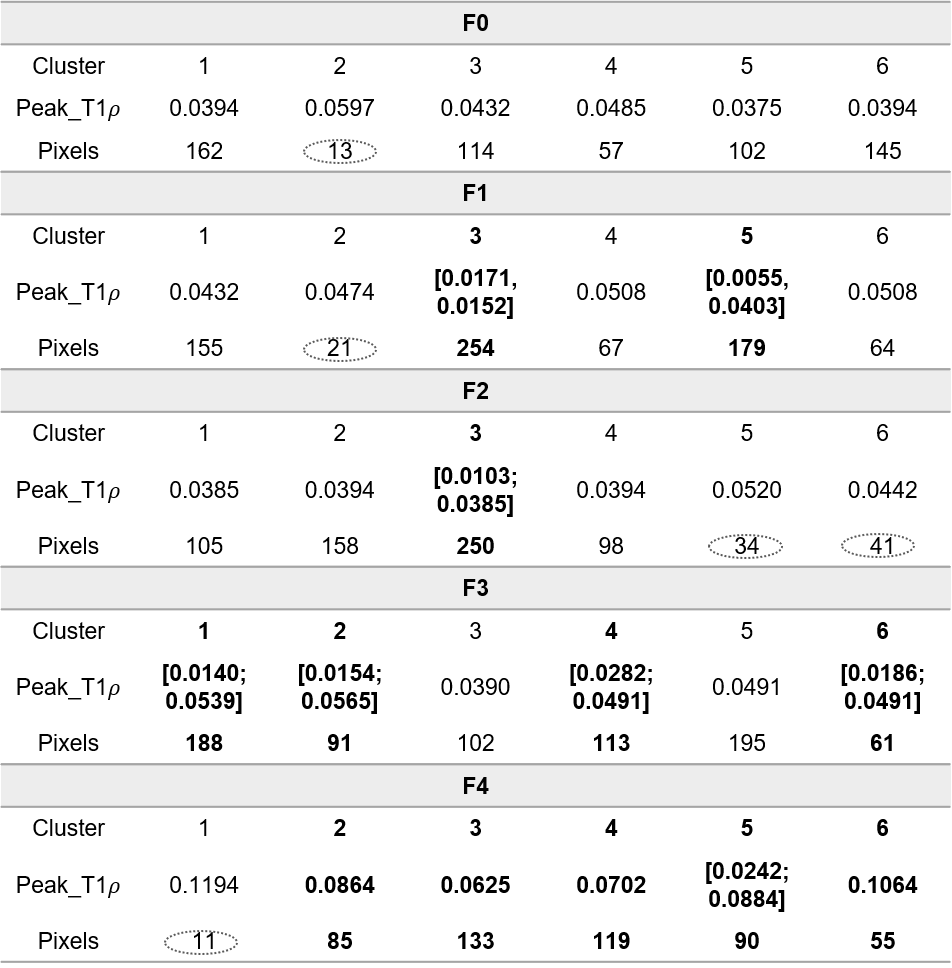
Table 1: Values of T1ρ (unit: s) peaks shown in Figure 2 and the number of pixels in corresponding clusters. Bold fonts infer to the clusters with abnormal T1ρ. Circle in dashed lines mean the eliminated noisy signals accounted small among ROI of each rat.
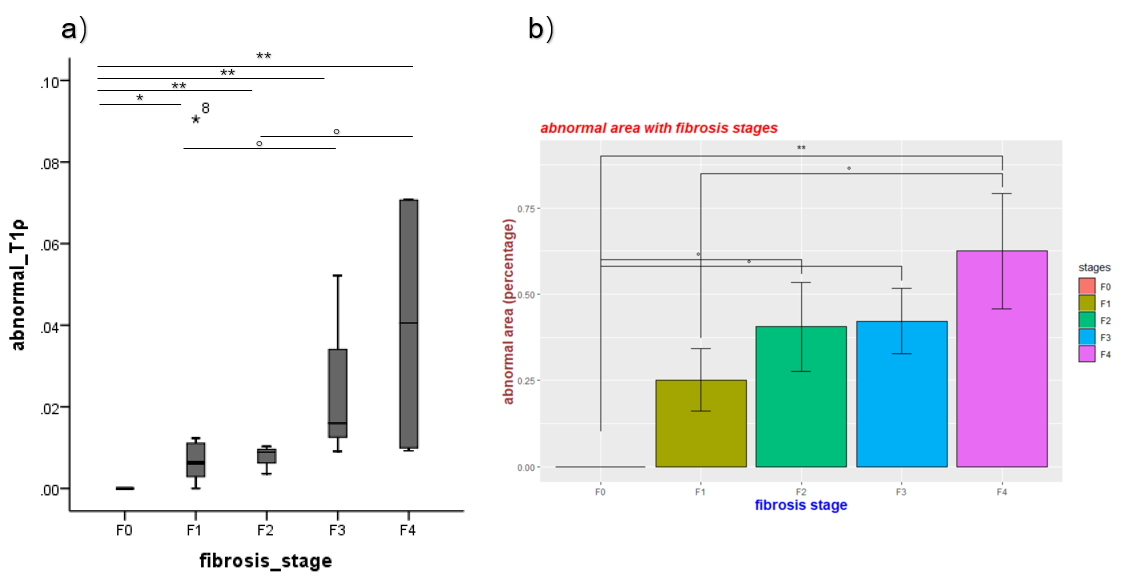
Figure 3: Statistical analysis results. a) U test for abnormal T1ρ and b) ANOVA test for abnormal area among F0-F4 fibrosis stages (“**”: P<0.01, “*”: P<0.05, “ 。”: P<0.1).