3788
3D texture analyses of quantitative susceptibility maps to differentiate patients with Wilson’s disease from healthy controls1Shanghai Key Laboratory of Magnetic Resonance, School of Physics and Electronic Science, East China Normal University, Shanghai, China, 2Department of Neurology, Shanghai Tong-Ren Hospital, Shanghai Jiao Tong University School of Medicine, Shanghai, China, 3Shanghai Mental Health Center, Shanghai Jiao Tong University School of Medicine, Shanghai, China, 4MR Scientific Marketing, Siemens Healthineers, Shanghai, China, 5Department of Radiology, Weill Medical College of Cornell University, New York, NY, United States
Synopsis
Abnormal metal accumulation in deep gray matter (DGM) nuclei of patients with Wilson’s disease (WD) could be detected using quantitative susceptibility mapping (QSM), yet no study has quantitatively evaluated how the textures of susceptibility maps might evolve with WD. The aim of this study was to evaluate texture features extracted from susceptibility maps of DGM nuclei for differentiating WD from healthy controls (HC). The results showed that part of the texture parameters was significantly different between WD and HC, meanwhile the receiver operating characteristic curve revealed that some second-order texture parameters were more suitable and sensitive for diagnosis of WD.
Purpose
Studies reported that magnetic susceptibility values in deep gray matter (DGM) nuclei of patients with Wilson’s disease (WD) were significantly higher than those in healthy controls (HC) (1-3). Image texture analysis can quantitatively extract local properties that reflect variations and distributions within structure and enhances the diagnosis accuracy (4, 5). The objectives of this study were to quantitatively evaluate texture changes of susceptibility maps in DGM nuclei to discriminate WD patients from HC and to evaluate their sensitivities in diagnosing WD.Materials and Methods
A total of 14 patients with WD with a mean age of 28.07 ± 9.60 years old (10 males and 4 females) and 14 age-matched HC with a mean age of 28.21 ± 9.20 years old (9 males and 5 females) were studied on a clinical 3T MR imaging scanner (Magnetom Trio Tim, Siemens Healthcare, Erlangen, Germany) with a 12-channel matrix coil.The susceptibility maps were generated from a three-dimensional spoiled multi-echo gradient-echo sequence with the following parameters: TR = 60ms, TE1 = 6.8ms, ΔTE = 6.8ms, echo number = 8, flip angle = 15˚, FOV = 240mm*180mm, in-plane resolution=0.625mm*0.625mm, slice thickness = 2mm, number of slices = 96. Standard T1-weighted, T2-weighted and T2-weighted fluid-attenuated inversion recovery images were also obtained on these subjects to exclude potential brain abnormalities and microvascular lesions.
The susceptibility maps were reconstructed by using the morphology-enabled dipole inversion toolbox (http://pre.weill.cornell.edu/mri/pages/qsm.html). Six regions of interest (ROIs) were drawn manually on the susceptibility maps by two researchers who were blinded to subject demographics, including head of caudate nucleus (CN), putamen (PUT), globus pallidus (GP), substantia nigra (SN), red nucleus (RN), and dentate nucleus (DN) (Fig. 1). 3D first- and second- order texture analyses of the segmented ROIs were conducted using MaZda software (http://www.eletel.p.lodz.pl/programy/mazda/, Lodz, Poland). The first-order texture parameters included mean and standard deviation (SD). The second texture parameters included angular second moment (AngScMom), contrast, correlation, difference of variance (DifVarnc), inverse different moment (InvDfMom), entropy, sum of entropy (SumEntrp), difference of entropy (DifEntrp), sum of average (SumAverg), sum of variance (SumVarnc), and sum of squares (SumOfSqs).
The group differences of texture parameters between WD and HC were evaluated by using the Mann-Whitney U test. The sensitivity and specificity of the texture parameters of susceptibility maps to distinguish patients with WD from HC were analyzed by receiver operating characteristic (ROC) curves. All statistical analyses were carried out using IBM SPSS Statistics 23 and MATLAB R2010b (MathWorks, MA, USA) based program.
Results
The results of the first- order texture analyses of DGM nuclei in the two groups are shown in Fig. 2. There were significant differences in mean susceptibility between WD and HC in the PUT (p = 0.040), GP (p = 0.020), SN (p < 0.001), and RN (p = 0.007). The SD of susceptibility values showed significant difference between WD and HC in the GP (p = 0.020), SN (p = 0.003), and RN (p = 0.007).Multiple ROIs showed the discriminative power of the second-order texture parameters of the susceptibility maps between WD and HC after multiple comparisons. In the CN, significant differences were found between the two groups in AngScMom (p = 0.036), Contrast (p < 0.001), Correlation (p = 0.004), SumOfSqs (p = 0.008), InvDfMom (p < 0.001), SumAverg (p = 0.007), DifVarnc (p = 0.028), and DifEntrp (p = 0.009). In the PUT, there were significant differences between the two groups in Contrast (p=0.006), Correlation (p=0.005), and DifVarnc (p=0.013). In the GP, there were significant differences between the two groups in Contrast (p < 0.001), Correlation (p = 0.004), DifVarnc (p = 0.004), and DifEntrp (p = 0.007). In the SN, there were significant differences in AngScMom (p < 0.001), Contrast (p = 0.003), Correlation (p = 0.003), InvDfMom (p = 0.009), SumEntrp (p < 0.001), Entropy (p < 0.001), DifVarnc (p = 0.009), and DifEntrp (p = 0.003) between WD and HC. In the RN, there were significant differences between WD and HC in Contrast (p = 0.006), Correlation (p = 0.005), SumEntrp (p = p < 0.001), Entropy (p < 0.001), and DifEntrp (p = 0.015). However, there were no significant differences of second-order parameters in DN between WD and HC.
The ROC results of the QSM texture parameters between WD and HC are summarized in Table 1. For the first-order texture analyses, mean susceptibility of SN provided the highest AUC of 0.890. Part of second-order texture parameters had relatively higher AUC to classify WD patients from HC than the first-order texture parameters. SumEntrp of SN provided the highest AUC of 0.949.
Discussion and conclusions
This was the first study to reveal the distribution of susceptibility values in the DGM nuclei of patients with WD using second-order texture analysis. Second-order texture parameters in multiple ROIs successfully distinguished WD and HC. ROC analysis showed that part of the second-order texture parameters was more efficient in differentiating WD from HC than the first-order texture parameters, which would enable better disease prediction. In summary, texture analysis of susceptibility maps is a practical method to assess the spatial difference of iron deposition in the DGM nuclei of patients with WD.Acknowledgements
This study was supported by Microscale Magnetic Resonance Platform of ECNU.References
1. Li G, Wu R, Tong R, Bo B, Zhao Y, Gillen KM, et al. Quantitative Measurement of Metal Accumulation in Brain of Patients With Wilson's Disease. Mov Disord. 2020 Oct;35(10):1787-1795.
2. Yuan XZ, Li GY, Chen JL, Li JQ, Wang XP. Paramagnetic Metal Accumulation in the Deep Gray Matter Nuclei Is Associated With Neurodegeneration in Wilson's Disease. Front Neurosci. 2020;14:573633.
3. Fritzsch D, Reiss-Zimmermann M, Trampel R, Turner R, Hoffmann KT, Schafer A. Seven-tesla magnetic resonance imaging in Wilson disease using quantitative susceptibility mapping for measurement of copper accumulation. Invest Radiol. 2014;49(5):299-306.
4. Li G, Zhai G, Zhao X, An H, Spincemaille P, Gillen KM, et al. 3D texture analyses within the substantia nigra of Parkinson's disease patients on quantitative susceptibility maps and R2( *) maps. Neuroimage. 2019;188:465-72.
5. Zhang J, Yu C, Jiang G, Liu W, Tong L. 3D texture analysis on MRI images of Alzheimer's disease. Brain Imaging Behav. 2012;6(1):61-9.
Figures

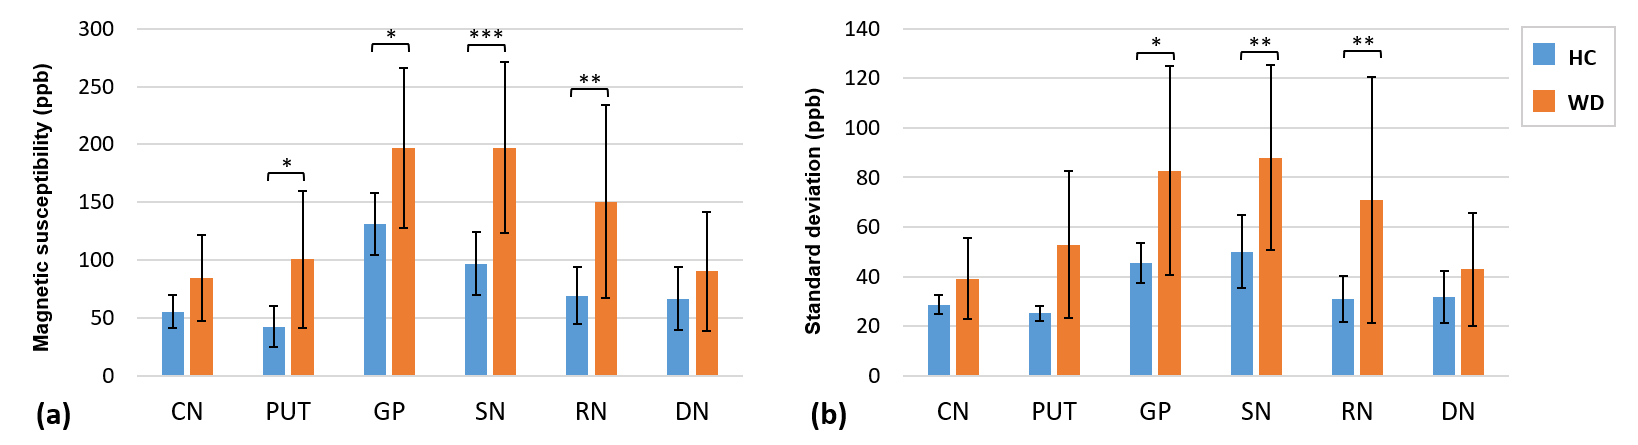

Table 1. Partly results of the ROC curve analyses of the susceptibility maps between patients with Wilson’s disease (WD) and healthy controls (HC)
Note: Results of the ROC curve analyses are expressed by p-value, area under the ROC curve (AUC), sensitivity (SS), and specificity (SP). We only show the second-order parameters of deep nuclei with higher AUC values than the mean susceptibility of SN.