3785
Striatum-thalamus microstructural alterations in levodopa-induced dyskinesia using four advanced diffusion models1Department of Radiology, The First Hospital of Jilin University, Changchun, China, 2Department of Neurology and Neuroscience Center, The First Hospital of Jilin University, Changchun, China, 3MR Scientific Marketing, Siemens Healthineers, Beijing, China, 4Shanghai Key Laboratory of Magnetic Resonance, East China Normal University, Shanghai, China
Synopsis
The major complication of dopaminergic therapy in Parkinson’s disease (PD) is dyskinesia which affects patients' quality of life. The pathogenesis of levodopa-induced dyskinesia (LID) remains unclear. In this study, we aimed to investigate striatum-thalamus alterations in PD patients with and without LID using advanced diffusion magnetic resonance imaging (dMRI) techniques (DTI, DKI, NODDI and MAP).
Introduction
About 40% of Parkinson's disease patients treated with levodopa therapy for 4-6 years develops abnormal voluntary movement[1], also known as levodopa-induced dyskinesia (LID).It is generally acknowledged that abnormal dopaminergic regulation of cortico-basal ganglia motor loops results in the emergence of LID[2],previous microstructure studies have reported striatal dendrite or dendritic spines changes and electro physiological changes related to the cortical-striatal-thalamic loop in LID models [3].According to a recent study, changesof precentral gyri GM volumes might be associated with the pathogenesis and the severity of diphasic dyskinesia[4]. Besides, diffusion weighted imaging(DWI)and advanced diffusion models such as mean apparent propagator (MAP) MRI, neurite orientation dispersion and density imaging (NODDI), diffusion kurtosis imaging (DKI), and diffusion tensor imaging (DTI) hold great promise in studying the pathophysiology of Parkinson's disease in current research. The purpose of this study is to evaluate striatum-thalamus loop alterations in Parkinson’s disease with levodopa induced dyskinesia by analyzing GM volume alterations and using advanced diffusion models including MAP-MRI, NODDI, DKI and DTI.Methods
We enrolled 12 PD patients including 5 PD patients withLID (LID group)and 7PD patients without LID (nLID group) for this study. Patients with diagnoses of Parkinson’s disease were based on the Movement Disorder Society (MDS) criteria [5]. LID presence was defined by two experience neurologists, according to a detailed interview,medical records, and involuntary movements in the post-acute levodopa time window. MRI data were acquired on a 3T systems (MAGNETOM Vida, Siemens Healthcare, Erlangen, Germany)including T2-weighted imaging (T2WI), 3D-T1-weighted imaging (T1WI), FLAIR,and diffusion spectrum imaging (DSI) with a q-space Cartesian grid sampling procedure.Specifically, the diffusion-weighted data were acquired in the axial plane using the DSI sequence with 99 diffusion gradient directions and maximum b value 3000s/mm2. The sequence parameters were as follows: TR/TE =3000/93ms, FOV=220 mm×220 mm, GRAPPA =2, slice thickness =4.0 mm, number of slices = 32, acquisition time =7 min 35s. All DSI data were calculated using the software (NeuDiLab) developed in-house based on the open resource toolDIPY (Diffusion Imaging In Python, http://nipy.org/dipy). Specifically, intracellular volume fraction (ICVF), isotropicvolume fraction (ISOVF), and orientation dispersion index (ODI) maps were generated using the fitting algorithm of the NODDI model. Non-Gaussian (NG), parallel (NG∥) with and perpendicular (NG⊥) to the principal eigenvector of the diffusion tensor NG, mean-squared displacement (MSD), q-space inverse variance (QIV), return-to-axis probability(RTAP), return-to-origin probability (RTOP), and return-to-plane probability (RTPP) were computed using the MAP-MRImodel. Axial, radial, and mean diffusivity (AD, RD, MD) and fractional anisotropy (FA) were calculated using the DTImodel. Radial, axial, and mean kurtosis (RK, AK, MK), MD, AD, RD, and FA maps were computed using the DKImodel. Caudate, pallidum, putamen, and thalamus are region of interests (ROI).For each case, ROIs were manually drawn to delineate the largest cross-sectional area of on B0 images by two neuroradiologists. The ROIs were copied to all parametric diffusion maps to calculate corresponding average values.The mean values of the two measurements in the ROIs were used in the statistical analysis. The volumes of ROIs were calculated based on the Anatomical Automatic Labeling (AAL) template by an in-house developed software Brainquantool[6]. The independent samples t-test was used to compare diffusion parameter values between the two groups, and p<0.05 was considered statistically significant. The associations between the diffusion parameters and Clinical assessment were assessed by using Spearman correlation.All statistical analyses were performed by using Statistical Product and Service Solutions (SPSS) 26.0 software (SPSS Inc., Chicago, IL, USA).Results & Discussion
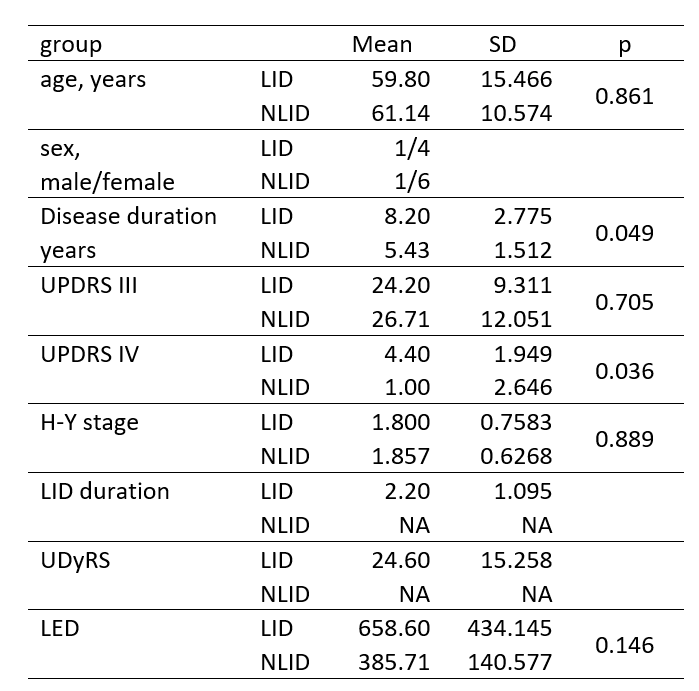
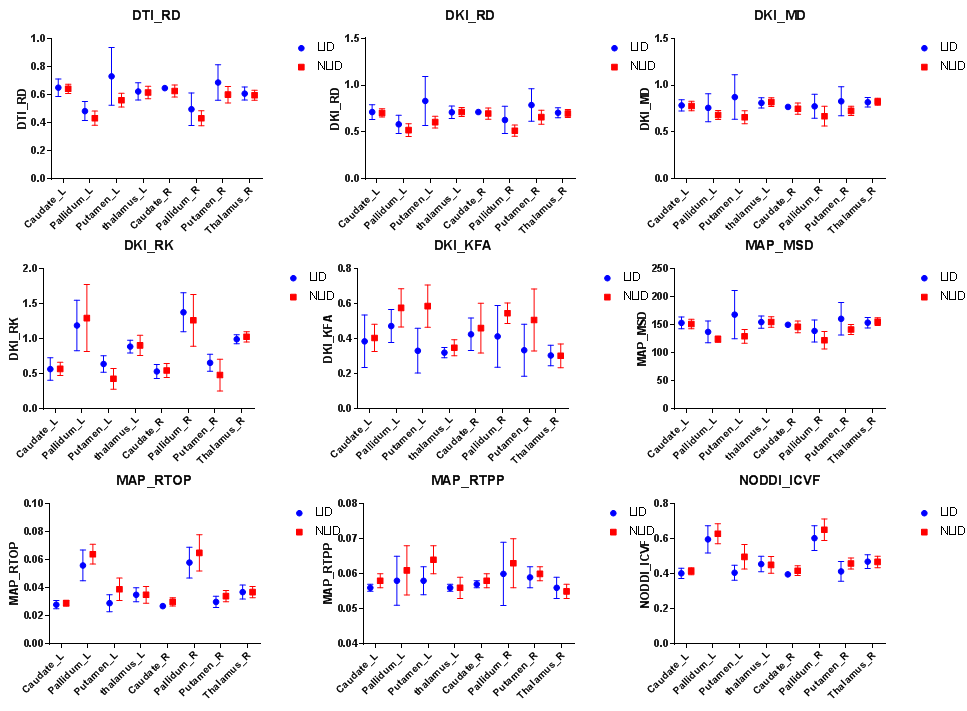
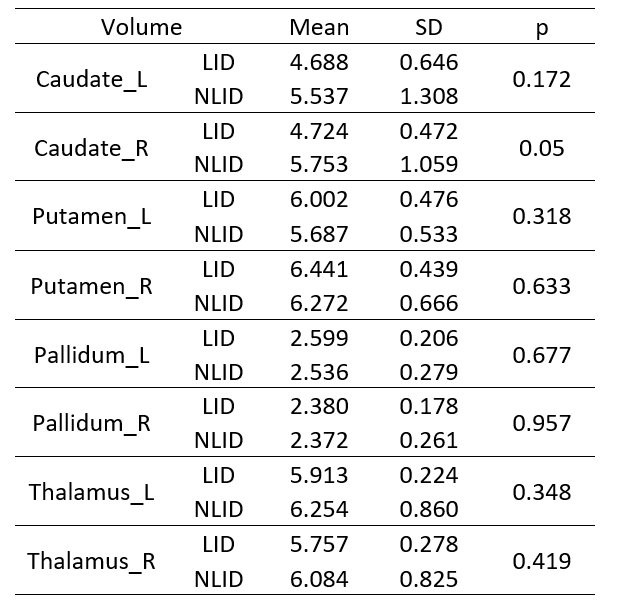
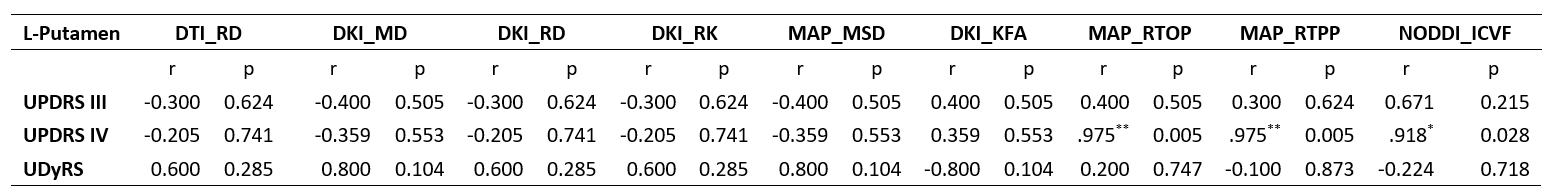
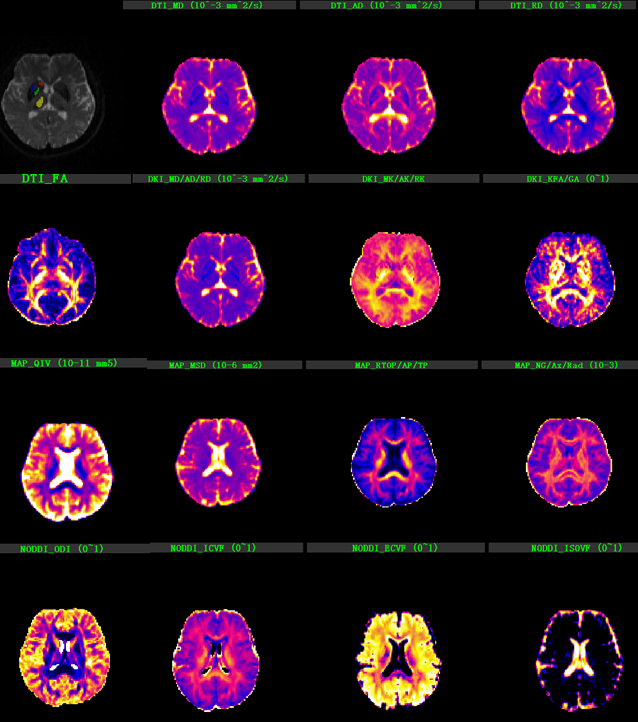
Figure 1 shows the background and clinical data of enrolled subjects.Patients with LID and nLID were not significantly different in the age, disease duration, H-Y stage, and MDS-UPDRS III score (p>0.05), but were significantly different inMDS-UPDRS IV score, and UDyRS (p<0.05).The diffusion parameter values of the bilateral caudate, pallidum,putamen, thalamus, in each group are shown in Figure 2. FA is dimensionless;RD, MD, MSDare expressed in 10−3mm2s−1, RTOPare expressed in 107mm-3.Compared with nLID patients, LID patients had lower MAP-NGRad values in the left caudate, higher values of DTI-RD, DKI-MD, DKI-RD, DKI-RK, MAP-MSD in the left putamen,and lower values of DKI-KFA, MAP-RTOP, MAP-RTPP, NODDI-ICVF in left putamen(all P <0.05). There were no significant volumes of ROIs difference between LID patients and without dyskinesia (p>0.05), the results of the volume analysis are presented in Figure 3.Spearman correlation analysis showed that MAP-RTOP, MAP-RTPP, NODDI-ICVF of the left putamen (r = 0.975, p = 0.005;r = 0.975, uncorrected p = 0.005;r = 0.918, p = 0.028) were positively correlated with MDS-UPDRS IV score.Results of correlation analyses between left putamen parameter values and UPDRS-III,UPDRS IV,UDyRS scores are presented in Figure 4. Example of manual ROI segmentations and diffusion parameter map were shown in Figure 5.Conclusion
Our findings suggested that Parkinson’s disease with levodopa-induced dyskinesia produces microstructural disruption in left caudate and putamen, especially in left putamen. MAP MRI can reflect the severity of dyskinesia.Acknowledgements
No acknowledgement foundReferences
1.J.E. Ahlskog, M.D. Muenter, Frequency of levodopa-related dyskinesias and motor fluctuations as estimated from the cumulative literature, Mov. Disord. 16 (2001)448–458.
2.Herz DM, Haagensen BN, Christensen MS, Madsen KH, Rowe JB, Løkkegaard A, Siebner HR. Abnormal dopaminergic modulation of striato-cortical networks underlies levodopa-induced dyskinesias in humans. Brain. 2015; 138:1658–66.
3.T. Fieblinger, M.A. Cenci, Zooming in on the small: the plasticity of striatal dendritic spines in L-DOPA-induced dyskinesia, Mov. Disord. 30 (4) (2015) 484–493.
4. Yan Zhi1, Min Wang2,Yong-Sheng Yuan, Yu-Ting Shen,The increased gray matter volumes ofprecentral gyri in Parkinson's disease patients with diphasic dyskinesia. Aging.2019;11(21)9661-9671.
5. R.B. Postuma, D. Berg, M. Stern, W. Poewe, C.W. Olanow, W. Oertel, J. Obeso, K. Marek, I. Litvan, A.E. Lang, G. Halliday, C.G. Goetz, T. Gasser, B. Dubois, P. Chan, B.R. Bloem, C.H. Adler, G. Deuschl, MDS clinical diagnostic criteria for Parkinson’s disease, Mov. Disord. 30 (12) (2015) 1591–1601.
6. F. Xiang Feng, L.X. Meng, Y. Guang, BrainQuan: an integrated tool for automatedandregion-specific analysis of multi-parametric brain MRI data, Proceedings of the27th Annual Meeting of ISMRM, Montreal (2019) abstract 1591.
Figures