3782
Virtual Stiffness of Gray Matter in Normal Adult Brain Assessed by Virtual Magnetic Resonance Elastography1The First Affiliated Hospital of Xi’an Jiaotong University, Shaanxi, Xi'an, China
Synopsis
The mechanical properties of biological tissue provide information related to the strength and integrity of the cellular microstructure. Recently, mechanical properties of the brain have been visualized and measured non-invasively with magnetic resonance elastography (MRE). Virtual MRE (VMRE) is based on non-Gaussian distribution model, which can be regarded as an indicator to reflect the complexity and change of different brain microstructure. The purpose of this study is to explore the capability of diffusion–based VMRE in the characterization of the gray matter shear stiffness, discuss the cause of the differences of gray matter encephalic in normal human brains.
Synopsis
In recent years, mechanical properties of the brain have been visualised and measured non-invasively with magnetic resonance elastography (MRE), a particularly sensitive medical imaging technique that may increase the potential for early diagnosis [1]. Virtual MR Elastography (VMRE) is based on non-Gaussian distribution model, which can be regarded as an indicator to reflect the complexity and change of different brain microstructure. The purpose of this study is to explore the capability of diffusion–based virtual MR elastography (VMRE) in the characterization of the gray matter shear stiffness, discuss the cause of the differences of gray matter encephalic in normal human brains.Main Synopsis
Explore the capability of diffusion–based virtual MR elastography (VMRE) in the characterization of the gray matter shear stiffness, discuss the cause of the differences of gray matter encephalic in normal human brains.Introduction
The connections between neurons in the cortex are very extensive and complex. In different parts of the cortex, the thickness of each layer, the distribution of various nerve cells and the density of fibers are different. The cerebral cortex is the neurons concentrated place, and it is the surface gray matter that makes up the trenches of the brain's two hemispheres. The stiffness value depends on the complexity of brain tissue structure. Therefore, stiffness value can better reflect the microstructure of gray matter. Since VMRE is non-Gaussian, the value of stiffness is proportional to the degree of diffusion limitation of water molecules with non-Gaussian distribution in this direction[2].According to the different characteristic of cortex and function, can divide cortex into a certain number of areas.Materials and Methods
This study enrolled 30 adults (13 males and 17 females, average age 22.78 years, S=1.46) without abnormalities on magnetic resonance imaging from the First Affiliated Hospital of Xi’an Jiaotong University. DKI was performed by using a single shot echo planar imaging sequence with following parameters: b values = 0, 50, 200, 500, 1000, 2000, 2500 s/mm2; 18 gradient directions per nonzero b value; NEX = 1; repetition time/echo time = 11000/91.7 ms; slice thickness = 4 mm; field of view = 240 × 240 mm2; acquisition matrix =172 × 172; the acquisition voxel size = 1.4 × 1.4 × 4 mm3. Diffusion weighted images of the lower b-value (Slow, b value = 200 s/mm2) and those of the higher b-value (Shigh, b value = 1000 s/mm2) were used to estimate the virtual shear stiffness [2,3]: virtual shear stiffness = a·ln (Slow/Shigh) + b. The scaling (a) and the shift (b) factors were separately set to −9.8 and 14 according to the previous calibration studies [2,3].This study created b0 templates for adults, by using the group-wise method. Original b0 maps were normalized to their corresponding templates by using the combination of linear and nonlinear registrations (Ball et al., 2010; Li et al., 2016). Other metrics were normalized into the common space by using deformation parameters ofb0. According to the Harvard-Oxford cortical and subcortical structural atlases (https://fsl.fmrib.ox.ac.uk/fsl/fslwiki/Atlases) [5,6,7,8] divided gray matter into 117 regions.
Results
A total of 30 adults were enrolled, it can be found that the gray matter virtual shear stiffness of the left and right brain. The stiffness of the frontal lobe, Left Superior Frontal Gyrus had the lowest value 6.654, and Right Frontal Medial Cortex had the highest 7.692 (Table 1). The stiffness of the parietal lobe, Left Superior Parietal Lobule had the lowest 6.662, and Left Angular Gyrus had the highest 7.514 (Table 2). For the temporal pole, Right Planum Temporal had the lowest 6.150, and Right Temporal Occipital Fusiform Cortex had the highest 8.236 (Table 3). For the occipital lobe, Left Precuneous Cortex had the lowest 7.016, and Left Occipital Fusiform Gyrus had the highest 8.276 (Table 4). For the operculum, Right Parietal Operculum Cortex had the lowest 6.958, and Left Frontal Operculum Cortex had the highest 7.670 (Table 5).For the limbic system, Left Subcallosal Cortex had the lowest 6.154, and Right Paracingulate Gyrus had the highest 7.578(Table 6). And for the subcortical nuclei, Right Pallidum had the lowest 6.366, and Right Putamen had the highest 8.365 (Table 7).Discussion
The results of this study showed that the virtual shear stiffness of different cerebral regions of the bilateral cerebral cortex were statistically significant, and the possible related to the complexity of the structure of the gray matter: the study showed that the cortical and subcortical internal structure was complex, which could be divided into different neural nuclei according to the cell structure and functional location. Gray matter is mainly composed of neuron cell bodies, the complex structure of gray matter nucleus, the compact nucleus of nerve and the cross fiber structure reflect the difference of gray matter structure. Through the conversion of MRE-derived measurements to shear stiffness (kPa) and, where possible, the loss tangent (rad), a summary of results for global brain tissue and grey matter across studies is provided for healthy participants, as potential baseline values to be used in future clinical investigations [1].conclution
The virtual shear stiffness values of gray matter varied across regions, providing basis for clinical applications. The value of left and right cerebral hemispheres are not completely symmetrical, suggesting the structural asymmetry.Acknowledgements
This study was supported by the National Natural Science Foundation of China (81901823, 81971581, and 81901516), the Innovation Team Project of Natural Science Fund of Shaanxi Province (2019TD-018). Please address correspondence to Jian Yang, e-mail: yj1118@mail.xjtu.edu.cn.
References
[1] Magnetic resonance elastography (MRE) of the human brain: technique, findings and clinical applications, Lucy V Hiscox1,2,8, Curtis L Johnson3, Eric Barnhill4, Matt D J McGarry5,6, John Huston 3rd7, Edwin J R van Beek2, John M Starr1 and Neil Roberts2
[2] Yin, Z. , Romano, A. J. , Manduca, A. , Ehman, R. L. , & Huston, J. . (2018). Stiffness and beyond: what mr elastography can tell us about brain structure and function under physiologic and pathologic conditions. Topics in Magnetic Resonance Imaging, 27(5), 305-318.
[3] Le Bihan D, Ichikawa S, Motosugi U. Diffusion and intravoxel incoherent motion mr imaging-based virtual elastography: a hypothesis-generating study in the liver. Radiology, 2017, 285(2):609–619.
[4] Lagerstrand K, Gaedes N, Eriksson S, et al. Virtual magnetic resonance elastography has the feasibility to evaluate preoperative pituitary adenoma consistency. Pituitary, 2021, 24:530–541.
[5]Makris N, Goldstein JM, Kennedy D, Hodge SM, Caviness VS, Faraone SV, Tsuang MT, Seidman LJ. Decreased volume of left and total anterior insular lobule in schizophrenia. Schizophr Res. 2006 Apr;83(2-3):155-71
[6]Frazier JA, Chiu S, Breeze JL, Makris N, Lange N, Kennedy DN, Herbert MR, Bent EK, Koneru VK, Dieterich ME, Hodge SM, Rauch SL, Grant PE, Cohen BM, Seidman LJ, Caviness VS, Biederman J. Structural brain magnetic resonance imaging of limbic and thalamic volumes in pediatric bipolar disorder. Am J Psychiatry. 2005 Jul;162(7):1256-65
[7]Desikan RS, Ségonne F, Fischl B, Quinn BT, Dickerson BC, Blacker D, Buckner RL, Dale AM, Maguire RP, Hyman BT, Albert MS, Killiany RJ. An automated labeling system for subdividing the human cerebral cortex on MRI scans into gyral based regions of interest. Neuroimage. 2006 Jul 1;31(3):968-80.
[8]Goldstein JM, Seidman LJ, Makris N, Ahern T, O'Brien LM, Caviness VS Jr, Kennedy DN, Faraone SV, Tsuang MT. Hypothalamic abnormalities in schizophrenia: sex effects and genetic vulnerability. Biol Psychiatry. 2007 Apr 15;61(8):935-45
Figures
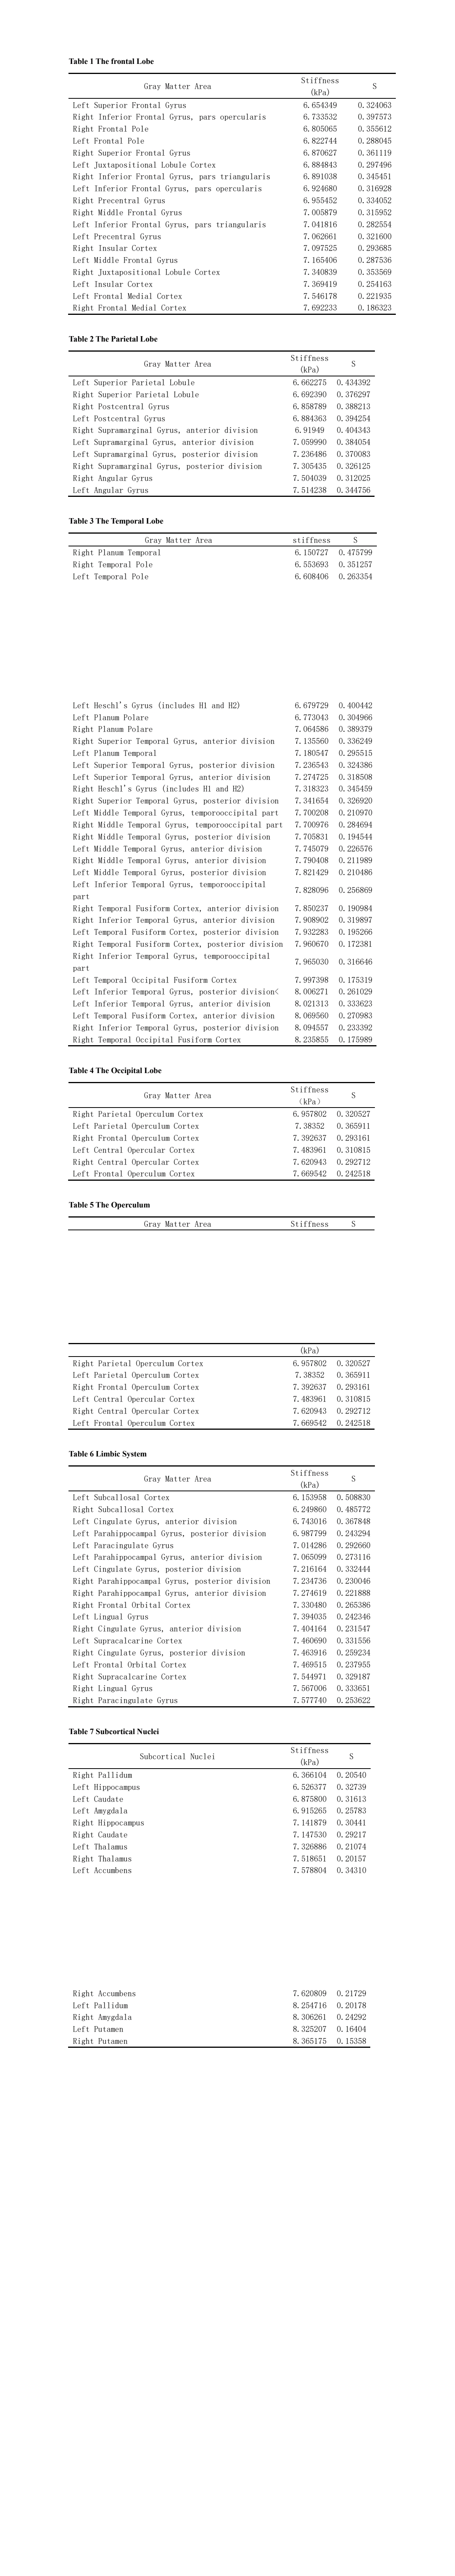
Table 1 The frontal Lobe
| Gray Matter Area | Stiffness (kPa) | S |
| Left Superior Frontal Gyrus | 6.654349 | 0.324063 |
| Right Inferior Frontal Gyrus, pars opercularis | 6.733532 | 0.397573 |
| Right Frontal Pole | 6.805065 | 0.355612 |
| Left Frontal Pole | 6.822744 | 0.288045 |
| Right Superior Frontal Gyrus | 6.870627 | 0.361119 |