3778
The application value of T2 weight imaging histogram in assessing the Placenta Accreta1Lanzhou University second hospital, lanzhou, China, 2Philips Healthcare, Xian, China
Synopsis
Accurate evaluation of placenta accreta before parturition can effectively avoid adverse maternal and infantile outcomes. Based on the T2 weighted imaging (T2WI) histogram, this study analyze the placenta quantitatively. We compared the difference in T2WI histogram parameters between the placenta accreta group (23 patients) and the non-placenta accreta group (27 patients) to evaluate the diagnostic efficacy. Among these parameters, the difference of 10 Percentile, Energy, Entropy, Total Energy, Uniformity was statistically significant (P<0.05). Uniformity and Entropy have the largest area under the curve (AUC). We speculate T2WI based histogram is useful for noninvasive assessment of placental implantation.
Introduction
Placenta accreta, caused by high-risk factors such as the history of cesarean section, placenta previa, advanced maternal age and multiple pregnancies, occurs when part or all of the placenta attaches to myometrium abnormally. It has become an important reason of postpartum hemorrhage, perinatal emergency hysterectomy and maternal death. The incidence rate is as high as 1/533, which is twenty times than before and increasing year by year.1 The accurate diagnosis of placenta accreta will provide an important clinical evidence for a personalized surgical planning, which can effectively avoid adverse maternal and infant outcomes. At present, Magnetic resonance imaging (MRI) mainly uses image signs to identify, locate and describe the area of placental invasion and the depth of implantation,2but the sensitivity and specificity still need to be improved. In this study, T2WI histogram was used to quantitatively analyze the placenta, and the difference of T2WI histogram related parameters were compared between the placenta accreta group and the non-placenta accreta group to predict its diagnostic value.Methods
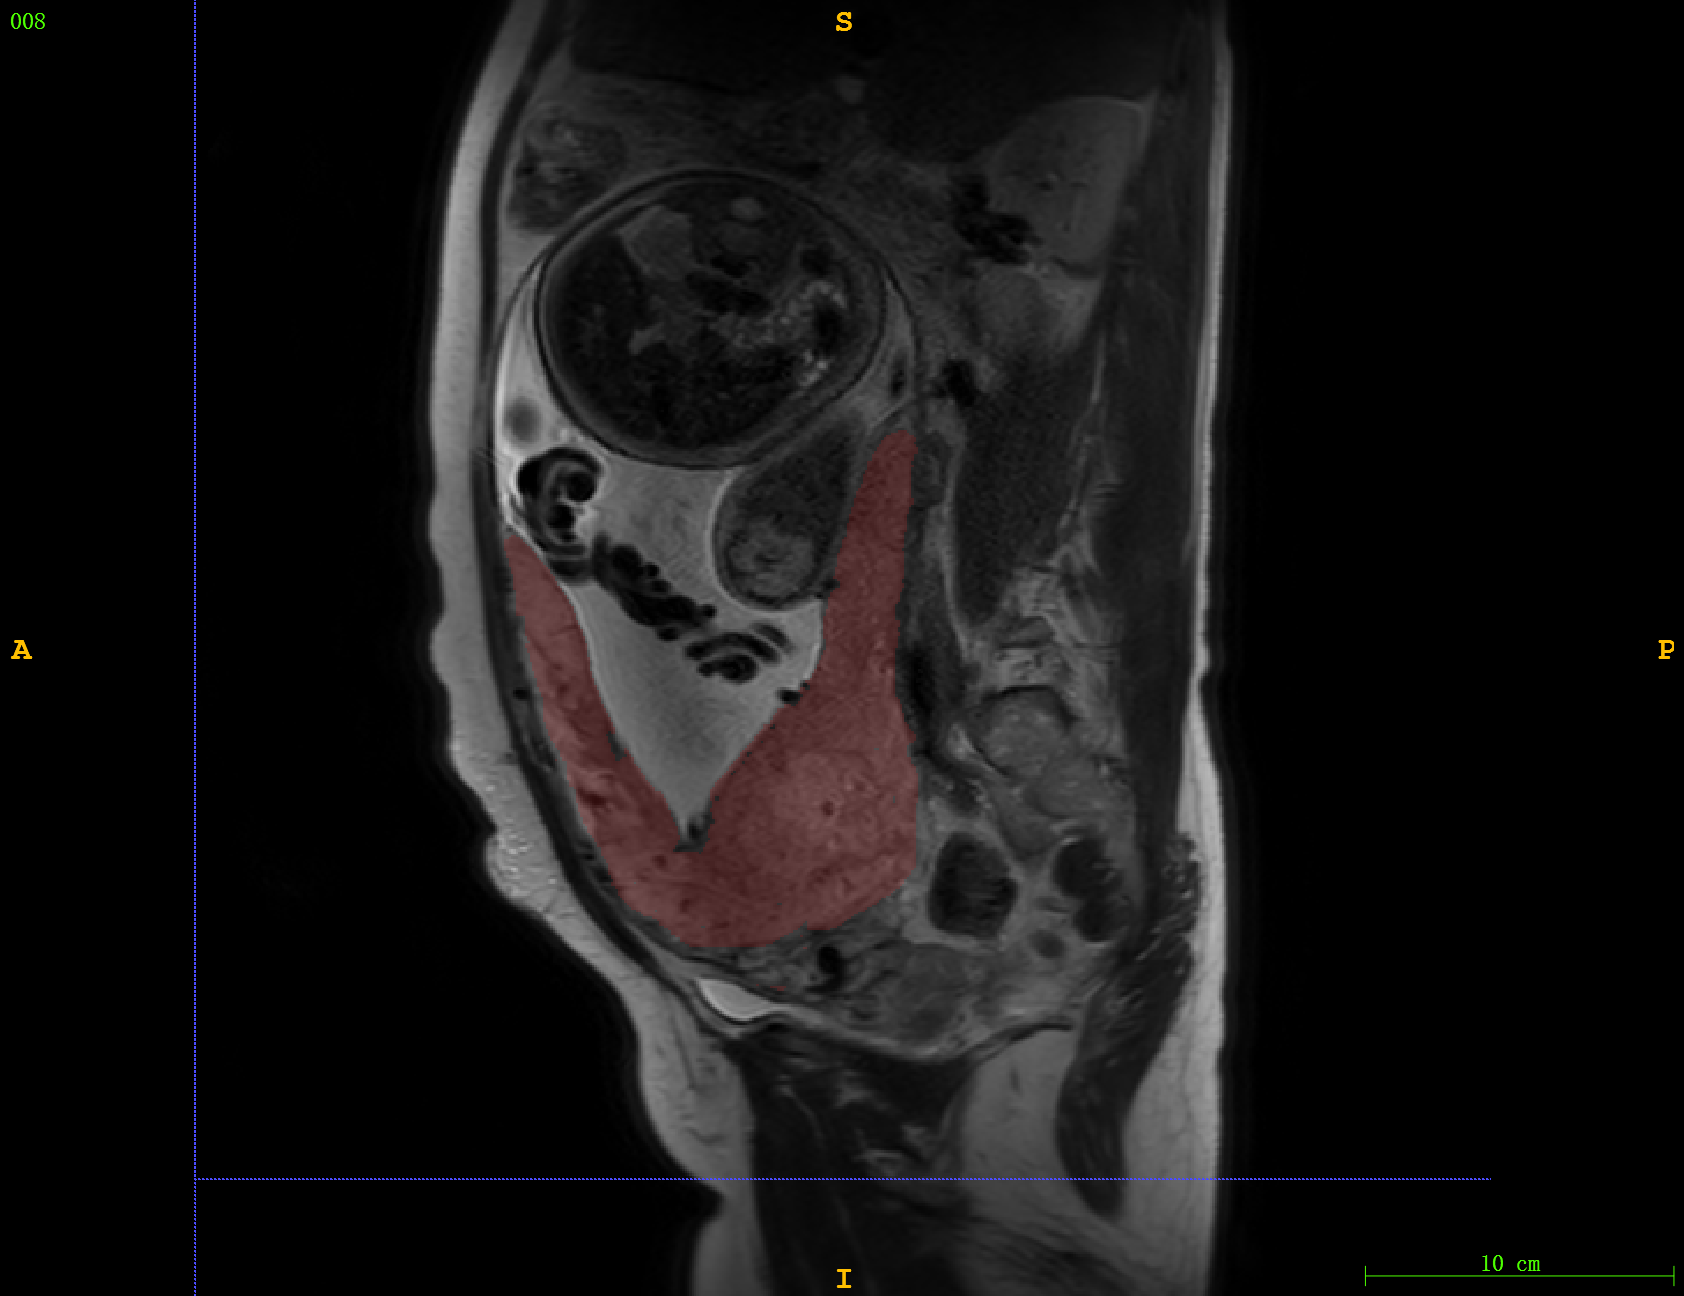
A retrospective analysis of 23 patients with placenta accreta diagnosed by clinical surgery and 27 patients without placenta accreta was performed. All subjects underwent MRI examinations on a 3.0T scanner (Ingenia CX, Philips Healthcare, the Netherlands) with 18-channel body phase array coil. T2WI was scanned by single-shot turbo spin echo (SSH) with the following parameters: repetition time = 15000 ms, echo time=115 ms, flip angle= 90 degree, matrix = 308 * 301, slice thickness = 4 mm, slice interval = 1mm, number of slice s = 30, FOV = 338 mm * 437 mm, number of excitations = 1. The anonymous SSH-T2WI images were import to ITK-SNAP software (v3.8) by two senior radiologists, with 6 years and 8 years of MR diagnostic experience respectively. They then delineated the placenta slice by slice(Figure 1). The 15 extracted and filtered histogram features by the FAE software as follows: 10 Percentile, 90 Percentile, Energy, Entropy, Interquartile Range, Kurtosis, Maximum, Mean, Median, Minimum, Range, Skewness, Total Energy, Uniformity, Variance. SPSS 26.0 was used for statistical analysis on the histogram parameters of no placenta accreta and placenta accreta. The intraclass correlation coefficient (ICC) was used to evaluate the consistency of the measurement results calculated by different physicians. And Kolmogorov-Smirnov (K-S) test was used to evaluate the normality of histogram parameters. The measurement data followed the normal distribution were expressed as x±s, and the independent sample t test was used for the comparison between groups. P<0.05 was considered statistically significant. The receiver operating characteristic (ROC) curve was used to evaluate the diagnostic efficiency of the parameters for placenta accreta.Results
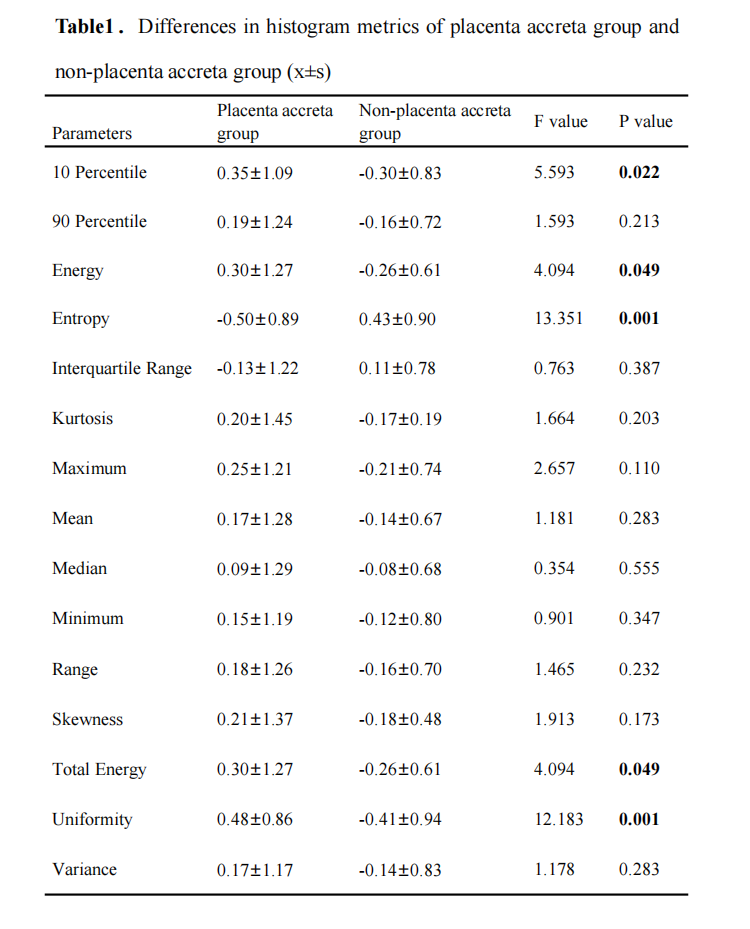
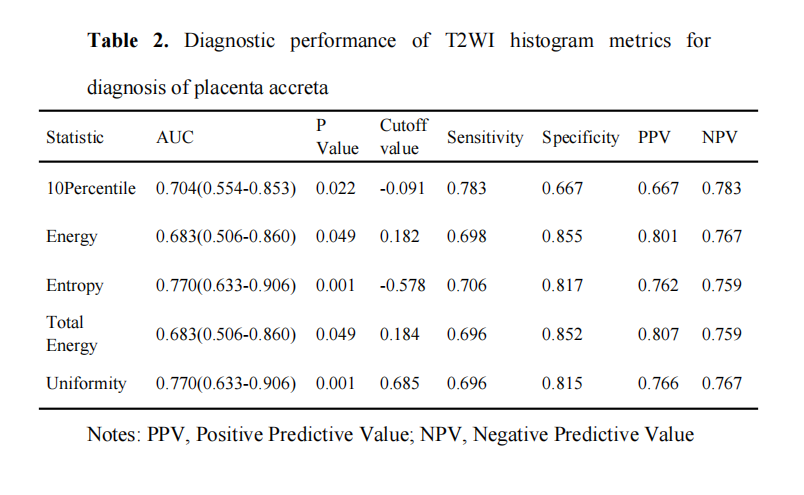
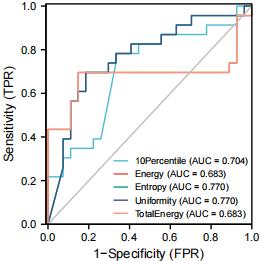
There was a statistically significant difference between the placenta accreta and non-placenta accreta groups in 10 Percentile, Energy, Energy, Total Energy, and Uniformity (P<0.05, Table 1). And the ROC results showed that, among the 5 histogram parameters with statistically significant differences between groups, Uniformity and Entropy had the largest area under the curve (AUC), both were 0.770 (P=0.001). The sensitivity of Uniformity is 69.6% and the specificity is 81.5%; the sensitivity of Entropy is 70.6% and the specificity is 81.7% (Table 2, Figure 2).Discussion
The clinical signs and laboratory examination indicators of placenta accreta are not typical,3 so it is difficult to accurate diagnosis of prenatal placenta accreta. At present, MRI is mainly used to diagnose and classify placenta by direct and indirect image signs, but there is no consensus at home and abroad, and its diagnostic efficiency still needs to be improved. Gray histogram analysis method can extract pixel or gray value distribution information of the ROI based on different MR sequences for analysis, and then obtain quantitative parameters’ information which is helpful for differential diagnosis, disease classification and prediction of treatment effect. It is easy to operate and has strong repeatability. This study evaluated the diagnostic value of placenta accreta by using T2WI histogram parameters and found that among 15 histogram features extracted and screened, only 10 Percentile, Energy, Entropy, Total Energy, and Uniformity were statistically significant. Moreover, ROC curve results showed that Uniformity and Entropy had high specificity and sensitivity in the diagnosis of placenta accreta. Therefore, T2WI histogram analysis can be used as an auxiliary tool for preoperative prediction of placenta accreta.Conclusion
Histogram analysis of T2WI images can be used as an objective and quantitative evaluation method of placenta accreta, hence offering a timely adjustment for treatment scheme with placenta accreta and effectively avoid the adverse maternal and infantile outcomes. Therefore, T2WI histogram analysis can be used as an auxiliary tool for preoperative prediction of placenta accreta.Acknowledgements
No acknowledgement found.References
1.Brett DE,et al., Magnetic resonance imaging is often misleading when used as an adjunct to ultrasound in the management of placenta accreta spectrum disorders. American journal of obstetrics and gynecology, 2018, 218 (06): 618-618.
2.Xia H, et al., Comparison between abdominal ultrasound and nuclear magnetic resonance imaging detection of placenta accreta in the second and third trimester of pregnancy. Medicine, 2020, 99(02): e17908.
3.Do QN, et al., OP19.01: Magnetic resonance imaging of placenta accreta spectrum disorders: radiomics analysis correlates to surgical and pathological outcome.Ultrasound in Obstetrics and Gynecology, 2019, 54 (S1): 148-148.
Figures