3777
Diffusion weighted imaging-Based Radiomic Features of Distincting Low and High Grade of Pediatric Brain Tumors1Hunan Children's Hospital, Changsha, China, 2Siemens Healthineers, Wuhan, China
Synopsis
This study investigated the feasibility of diffusion weighted imaging (DWI)-Based radiomic features in differential diagnosis of low- and high-grade pediatric brain tumors. The results showed that the DWI and apparent diffusion coefficient (ADC) combined model can effectively distinct low- and high-Grade pediatric brain tumors. This suggests that DWI sequence may facilitate brain tumor grading.
Introduction
With its ability to probe tissue cellularity, diffusion weighted imaging (DWI) has been gradually applied to tumor research to distinguish low and high grade brain tumors [1-3]. However, its clinical acceptance is limited because of substantial overlap of apparent diffusion coefficient values among different tumor grades for both adult and pediatric patients [4-6].Differentiating low- from high-grade brain tumors without the use of invasive biopsy is important to optimize patient management strategies, and determine the time point when benign tumors begin to transform into malignant lesions so that timely interventions can be applied without unnecessarily compromising patients’ quality of life. What’s more, high-grade tumors (eg, medulloblastoma and anaplastic ependymoma) can have a higher degree of tissue heterogeneity. However, The characteristic may not be adequately captured in a simple ADC apparent diffusion coefficient value or high signal in DWI image.Radiomics is a powerful tool to analyze large amount of quantitative features from the region of the cancer, and used data science to find the biomarkers that uncover insights into the complex tumor biology [7]. In this study, we explored the value of diffusion weighted imaging(DWI)-based radiomics in differential diagnosis of low- and high-grade pediatric brain tumors.
Methods
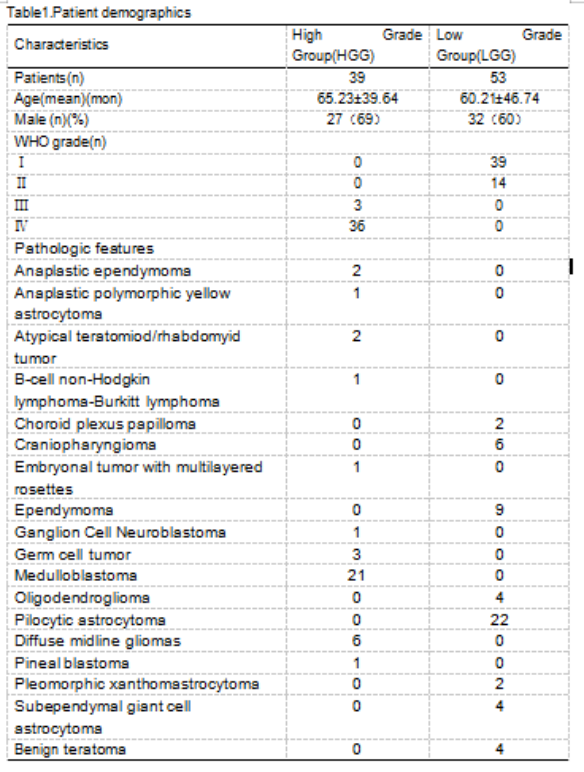
A total of 53 children with low-grade (WHO World Health Organization grade I or II) [8] tumors and 39 children with high-grade (WHO III or IV) tumors were assigned into the training set and test set at the ratio of 7:3 randomly(Table1).The DWI parameters were: TR/TE = 3800/79ms; FOV = 230×100mm ; voxel size = 1.4×1.4×5.0 mm3 ; 22 slices ;acquisition time = 1 min 43 sec. B value = 0,1000 s/mm2.MR images of DWI-b0,DWI-b1000 and ADC images were transferred from PACS workstations (Beijing Four Genes, China) to personal computers and then converted to processable DICOM format images using radiAnt DICOM Viewer software (available in http://www.radiantviewer.com).Two radiologists annotated on each contiguous image slice where the tumor was present on DWI-b0,DWI-b1000 and ADC images by using ITK SNAP (ver.3.4.0)(available from http://www.itksnap.org)(Figure1). 3D Areas of Interest (ROI) were agreed by 2-way-blinded, radiologist with 9 years of experience in pediatric neuro-oncology.We extracted 108 radiomics features including shape-based, histogram, and texture features from DWI and ADC, respectively. Then we applied Z-score on the training data set to remove the scale variance among different features. Since the number of features was larger than the number of cases, we applied principle component analysis (PCA) to reduce the dimension of the feature space and recursive feature elimination (RFE) to select the critical features. Supported vector machine (SVM) with linear kernel was used for grade distinguishing. Five-fold cross validation was used on training data set to select the best feature number and all training data set was used for the model development. Then we evaluated the model on the independent test cohort. We used the ROC curve and the confusion matrix to evaluate the model performance. The ADC-only model, DWI-only model, and the combined model were compared. Delong Test was used to compare the model performance. All above process were implemented by FeAture Explorer (FAE, V 0.3.6) and the Python 3.8(Figure2) [9].
Results
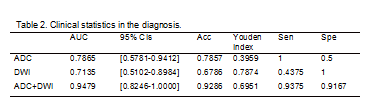
Five and four features were selected from ADC and DWI model, respectively. And the model of ADC/DWI achieved an AUC of 0.7865 (95% CI: 0.5781-0.9412)/ 0.7135 (95%CI:0.5102-0.8984) on the test data set. The sensitivity/specificity/positive predictive value (PPV)/negative predictive value (NPV) achieved to 1.0000/0.5000/0.7273/1.0000 for AUC model and 0.4375/1.0000/1.0000/0.5714 for DWI model. For the combined model, the AUC was improved to 0.9479 (95%CI:0.8246-1.0000), and the sensitivity/specificity/PPV/NPV achieved to 0.9375/0.9167/ 0.9375/0.9167(Table2,Figure3).Conclusion
Only using DWI or ADC could distinguish the low/high grade of the pediatric brain tumors. Further the combined information could improve the model performance, which might help the radiologist diagnose the pediatric brain tumor grade in clinics.Acknowledgements
We sincerely thank the participants in this study.References
Reference
[1]Koral K, Mathis D, Gimi B, et al. . Common pediatric cerebellar tumors: correlation between cell densities and apparent diffusion coefficient metrics. Radiology 2013;268(2):532-537.
[2]Jaremko JL, Jans LBO, Coleman LT, Ditchfield MR. Value and limitations of diffusion-weighted imaging in grading and diagnosis of pediatric posterior fossa tumors. AJNR Am J Neuroradiol 2010;31(9):1613-1616.
[3]Gimi B, Cederberg K, Derinkuyu B, et al. . Utility of apparent diffusion coefficient ratios in distinguishing common pediatric cerebellar tumors. Acad Radiol 2012;19(7):794-800.
[4]Porto L, Jurcoane A, Schwabe D, Kieslich M, Hattingen E. Differentiation between high and low grade tumours in paediatric patients by using apparent diffusion coefficients. Eur J Paediatr Neurol 2013;17(3):302-307.
[5]Rumboldt Z, Camacho DL, Lake D, Welsh CT, Castillo M. Apparent diffusion coefficients for differentiation of cerebellar tumors in children. AJNR Am J Neuroradiol 2006;27(6):1362-1369.
[6]Russell MD, Young AM, Karri SK. Biomarkers of pediatric brain tumors. Front Pediatr 2013;1:7.
[7]Leithner D, Horvat JV, Ochoa-Albiztegui RE, et al. Imaging and the completion of the omics paradigm in breast cancer. Der Radiologe. 2018 Nov;58(Suppl 1):7-13.
[8]Louis DN, Ohgaki H, Wiestler OD, et al. . The 2007 WHO classification of tumours of the central nervous system. Acta Neuropathol (Berl) 2007;114(2):97-109.
[9]Yang Song, Jing Zhang, et al. PloS one 2020;15(8):e0237587.
Figures
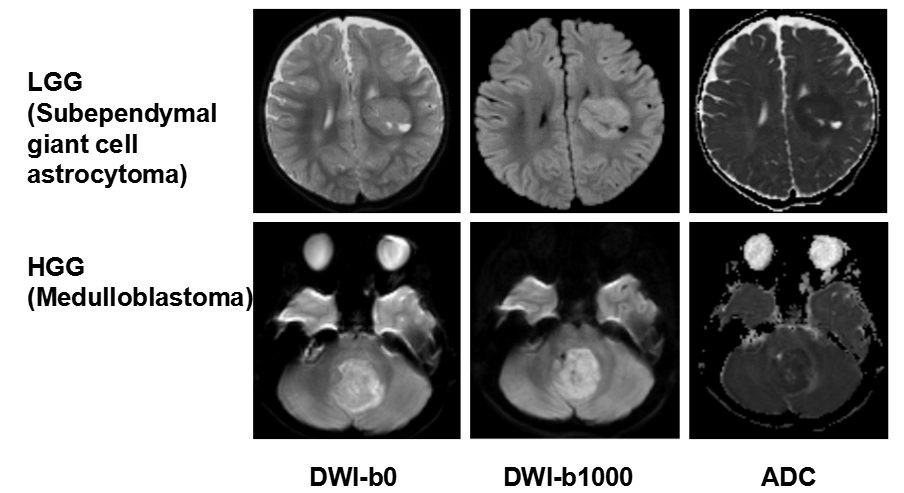
Figure1. MR imaging appearance of Low- and high-grade pediatric brain tumors on B0, DWI and ADC images.
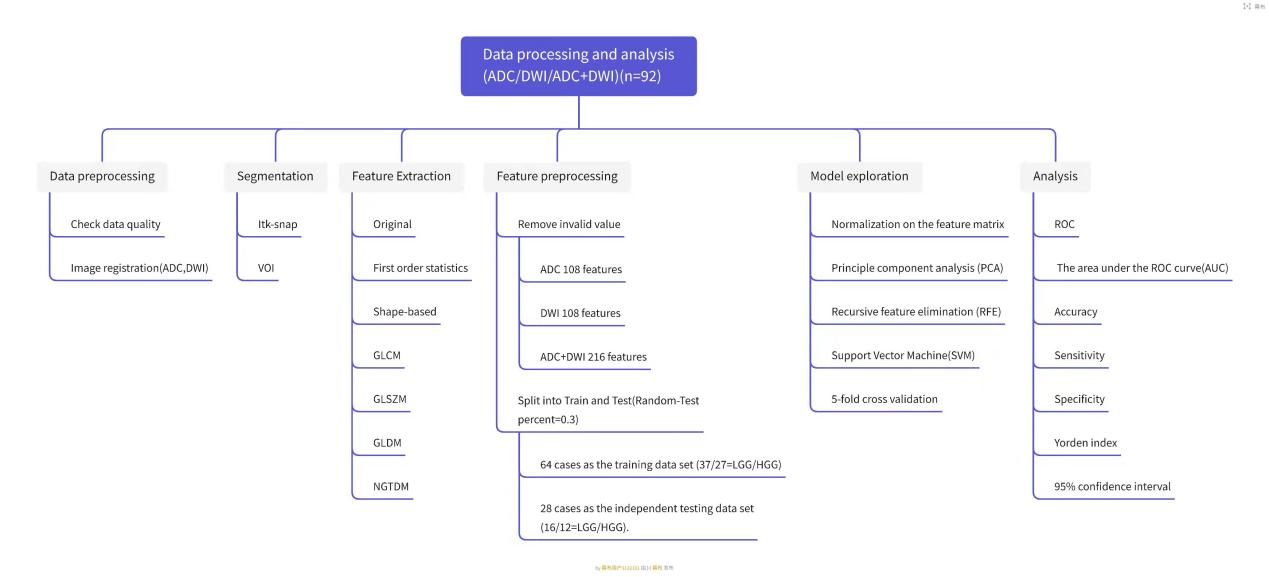
Figure2. Data processing and analysis