3776
Effects of low-moderate prenatal alcohol exposure on brain development in childhood
Claire Kelly1,2,3, Thijs Dhollander2, Evelyne Muggli1,4, Jane Halliday4,5, Elizabeth Elliott6,7, Anthony Penington4,8, Alicia Spittle1,9, Della A Forster10,11, Sharon Lewis4,5, Stephen Hearps12, Deanne K Thompson1,2,4, and Peter J Anderson1,3
1Victorian Infant Brain Studies (VIBeS), Murdoch Children's Research Institute, Melbourne, Australia, 2Developmental Imaging, Murdoch Children's Research Institute, Melbourne, Australia, 3Turner Institute for Brain and Mental Health, School of Psychological Sciences, Monash University, Melbourne, Australia, 4Department of Paediatrics, The University of Melbourne, Melbourne, Australia, 5Reproductive Epidemiology, Murdoch Children's Research Institute, Melbourne, Australia, 6Child and Adolescent Health, Faculty of Medicine and Health, The University of Sydney, Sydney, Australia, 7Sydney Children's Hospitals Network, Westmead, Sydney, Australia, 8Royal Children’s Hospital, Melbourne, Australia, 9Department of Physiotherapy, The University of Melbourne, Melbourne, Australia, 10The Royal Women's Hospital, Melbourne, Australia, 11Judith Lumley Centre, La Trobe University, Melbourne, Australia, 12Brain and Mind, Murdoch Children's Research Institute, Melbourne, Australia
1Victorian Infant Brain Studies (VIBeS), Murdoch Children's Research Institute, Melbourne, Australia, 2Developmental Imaging, Murdoch Children's Research Institute, Melbourne, Australia, 3Turner Institute for Brain and Mental Health, School of Psychological Sciences, Monash University, Melbourne, Australia, 4Department of Paediatrics, The University of Melbourne, Melbourne, Australia, 5Reproductive Epidemiology, Murdoch Children's Research Institute, Melbourne, Australia, 6Child and Adolescent Health, Faculty of Medicine and Health, The University of Sydney, Sydney, Australia, 7Sydney Children's Hospitals Network, Westmead, Sydney, Australia, 8Royal Children’s Hospital, Melbourne, Australia, 9Department of Physiotherapy, The University of Melbourne, Melbourne, Australia, 10The Royal Women's Hospital, Melbourne, Australia, 11Judith Lumley Centre, La Trobe University, Melbourne, Australia, 12Brain and Mind, Murdoch Children's Research Institute, Melbourne, Australia
Synopsis
Effects of low-moderate prenatal alcohol exposure (PAE) on brain development have been infrequently studied. In a general antenatal population cohort, we compared brain structure between 6-8-year-old children with no PAE (n=41), PAE during trimester 1 (n=44), and PAE throughout gestation (n=58). Most brain regions did not differ between groups, however the caudal anterior cingulate cortex area, and striato-cortical tract cross-sectional area, were significantly smaller in the group exposed to alcohol throughout gestation relative to the other groups. Overall, low-moderate PAE is not strongly associated with brain structure, except low-moderate PAE throughout gestation is associated with specific brain regional alterations.
Introduction
Prenatal alcohol exposure (PAE) is a public health concern given alcohol is neurotoxic to the developing fetus, and many women drink alcohol around the time of conception or during pregnancy[1]. Prior studies have commonly reported that heavy and chronic levels of PAE are associated with brain abnormalities in childhood[2-5]. These abnormalities include reduced volumes, particularly of the corpus callosum, frontal, temporal and parietal lobes, caudate nucleus, hippocampus and cerebellum; and altered white matter (WM) microstructure particularly in the corpus callosum and cerebellar tracts[2-5]. Few studies have investigated if lower levels of alcohol intake during pregnancy are related to offspring’s brain development. We investigated effects of low to moderate PAE on brain development of children aged 6-8 years.Methods
This prospective longitudinal cohort study recruited 1570 pregnant women from the general population between July 2011 and July 2012. Women completed questionnaires detailing quantity and frequency of alcohol consumption three months before pregnancy and in each trimester of pregnancy. When the children were aged 6-8 years, a random subset underwent an MRI scan (n=143), stratified to ensure similar numbers of children with no PAE (n=41), with PAE during trimester 1 only (PAE T1; n=44), and with PAE across all trimesters (PAE T1-T3; n=58).Acquisitions using a 3T scanner included T1w images (0.9mm isotropic voxels), and diffusion MRI data (b=2800s/mm2, 60 gradient directions, 10 b=0 images; 2mm isotropic voxels).
T1w images were processed using FreeSurfer[6], obtaining total and subcortical brain volumes[7], and area, thickness and volume of 34 cortical regions per hemisphere defined using the Desikan-Killiany atlas[8]. All total and regional brain volume, area and thickness metrics were compared between PAE groups using linear models adjusted for age and sex, and secondarily for intracranial volume (ICV).
For diffusion MRI data, typical fixel-based analysis pipeline steps were performed[9], including Gibbs-ringing correction[10], motion and susceptibility-induced distortion correction[11-14], estimation and averaging of 3-tissue response functions[15], upsampling to 1.5mm isotropic voxels, 3-tissue constrained spherical deconvolution[16], intensity normalisation (global and bias fields)[17], and construction of and registration to a study-specific WM fibre orientation distribution (FOD) template[18]. Fixel-wise fibre density (FD), fibre cross-section (FC, in log form) and fibre density and cross-section (FDC) metrics were computed[19] and compared between PAE groups adjusted for age and sex, and secondarily for ICV[20].
Results
Total brain volumes: ICV was slightly larger in both the PAE T1-T3 group and PAE T1 group compared with the no PAE group, but these differences had small-medium effect sizes only (Cohen’s d=0.5 and 0.3 respectively) and were not statistically significant (pFDR≥0.05). Total brain tissue volume, total cortical grey matter volume and total cerebral WM volume did not differ significantly between PAE groups before or after adjusting for ICV (all pFDR≥0.05) (Figure 1).Regional brain volumes: Before adjusting for ICV, volume of brain regions did not differ significantly between PAE groups, except that the volume of the left and right caudate nucleus and left amygdala were significantly larger in the PAE T1 group compared with the no PAE group (pFDR<0.05). After adjusting for ICV, there were no significant differences in volumes of these subcortical grey matter regions, cerebellum or brainstem between PAE groups (all pFDR≥0.05) (Figure 2).
Cortical morphology: There were generally no significant differences in cortical volume, area or thickness between PAE groups, before and after adjusting for ICV. The exception was the area of the right caudal anterior cingulate cortex which, after adjusting for ICV, was significantly lower in the PAE T1-T3 group compared with the no PAE group (pFDR=0.02) (Figure 3).
WM microstructure and macrostructure: There were no significant differences in FD between PAE groups (all pFWE≥0.05). The PAE T1 group exhibited significantly (pFWE<0.05) higher FC than the no PAE group in small clusters of fixels located in the cerebellar WM before adjusting for ICV; after adjusting for ICV these differences were not significant. After adjusting for ICV, the PAE T1-T3 group exhibited significantly lower FC in a small region located in right striato-cortical fibre pathways compared with the PAE T1 group (Figure 4 and 5).
Discussion
Overall, we found few differences between the PAE groups, except for in the size of specific brain regions and tracts. Several of these macrostructural group differences were attenuated after accounting for the small, non-significant differences in overall brain size between the PAE groups. However, the surface area of the caudal anterior cingulate cortex and the cross-sectional area of striato-cortical fibre pathways were significantly smaller in the group exposed to alcohol throughout gestation (PAE T1-T3) relative to the other groups, after having accounted for ICV. Prior research on the association between low-moderate PAE and childhood brain development and neurodevelopment is scarce; some studies found adverse effects of low-moderate PAE on cognitive development, some studies found no effects, and other studies found small positive effects[21,22]. Future work will correlate the brain MRI measures in the current study with concurrent neurodevelopmental outcomes.Conclusion
The results suggest that low-moderate PAE is overall not strongly associated with brain structural alterations, however low-moderate PAE throughout gestation is associated with alterations in small, specific brain regions and tracts, in our general population cohort of 6-8-year-old children.Acknowledgements
We thank members of the VIBeS and Developmental Imaging teams at the Murdoch Children’s Research Institute and the Royal Children’s Hospital Medical Imaging staff. This research was supported by the National Health and Medical Research Council of Australia (NHMRC; Project Grant 1446635; Centre of Research Excellence in Newborn Medicine 1153176; Career Development Fellowship APP1160003 to DT and APP1159533 to AS; Investigator Grant APP1176077 to PA; Practitioner Fellowship GNT1021480 to EE), a Medical Research Futures Fund Next Generation Fellowship (MRF1135959) to EE, an Australian Government Research Training Program (RTP) scholarship and Monash University Graduate Excellence Scholarship to CK, the Murdoch Children’s Research Institute, the Royal Children’s Hospital Foundation, the Department of Paediatrics at The University of Melbourne, and the Victorian Government's Operational Infrastructure Support Program.References
[1] Muggli E, O’Leary C, Donath S, et al. “Did you ever drink more?” A detailed description of pregnant women’s drinking patterns. BMC Public Health. 2016;16(1):683.[2] Lebel C, Roussotte F, Sowell ER. Imaging the Impact of Prenatal Alcohol Exposure on the Structure of the Developing Human Brain. Neuropsychology Review. 2011;21(2):102-118.
[3] Donald KA, Eastman E, Howells FM, et al. Neuroimaging effects of prenatal alcohol exposure on the developing human brain: a magnetic resonance imaging review. Acta Neuropsychiatrica. 2015;27(5):251-269.
[4] Ghazi Sherbaf F, Aarabi MH, Hosein Yazdi M, et al. White matter microstructure in fetal alcohol spectrum disorders: A systematic review of diffusion tensor imaging studies. Hum Brain Mapp. 2019;40(3):1017-1036.
[5] Wozniak JR, Muetzel RL. What Does Diffusion Tensor Imaging Reveal About the Brain and Cognition in Fetal Alcohol Spectrum Disorders? Neuropsychology Review. 2011;21(2):133-147.
[6] Fischl B. FreeSurfer. Neuroimage. 2012;62(2):774-781.
[7] Fischl B, Salat DH, Busa E, et al. Whole Brain Segmentation: Automated Labeling of Neuroanatomical Structures in the Human Brain. Neuron. 2002;33(3):341-355.
[8] Desikan RS, Ségonne F, Fischl B, et al. An automated labeling system for subdividing the human cerebral cortex on MRI scans into gyral based regions of interest. Neuroimage. 2006;31(3):968-980.
[9] Dhollander T, Clemente A, Singh M, et al. Fixel-based Analysis of Diffusion MRI: Methods, Applications, Challenges and Opportunities. Neuroimage. 2021;241:118417.
[10] Kellner E, Dhital B, Kiselev VG, et al. Gibbs-ringing artifact removal based on local subvoxel-shifts. Magnetic Resonance in Medicine. 2016;76(5):1574-1581.
[11] Andersson JLR, Sotiropoulos SN. An integrated approach to correction for off-resonance effects and subject movement in diffusion MR imaging. Neuroimage. 2016;125:1063-1078.
[12] Andersson JLR, Graham MS, Zsoldos E, et al. Incorporating outlier detection and replacement into a non-parametric framework for movement and distortion correction of diffusion MR images. Neuroimage. 2016;141:556-572.
[13] Andersson JLR, Graham MS, Drobnjak I, et al. Towards a comprehensive framework for movement and distortion correction of diffusion MR images: Within volume movement. Neuroimage. 2017;152:450-466.
[14] Andersson JLR, Graham MS, Drobnjak I, et al. Susceptibility-induced distortion that varies due to motion: Correction in diffusion MR without acquiring additional data. Neuroimage. 2018;171:277-295.
[15] Dhollander T, Mito R, Raffelt D, et al. Improved white matter response function estimation for 3-tissue constrained spherical deconvolution. ISMRM. 2019, 555.
[16] Dhollander T, Connelly A. A novel iterative approach to reap the benefits of multi-tissue CSD from just single-shell (+b=0) diffusion MRI data. ISMRM. 2016, 24, 3010.
[17] Dhollander T, Tabbara R, Rosnarho-Tornstrand J, et al. Multi-tissue log-domain intensity and inhomogeneity normalisation for quantitative apparent fibre density. ISMRM. 2021, 29, 2472.
[18] Raffelt D, Tournier JD, Fripp J, et al. Symmetric diffeomorphic registration of fibre orientation distributions. Neuroimage. 2011;56(3):1171-1180.
[19] Raffelt DA, Tournier JD, Smith RE, et al. Investigating white matter fibre density and morphology using fixel-based analysis. Neuroimage. 2017;144:58-73.
[20] Raffelt DA, Smith RE, Ridgway GR, et al. Connectivity-based fixel enhancement: Whole-brain statistical analysis of diffusion MRI measures in the presence of crossing fibres. Neuroimage. 2015;117:40-55.
[21] Flak AL, Su S, Bertrand J, et al. The Association of Mild, Moderate, and Binge Prenatal Alcohol Exposure and Child Neuropsychological Outcomes: A Meta-Analysis. Alcoholism: Clinical and Experimental Research. 2014;38(1):214-226.
[22] Halliday JL, Muggli E, Lewis S, et al. Alcohol consumption in a general antenatal population and child neurodevelopment at 2 years. Journal of Epidemiology and Community Health. 2017;71(10):990.
Figures
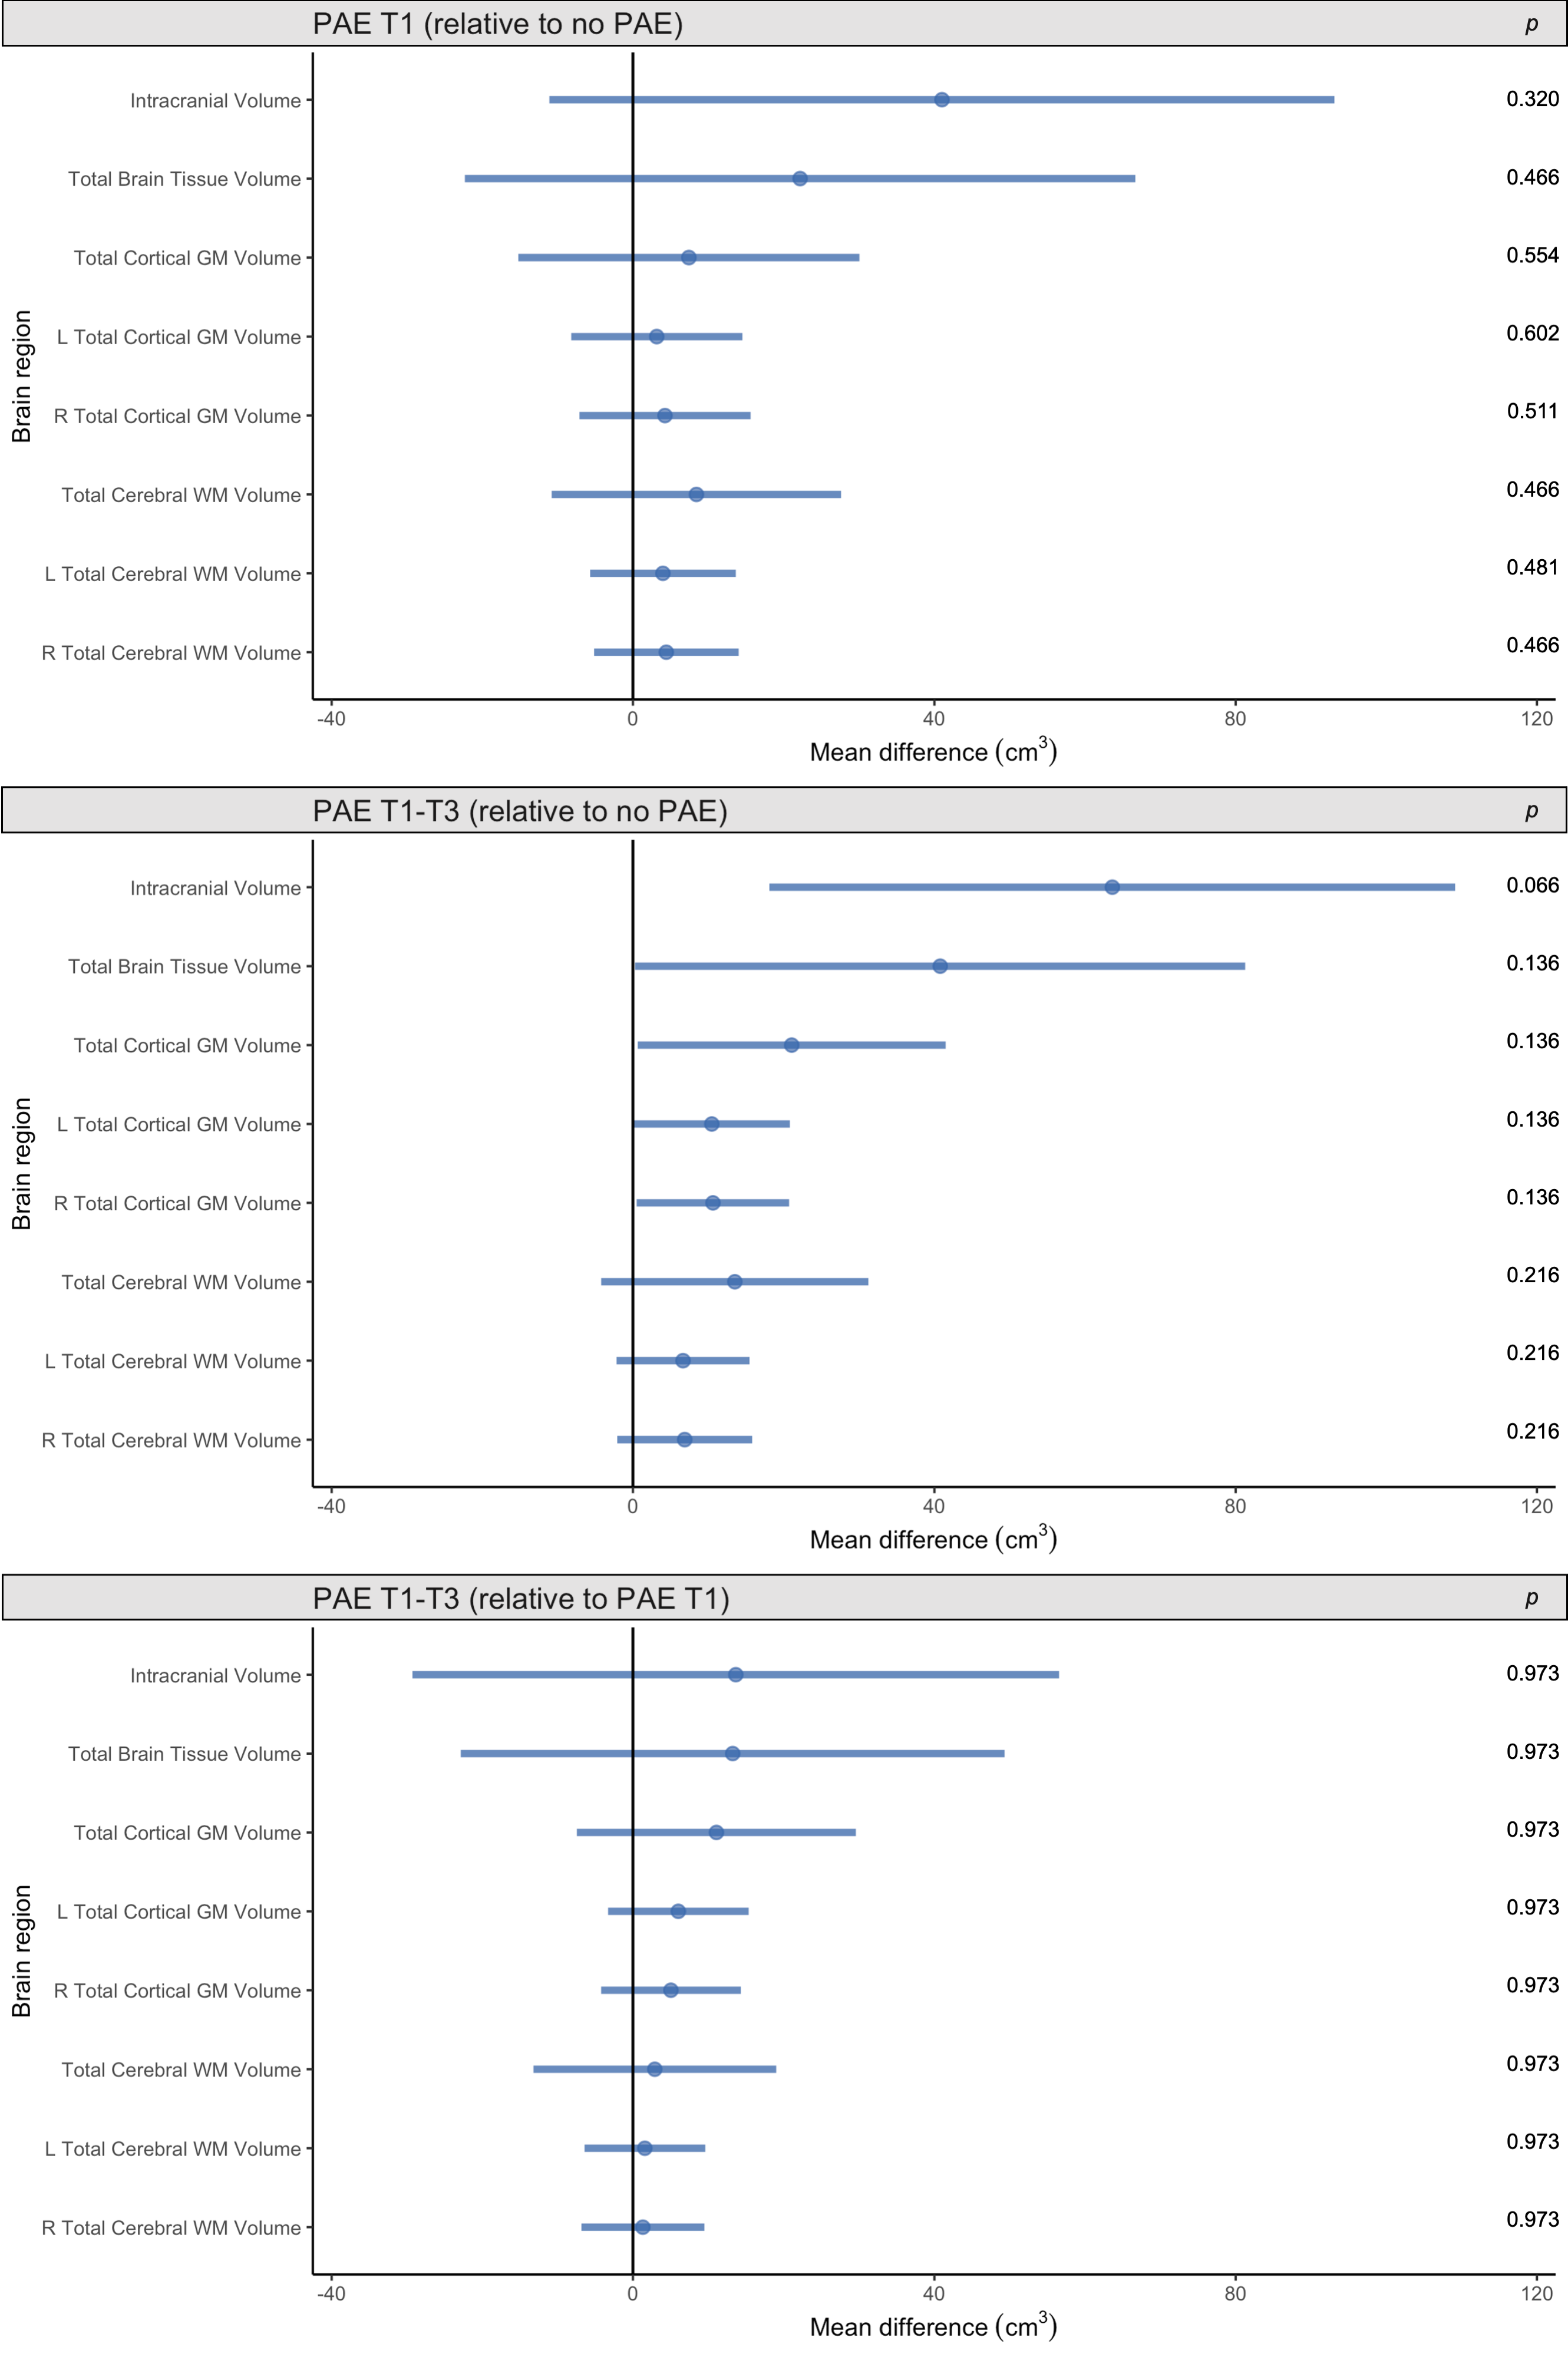
Figure 1. Points indicate mean total brain volume differences for each PAE group relative to each comparison group, adjusted for age and sex. Error bars are 95% CIs. P-values are FDR-corrected. Top row: PAE T1 group vs. no PAE group; middle row: PAE T1-T3 group vs. no PAE group; bottom row: PAE T1-T3 group vs. PAE T1 group (points left of zero line denote lower volumes in first group than comparison group; points right of zero line denote higher volumes in first group than comparison group).
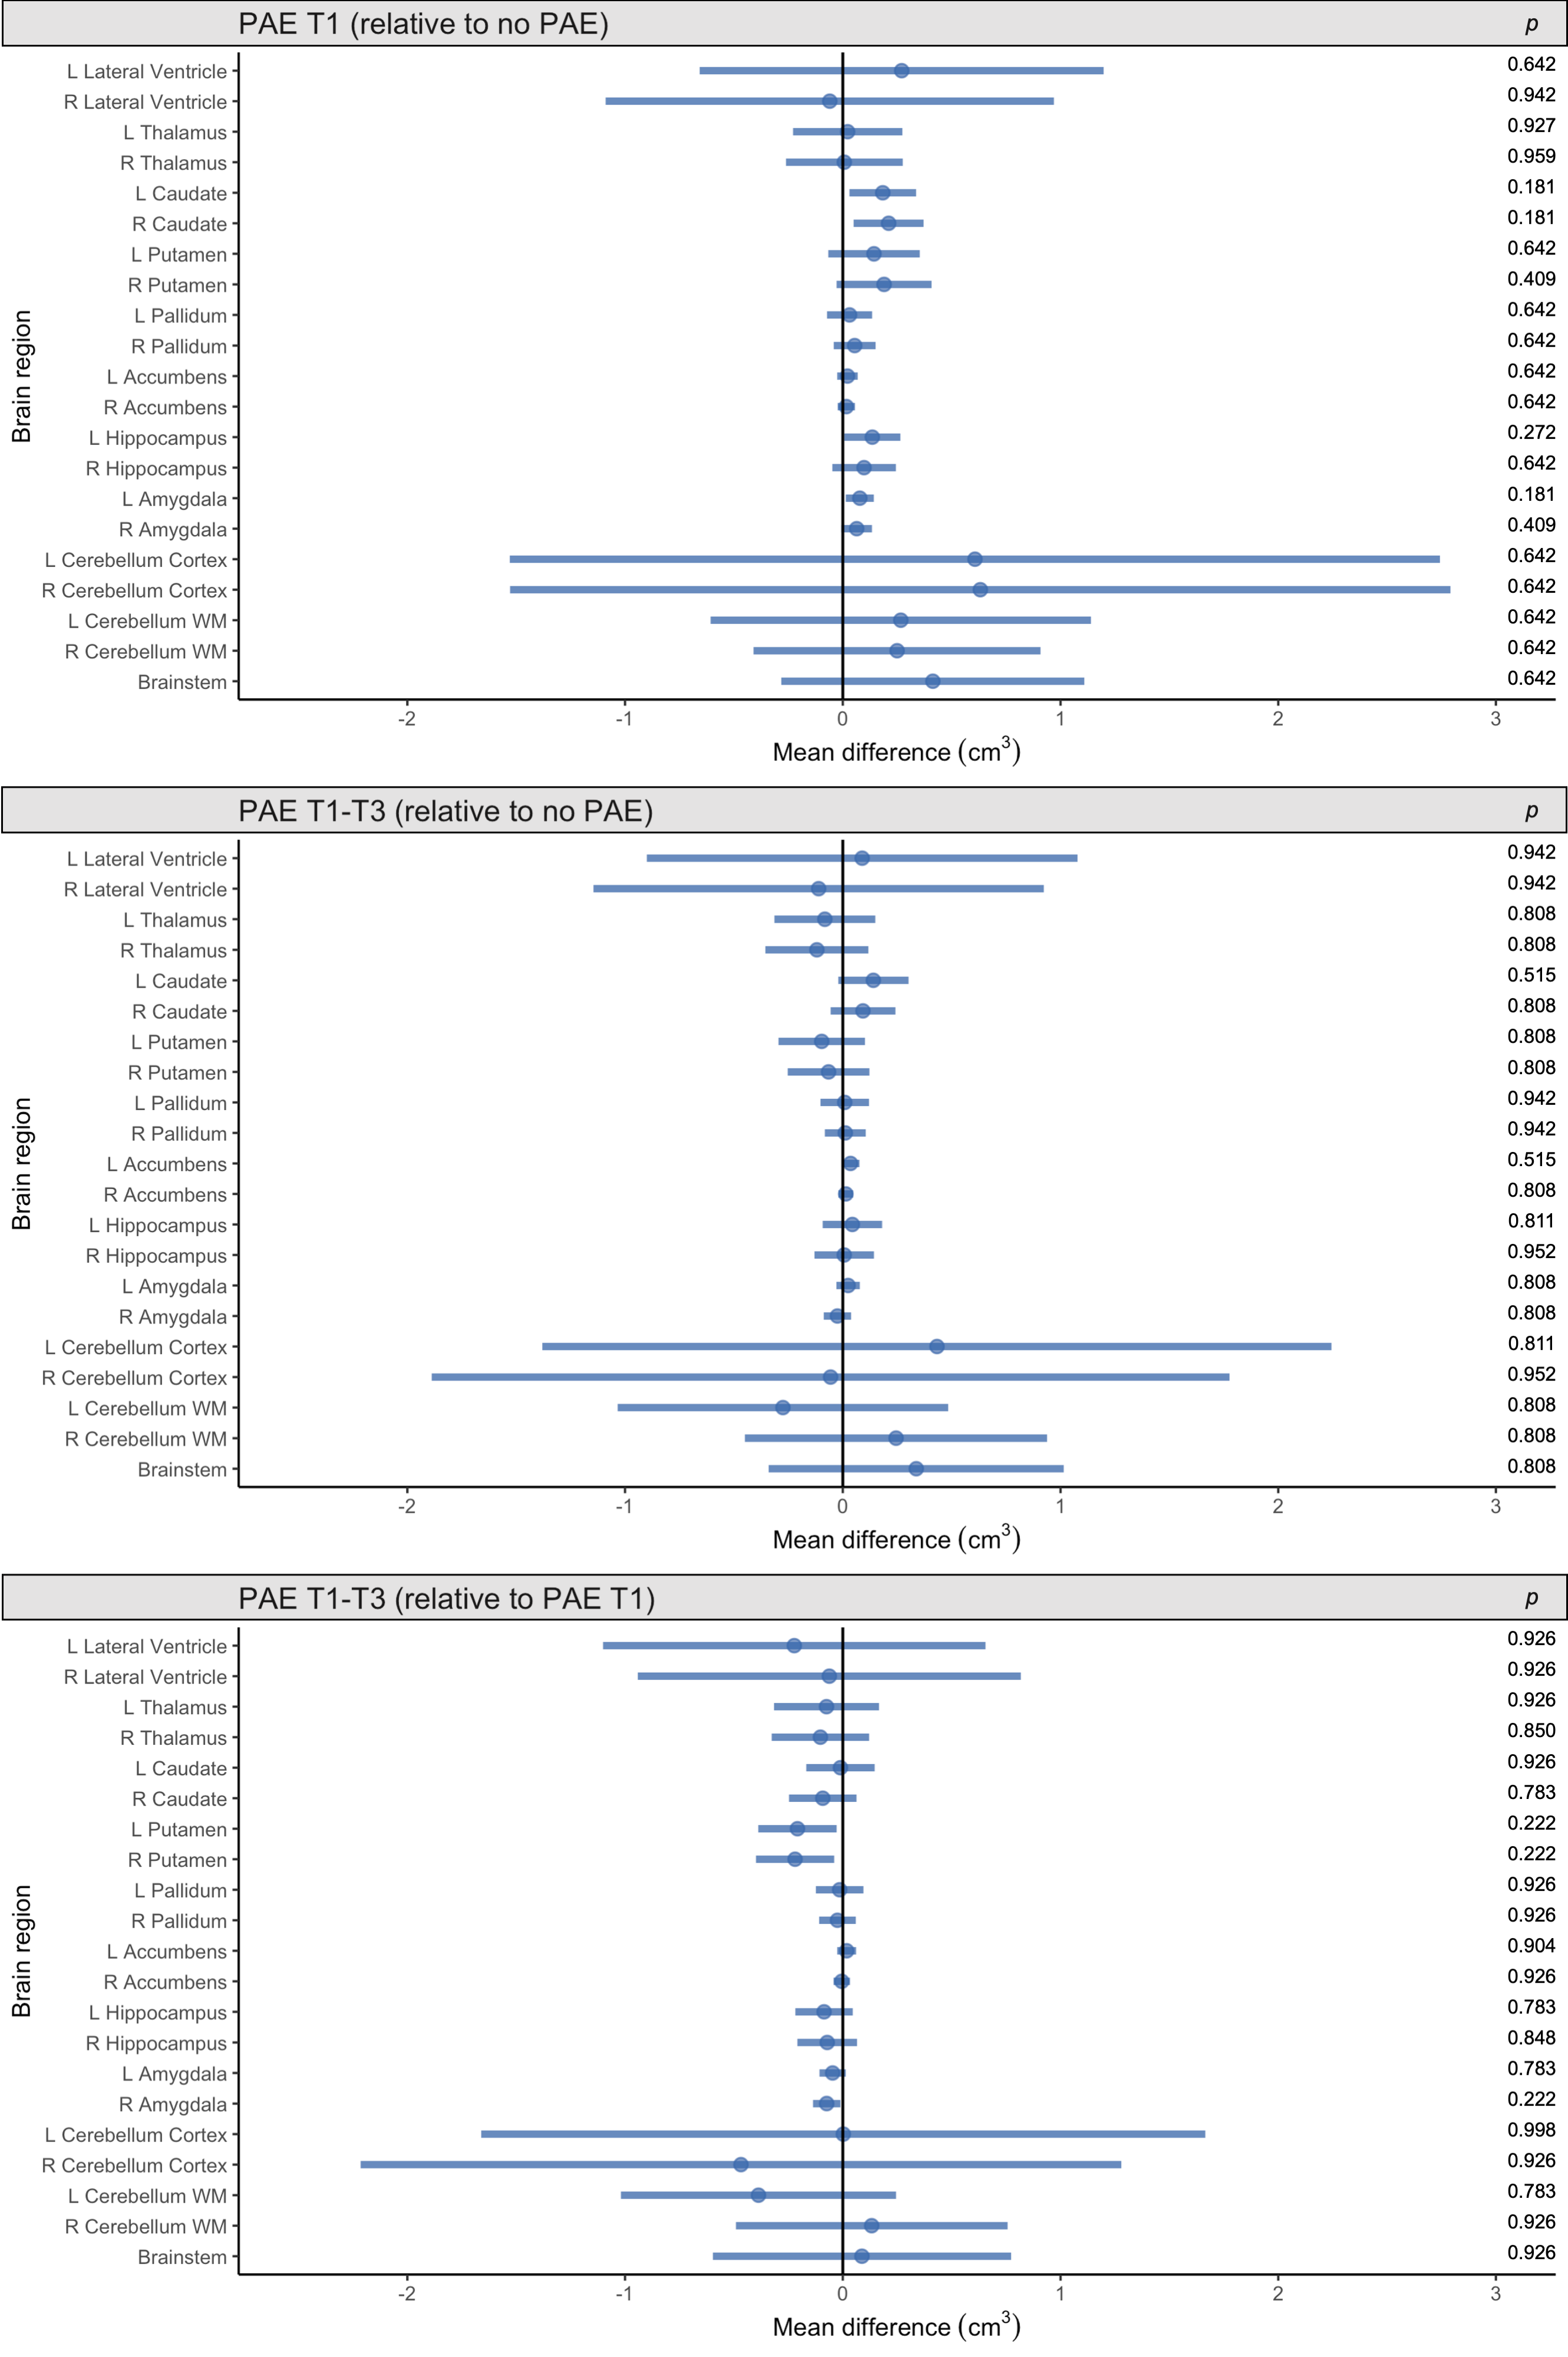
Figure 2. Points indicate mean subcortical volume differences for each PAE group relative to each comparison group, adjusted for age, sex and ICV. Error bars are 95% CIs. P-values are FDR-corrected. Top row: PAE T1 group vs. no PAE group; middle row: PAE T1-T3 group vs. no PAE group; bottom row: PAE T1-T3 group vs. PAE T1 group (points left of zero line denote lower volumes in first group than comparison group; points right of zero line denote higher volumes in first group than comparison group).
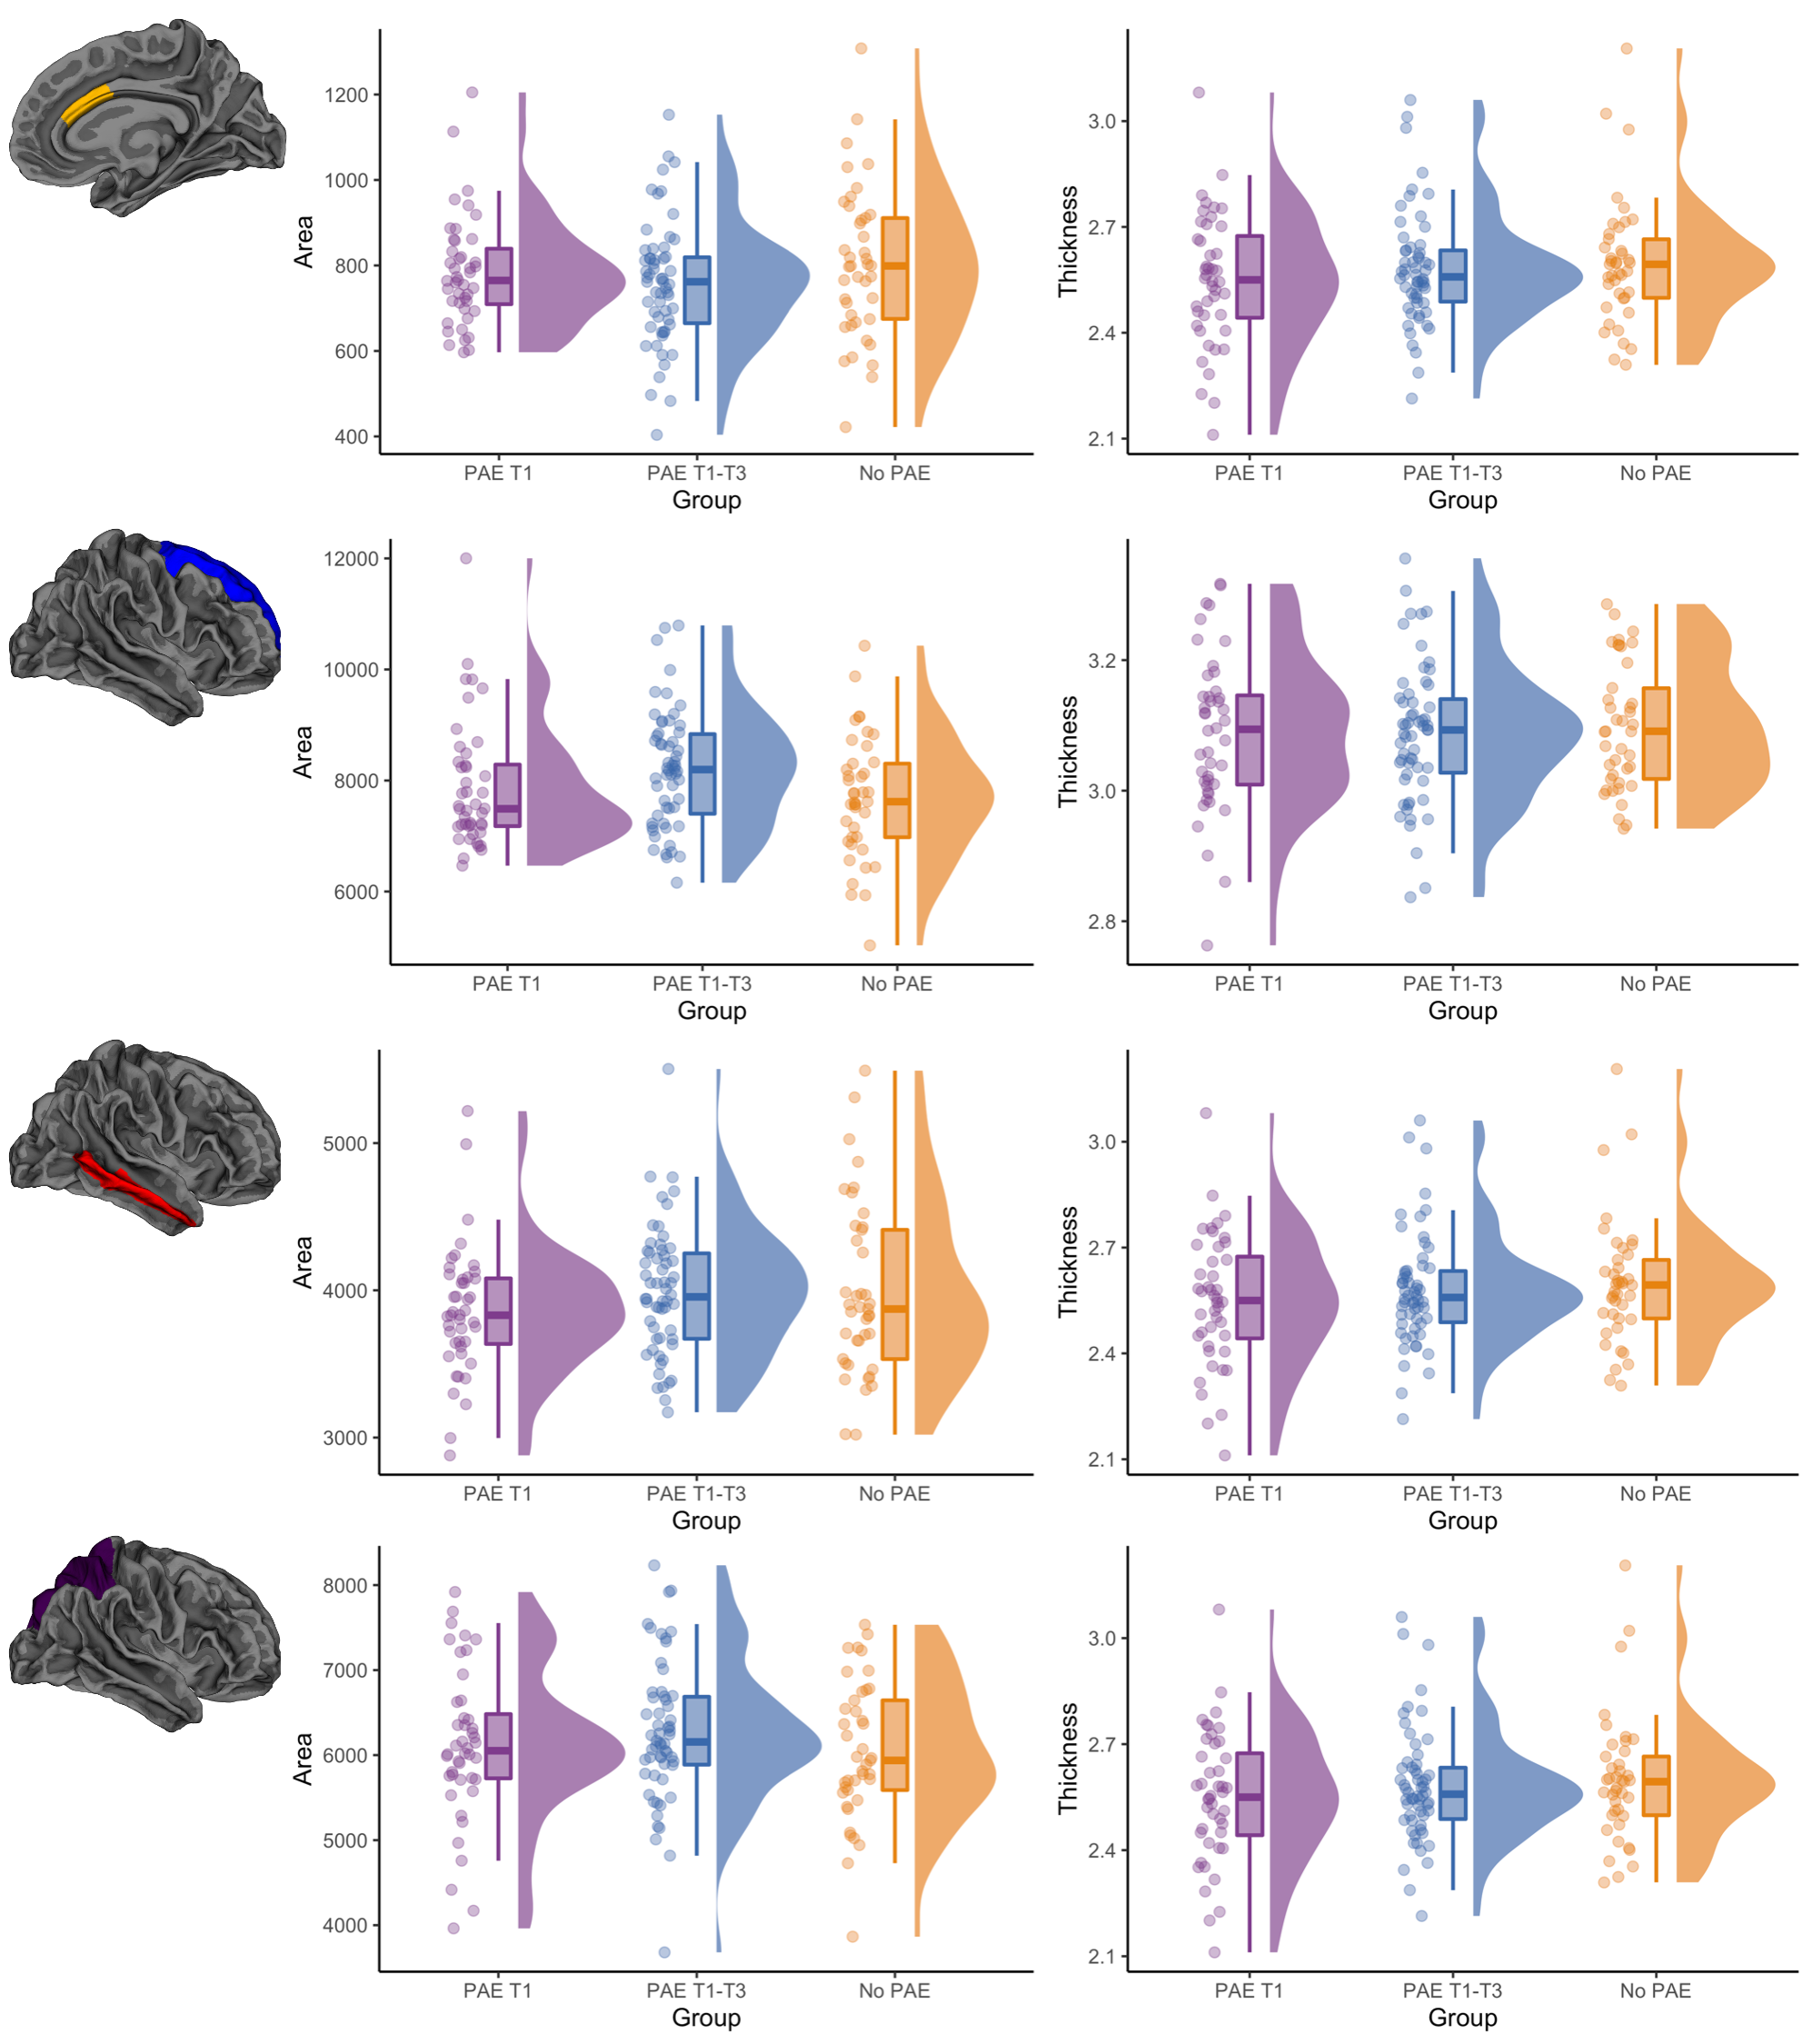
Figure 3. Raw cortical area (mm2) and thickness (mm) data points for each participant, box plots and data distributions for each PAE group. Top row: area and thickness of the right caudal anterior cingulate region, which had significantly lower area in the PAE T1-T3 group than the no PAE group after adjusting for ICV. Bottom three rows: area and thickness of example frontal, temporal and parietal regions, which showed no significant differences between groups.
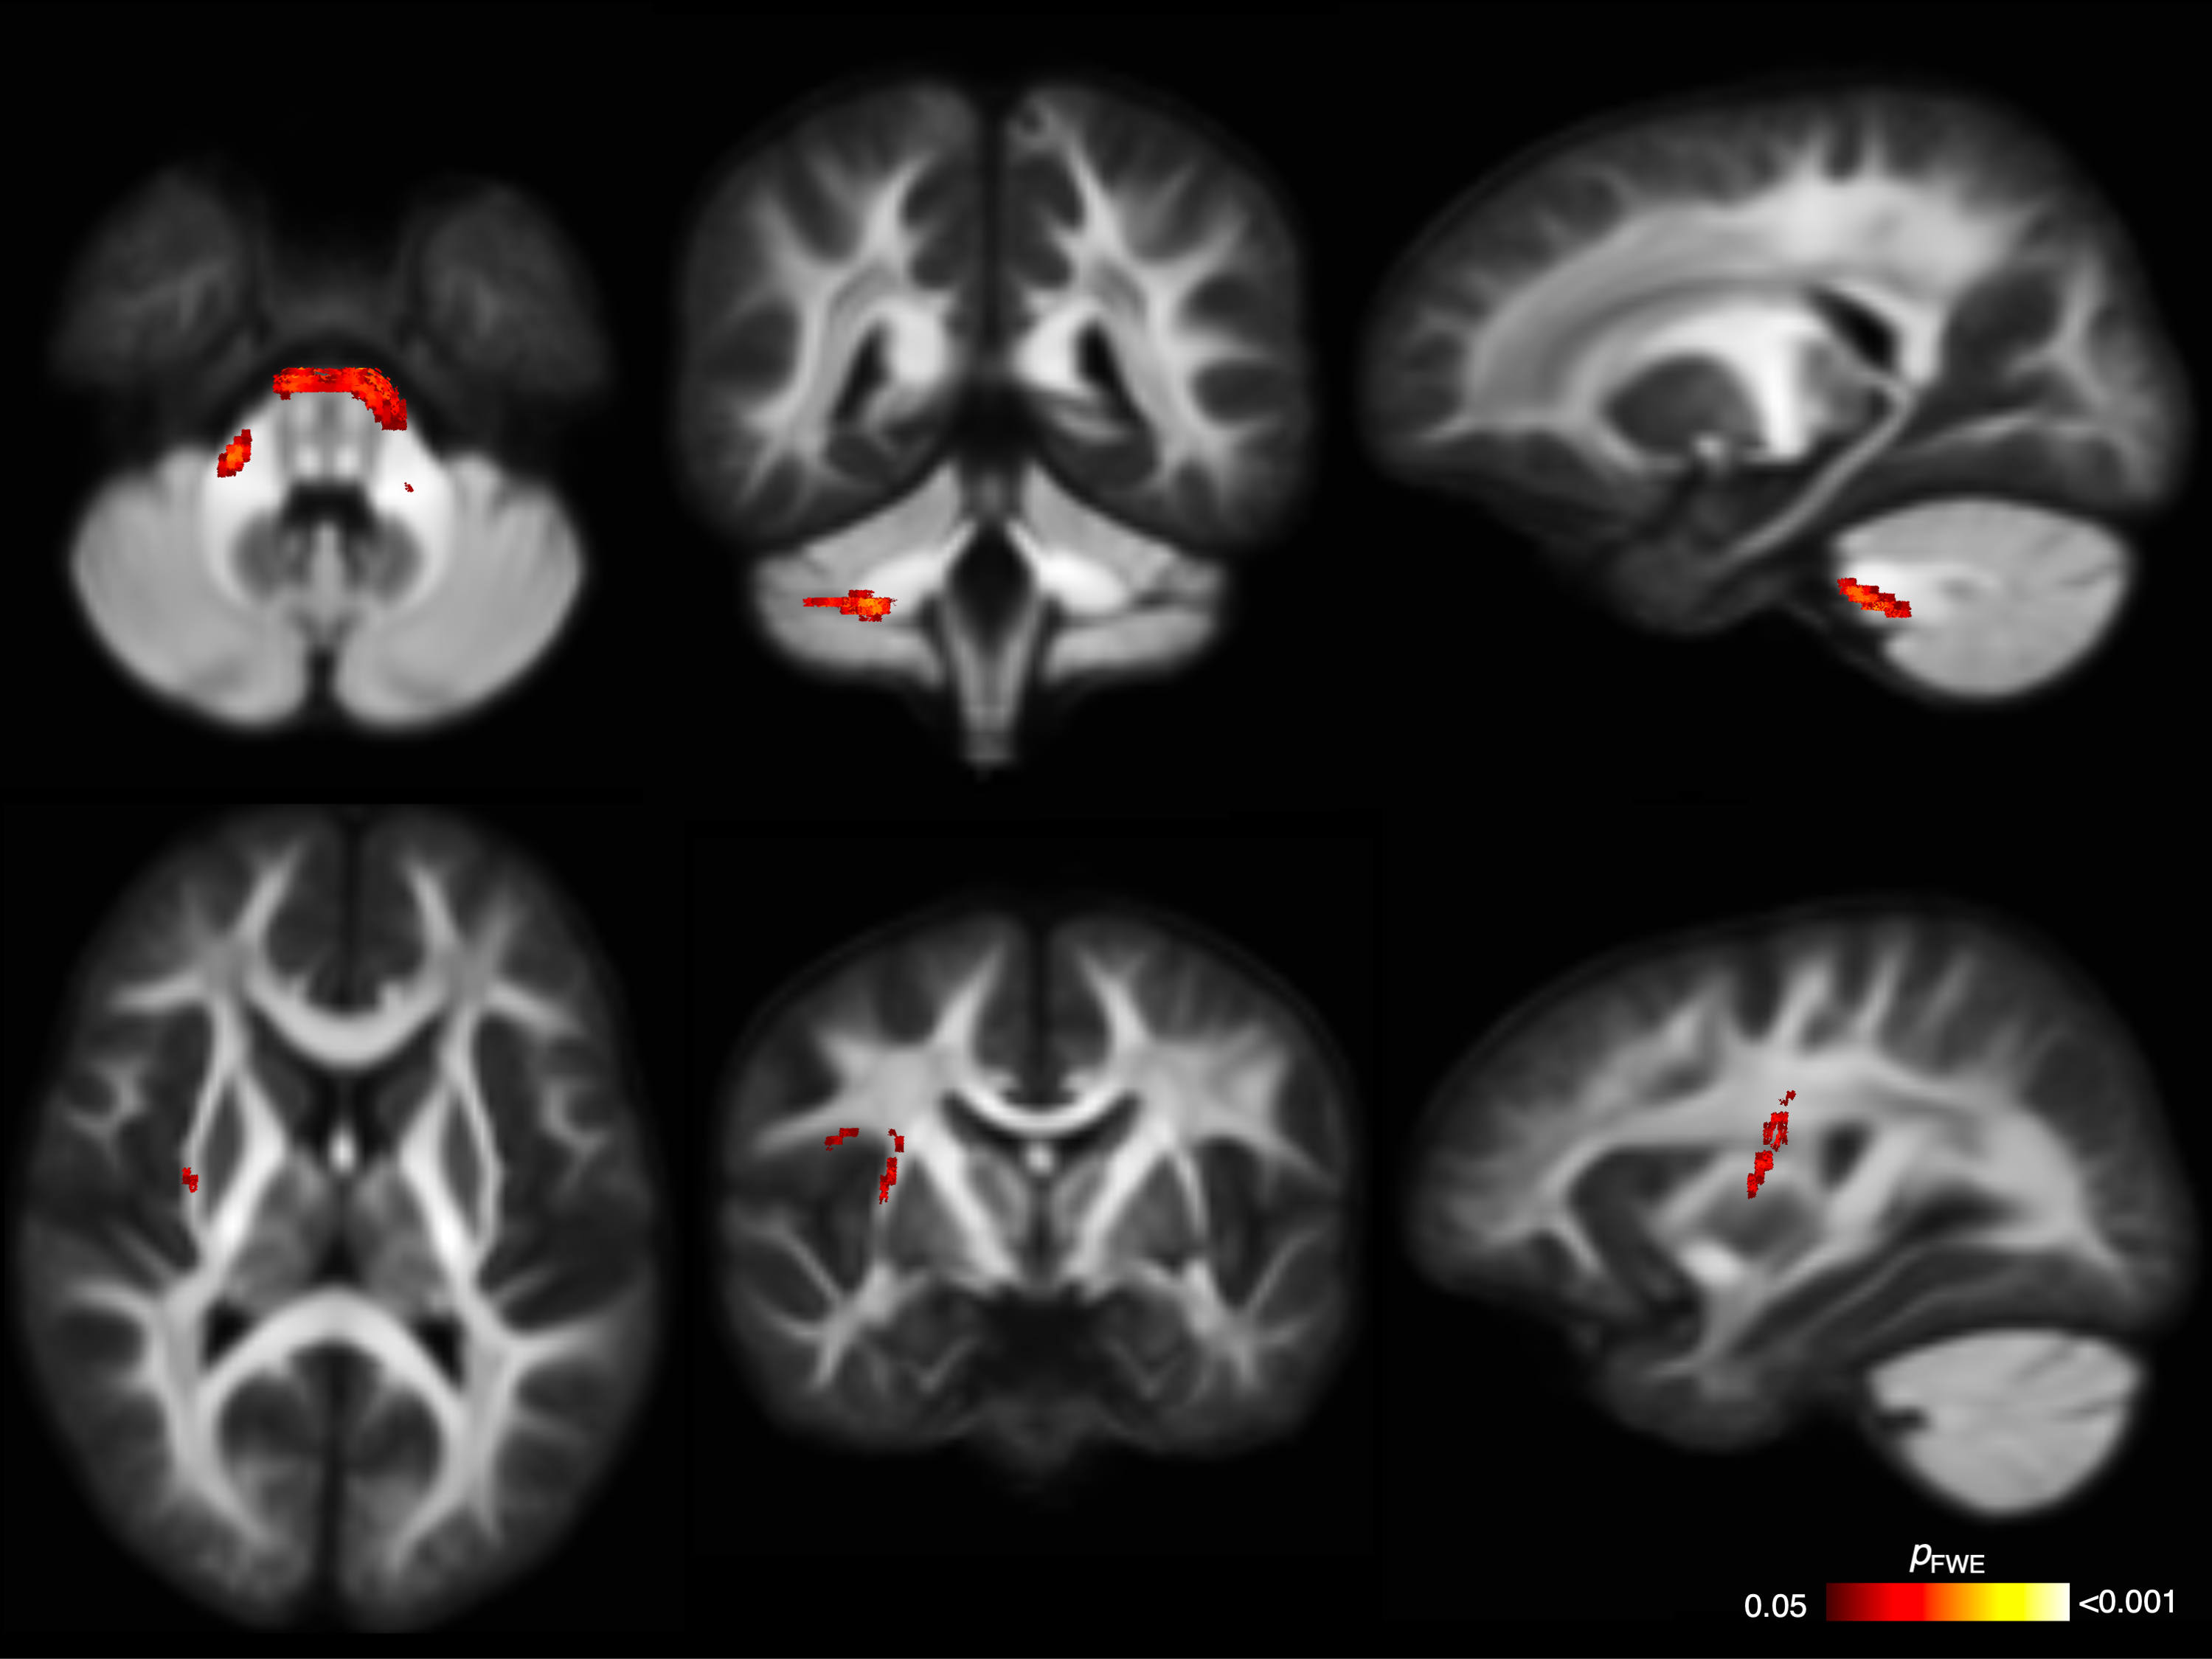
Figure 4. Fixel-based analysis results. Top row: Cerebellar WM fibres passing through fixels with significantly higher FC in the PAE T1 group than the no PAE group before adjusting for ICV; these differences were not significant after adjusting for ICV. Bottom row: Right striato-cortical fibre pathways passing through fixels with significantly lower FC in the PAE T1-T3 group than the PAE T1 group only after adjusting for ICV. Mean FD and FC values from these tracts are plotted in Figure 5.
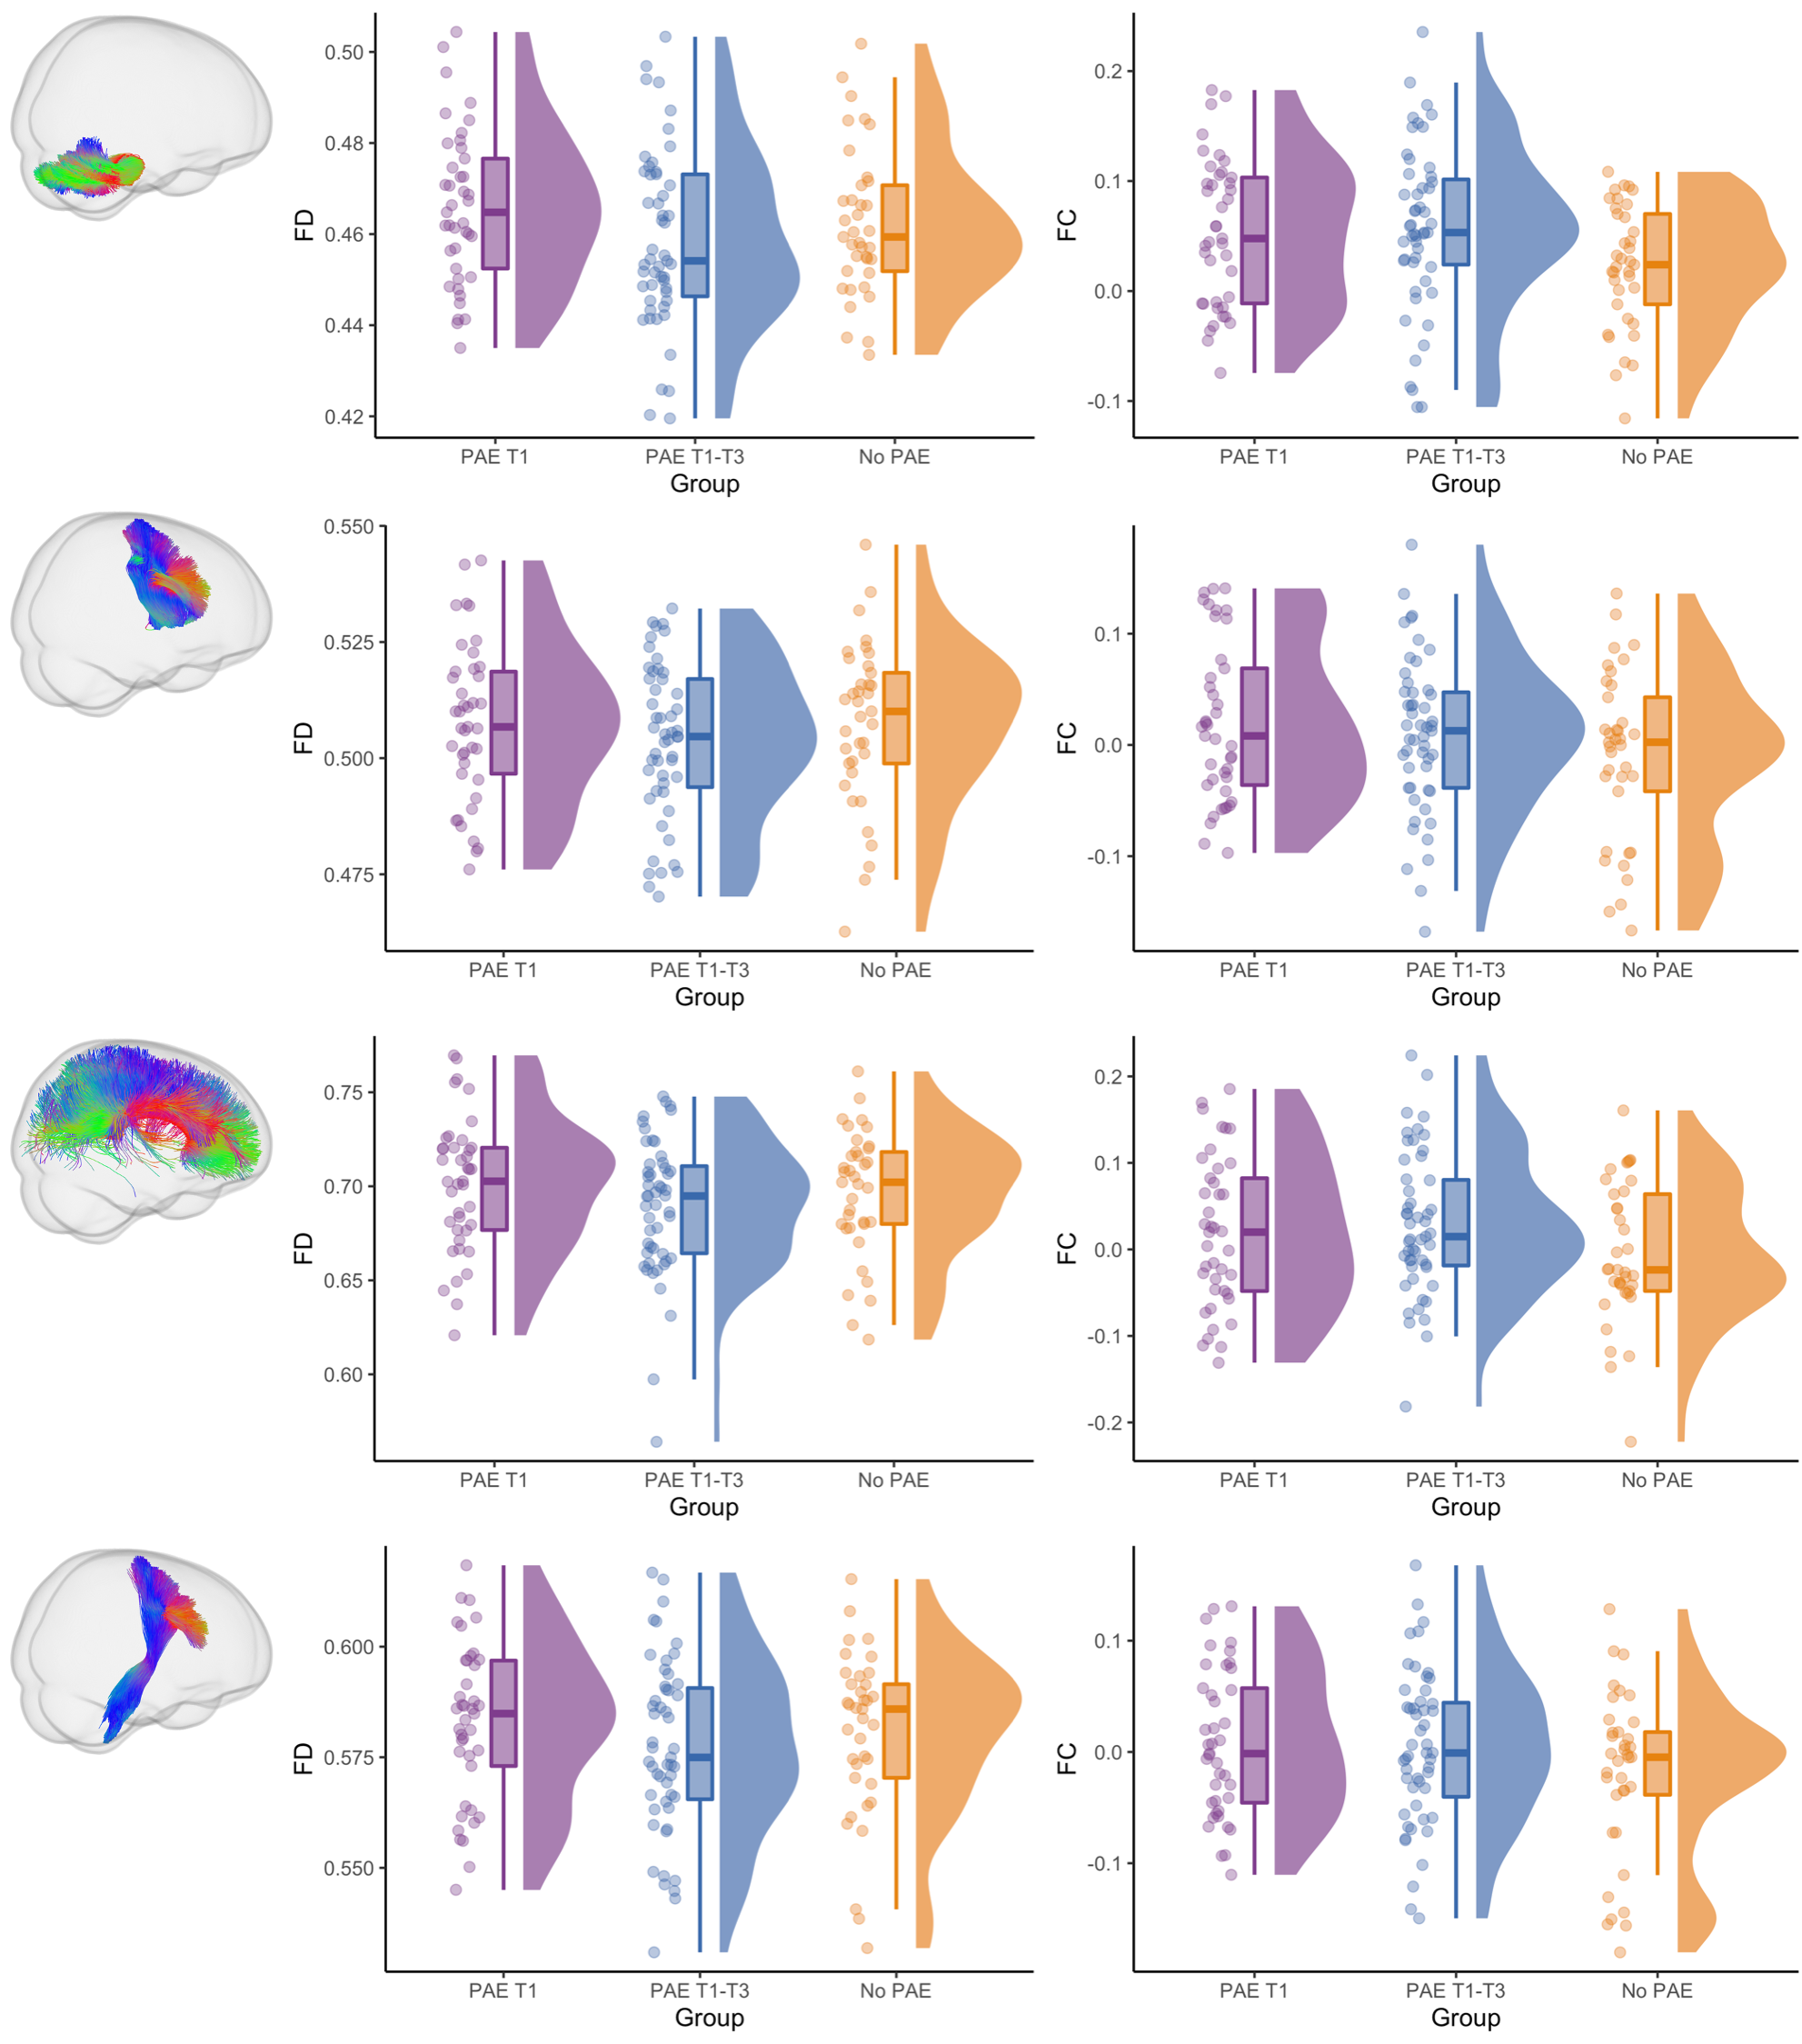
Figure 5. Raw fibre density (FD) and cross-section (FC, in log form) for each participant, box plots and data distributions for each group. Top row: FD and FC of cerebellar WM, which had significantly higher FC in the PAE T1 group than the no PAE group before but not after ICV adjustment. Second row: FD and FC of the striato-precentral tract, with evidence for lower FC in the PAE T1-T3 group than the PAE T1 group after ICV adjustment. Bottom two rows: FD and FC of example tracts with no group differences.
DOI: https://doi.org/10.58530/2022/3776