3768
A MRI-based model using Graph Convolutional Network combine Nomogram to predict Microvascular invasion diagnosis1Harbin Medical University Cancer Hospital, Harbin 150010, Harbin, China, 2Harbin Engineering University, Harbin 150001, Harbin, China, 3Philips Healthcare, Beijing, China
Synopsis
Accurate preoperative assessment of microvascular invasion (MVI) can help clinicians choose more reasonable treatment options, reduce the recurrence of HCC patients after surgical treatment, and improve the survival rate of patients. In this study, Graph convolutional network (GCN) was used to build a preoperative diagnostic model for MVI for mining the correlation between radiomic features. The results revealed that the value of the predicted MVI nomogram established was 0.884 in the validation when the radiographic characteristics of the patients were combined with graph convolutional network Score(GS).
Introduction
Hepatocellular carcinoma (HCC) is the fourth most universal cause of cancer-related death worldwide [1]. Surgical resection and liver transplantation are effective ways to treat HCC. However, the 5-year recurrence rates are as high as 70% and 25%, respectively [2]. Previous studies have shown that microvascular invasion (MVI) is a significant risk factor for recurrence of HCC after surgery and liver transplantation, but the lack of diagnostic ability evaluation for MVI is currently a major clinical challenge [3-6]. Therefore, accurate preoperative assessment of MVI is very crucial . Several recent studies have shown that multiple imaging features are associated with the occurrence of MVI and can be used as predictors of MVI [7-9]. However, the reproducibility of these studies of imaging features based on subjective judgment is controversial, and the predictive value remains to be improved[10, 11]. Graph convolutional network (GCN) is a deep learning method applied to graph classification and node classification and a system for graph data learning. GCN can perform end-to-end learning of attributes and structures, yielding interpretable results[12] Therefore, the aim of this study was to build a preoperative diagnostic model for MVI using GCN to mine the correlation between the images' radiomics features and provide clinicians with early warning information of liver cancer MVI in a non-invasive manner.Methods
We retrospectively collected 182 HCC patients confirmed histopathologically. The dynamic contrast-enhanced magnetic resonance imaging (DCE-MRI) were performed by using a 3.0 T MRI system (Ingenia CX, Philips Healthcare, the Netherland) with a 32 channel abdomen coil before surgery. The patients were randomly divided into training and validation groups. Radiomics features were extracted from the arterial phase (AP), portal venous phase (PVP), and delayed phase (DP), respectively. After removing redundant features, the graph structure by constructing the distance matrix with the feature matrix was built, the superior phases were screened out and GCN Score (GS) was acquired. Clinical baseline data such as age, gender, Child-pugh classification of liver function, hypertension, number of lesions, serum alpha-fetoprotein level (AFP), alanine aminotransferase level (ALT), aspartate aminotransferase level (AST), total serum bilirubin (TB), and Barcelona Clinic Liver Cancer (BCLC) were systematically collected. the imaging characteristics of each selected observed lesion included: nonrim arterial phase hyperenhancement, nonperipheral washout, enhancing capsule, mosaic architecture, fat in mass, corona enhancement, intratumoral artery, restricted diffusion and mild-to-moderate T2WI hyperintensity. The maximum long diameter at the maximum level of the lesion on the axis was measured in the portal venous phase, and if there were multiple lesions, the largest lesion was selected for evaluation. (Figure 1). All data was saved in the DICOM format and the workflow of this study was shown in Figure 2. Finally, combining clinical, radiological and GS established the predicting nomogram. Univariate analysis used the chi-square test, Fisher's test or Kruskal-Wallis test to compare categorical variables, and t-test or Mann-Whitney U-test to compare continuous variables. The Cohen kappa statistic assessed interobserver agreement. A kappa greater than 0.80 was considered excellent; 0.61 to 0.80 was considered good; 0.41 to 0.60 was considered moderate, and less than or equal to 0.40 was considered poor or less. SPSS software (version 25.0, IBM) was used for all statistical analyses. The value of p < 0.05 was considered statistically significant.Results
A total of 182 patients were retrospectively included, 144 males and 38 females; the mean age was 57.86 ± 8.99 years. The patients were divided into the MVI negative group (n = 132) and MVI positive group (n = 50) according to the results of the pathological examination. Univariate analysis showed that the diameter was significantly different between the MVI positive and negative groups (P = 0.001) ; radiographic characteristics including mosaic architecture (P = 0.001), corona enhancement (P = 0.047), and intratumoral artery (P < 0.001) were significantly different between the MVI positive and negative groups (Table 1). Multivariate analysis showed that only the intratumoral artery was significantly different between the MVI positive and negative groups (P < 0.05) (Table 2). The final results showed that gray-level co-occurrence matrix (GLCM) combined with gray-level run length matrix(GLRLM) in the DP obtained the highest AUC in the training and validation groups, 0.874 and 0.854, respectively (Figure 3). A nomogram predicting MVI was constructed using the diameter, corona enhancement, mosaic architecture, intratumoral artery, and GS from DP imaging in univariate analysis (p < 0.05) with a C-index of 0.884 (95% CI: 0.829 – 0.927, specificity = 87.9%, sensitivity = 78.0%)(Figure 4)Discussion and Conclusion
In this study, we developed and validated a GCN model for preoperative prediction of MVI and constructed a nomogram for diagnosis of MVI based on clinical data, radiological characteristics, as well as GS. The results showed that the DP features performed the highest predictive efficiency in GCN model development, and the nomogram of GCN-clinical-radiological had a high diagnostic accuracy for predicting MVI (AUC = 0.884) specificity and sensitivity of 87.9%, 78.0%, respectively. The results provide evidence that GCN can be used as an interpretable deep learning method to explore the correlation between radiomics signature of images and MVI, with great potential in preoperative identification of MVI. The radiographic characteristics of the patients were combined with GS, and the nomogram established for predicting MVI has obtained excellent performance in the validation. Compared with other studies, the GCN model further improved the diagnostic ability.Acknowledgements
This study has received funding by the 2020 SKY Imaging Research Fund of the Chinese Internatinal Medical Foundatin (project No. Z-2014-07-2003-07); Harbin Medical University Cancer Hospital HaiYan Funds (No. JJZD2020-17). Harbin Medical University Cancer Hospital HaiYan Funds(No. JJQN2021-07) .References
1 Yang JD, Hainaut P, Gores GJ, Amadou A, Plymoth A, Roberts LR (2019) A global view of hepatocellular carcinoma: trends, risk, prevention and management. Nat Rev Gastroenterol Hepatol 16:589-604
2 Bruix J, Gores GJ, Mazzaferro V (2014) Hepatocellular carcinoma: clinical frontiers and perspectives. Gut 63:844-855
3 Jin YJ, Lee JW, Lee OH et al (2014) Transarterial chemoembolization versus surgery/radiofrequency ablation for recurrent hepatocellular carcinoma with or without microvascular invasion. J Gastroenterol Hepatol 29:1056-1064
4 Kluger MD, Salceda JA, Laurent A et al (2015) Liver resection for hepatocellular carcinoma in 313 Western patients: tumor biology and underlying liver rather than tumor size drive prognosis. J Hepatol 62:1131-1140
5 Lim KC, Chow PK, Allen JC et al (2011) Microvascular invasion is a better predictor of tumor recurrence and overall survival following surgical resection for hepatocellular carcinoma compared to the Milan criteria. Ann Surg 254:108-113
6 Mazzaferro V, Llovet JM, Miceli R et al (2009) Predicting survival after liver transplantation in patients with hepatocellular carcinoma beyond the Milan criteria: a retrospective, exploratory analysis. Lancet Oncol 10:35-43
7 Lee S, Kim SH, Lee JE, Sinn DH, Park CK (2017) Preoperative gadoxetic acid-enhanced MRI for predicting microvascular invasion in patients with single hepatocellular carcinoma. J Hepatol 67:526-534 8 Zhao H, Hua Y, Dai T et al (2017) Development and validation of a novel predictive scoring model for microvascular invasion in patients with hepatocellular carcinoma. Eur J Radiol 88:32-40
9 Zhu F, Yang F, Li J, Chen W, Yang W (2019) Incomplete tumor capsule on preoperative imaging reveals microvascular invasion in hepatocellular carcinoma: a systematic review and meta-analysis. Abdom Radiol (NY) 44:3049-3057
10 Wei Y, Huang Z, Tang H et al (2019) IVIM improves preoperative assessment of microvascular invasion in HCC. Eur Radiol 29:5403-5414
11 Zhang J, Liu X, Zhang H et al (2019) Texture Analysis Based on Preoperative Magnetic Resonance Imaging (MRI) and Conventional MRI Features for Predicting the Early Recurrence of Single Hepatocellular Carcinoma after Hepatectomy. Acad Radiol 26:1164-1173
12 Kojima R, Ishida S, Ohta M, Iwata H, Honma T, Okuno Y (2020) kGCN: a graph-based deep learning framework for chemical structures. J Cheminform 12:32
Figures
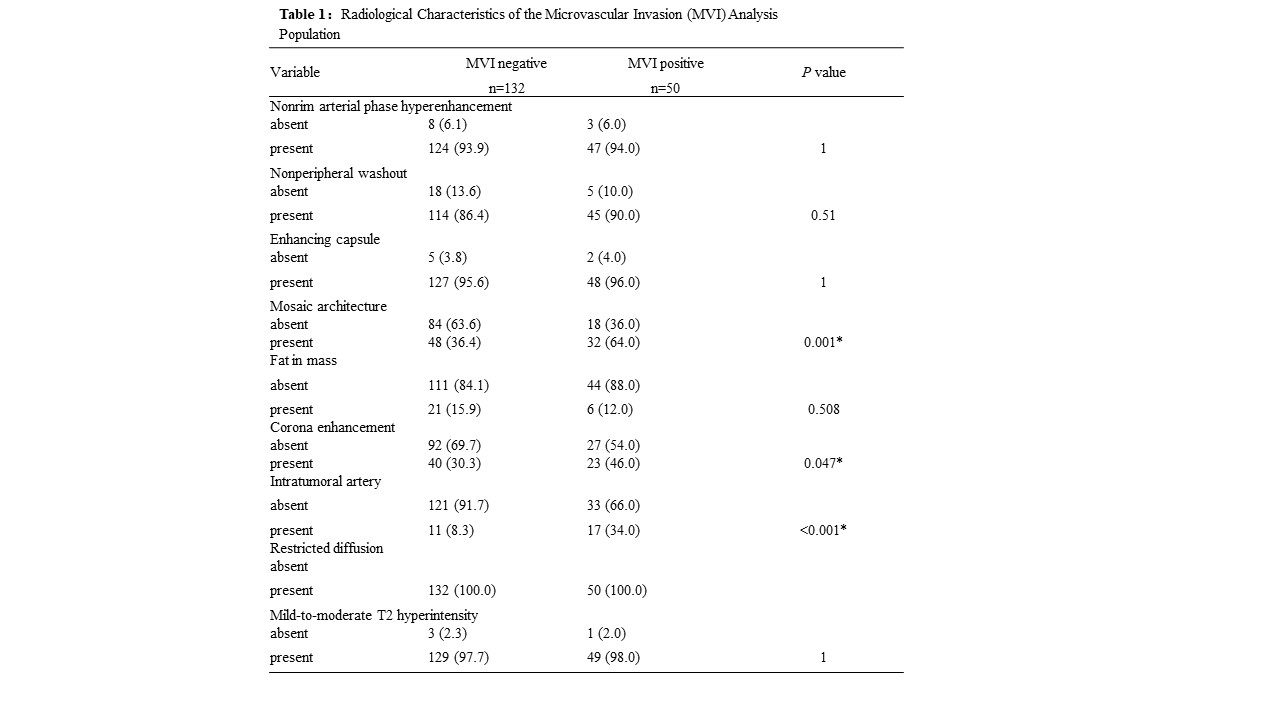
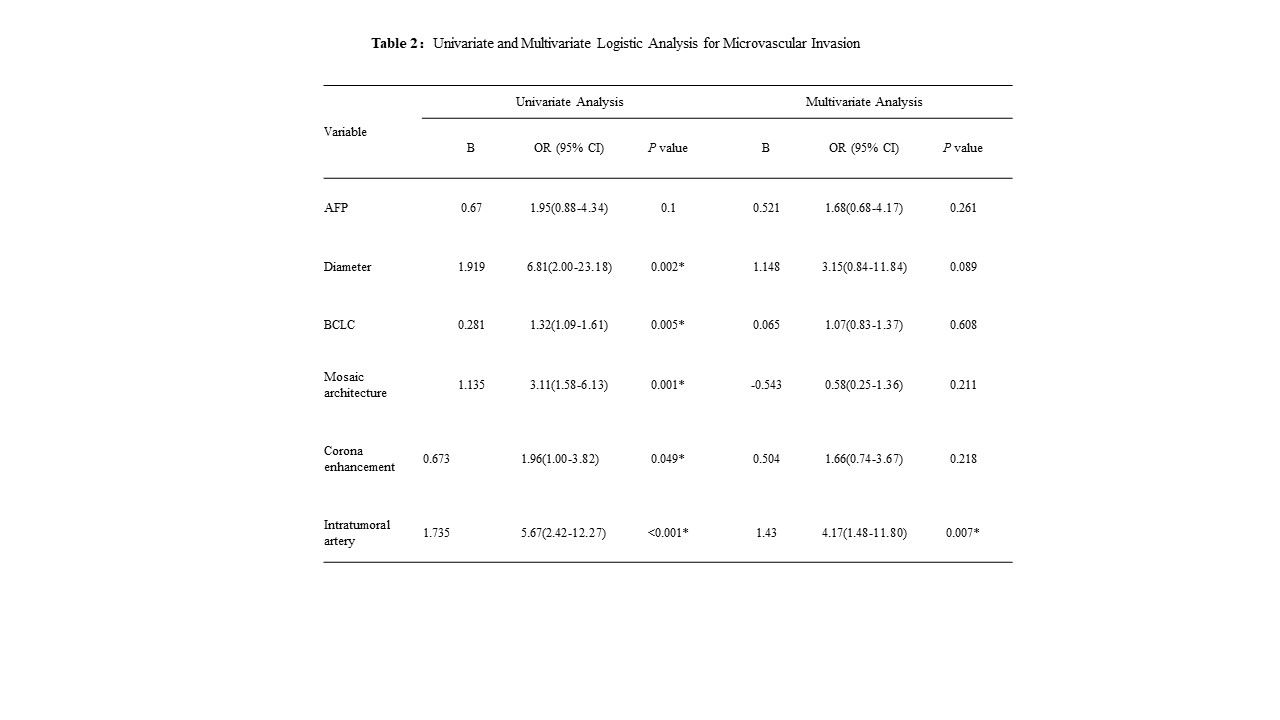
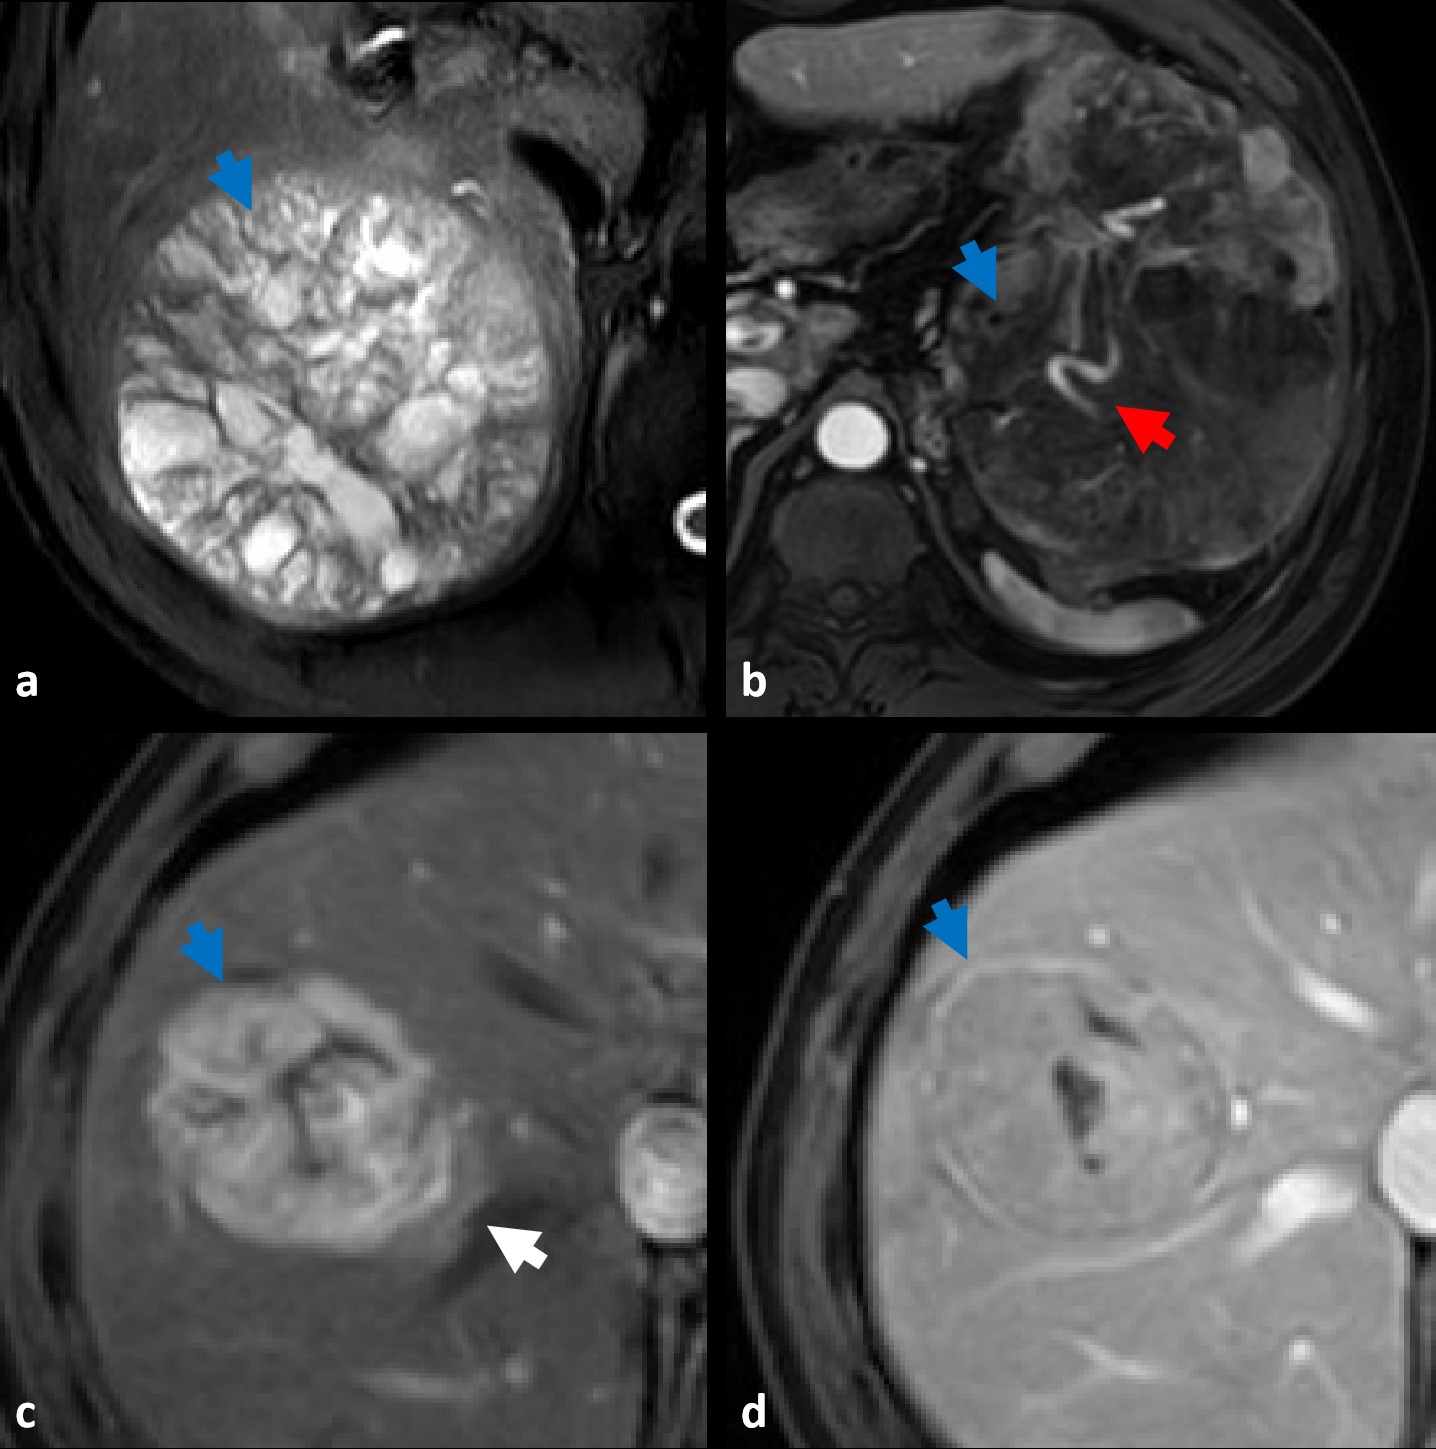
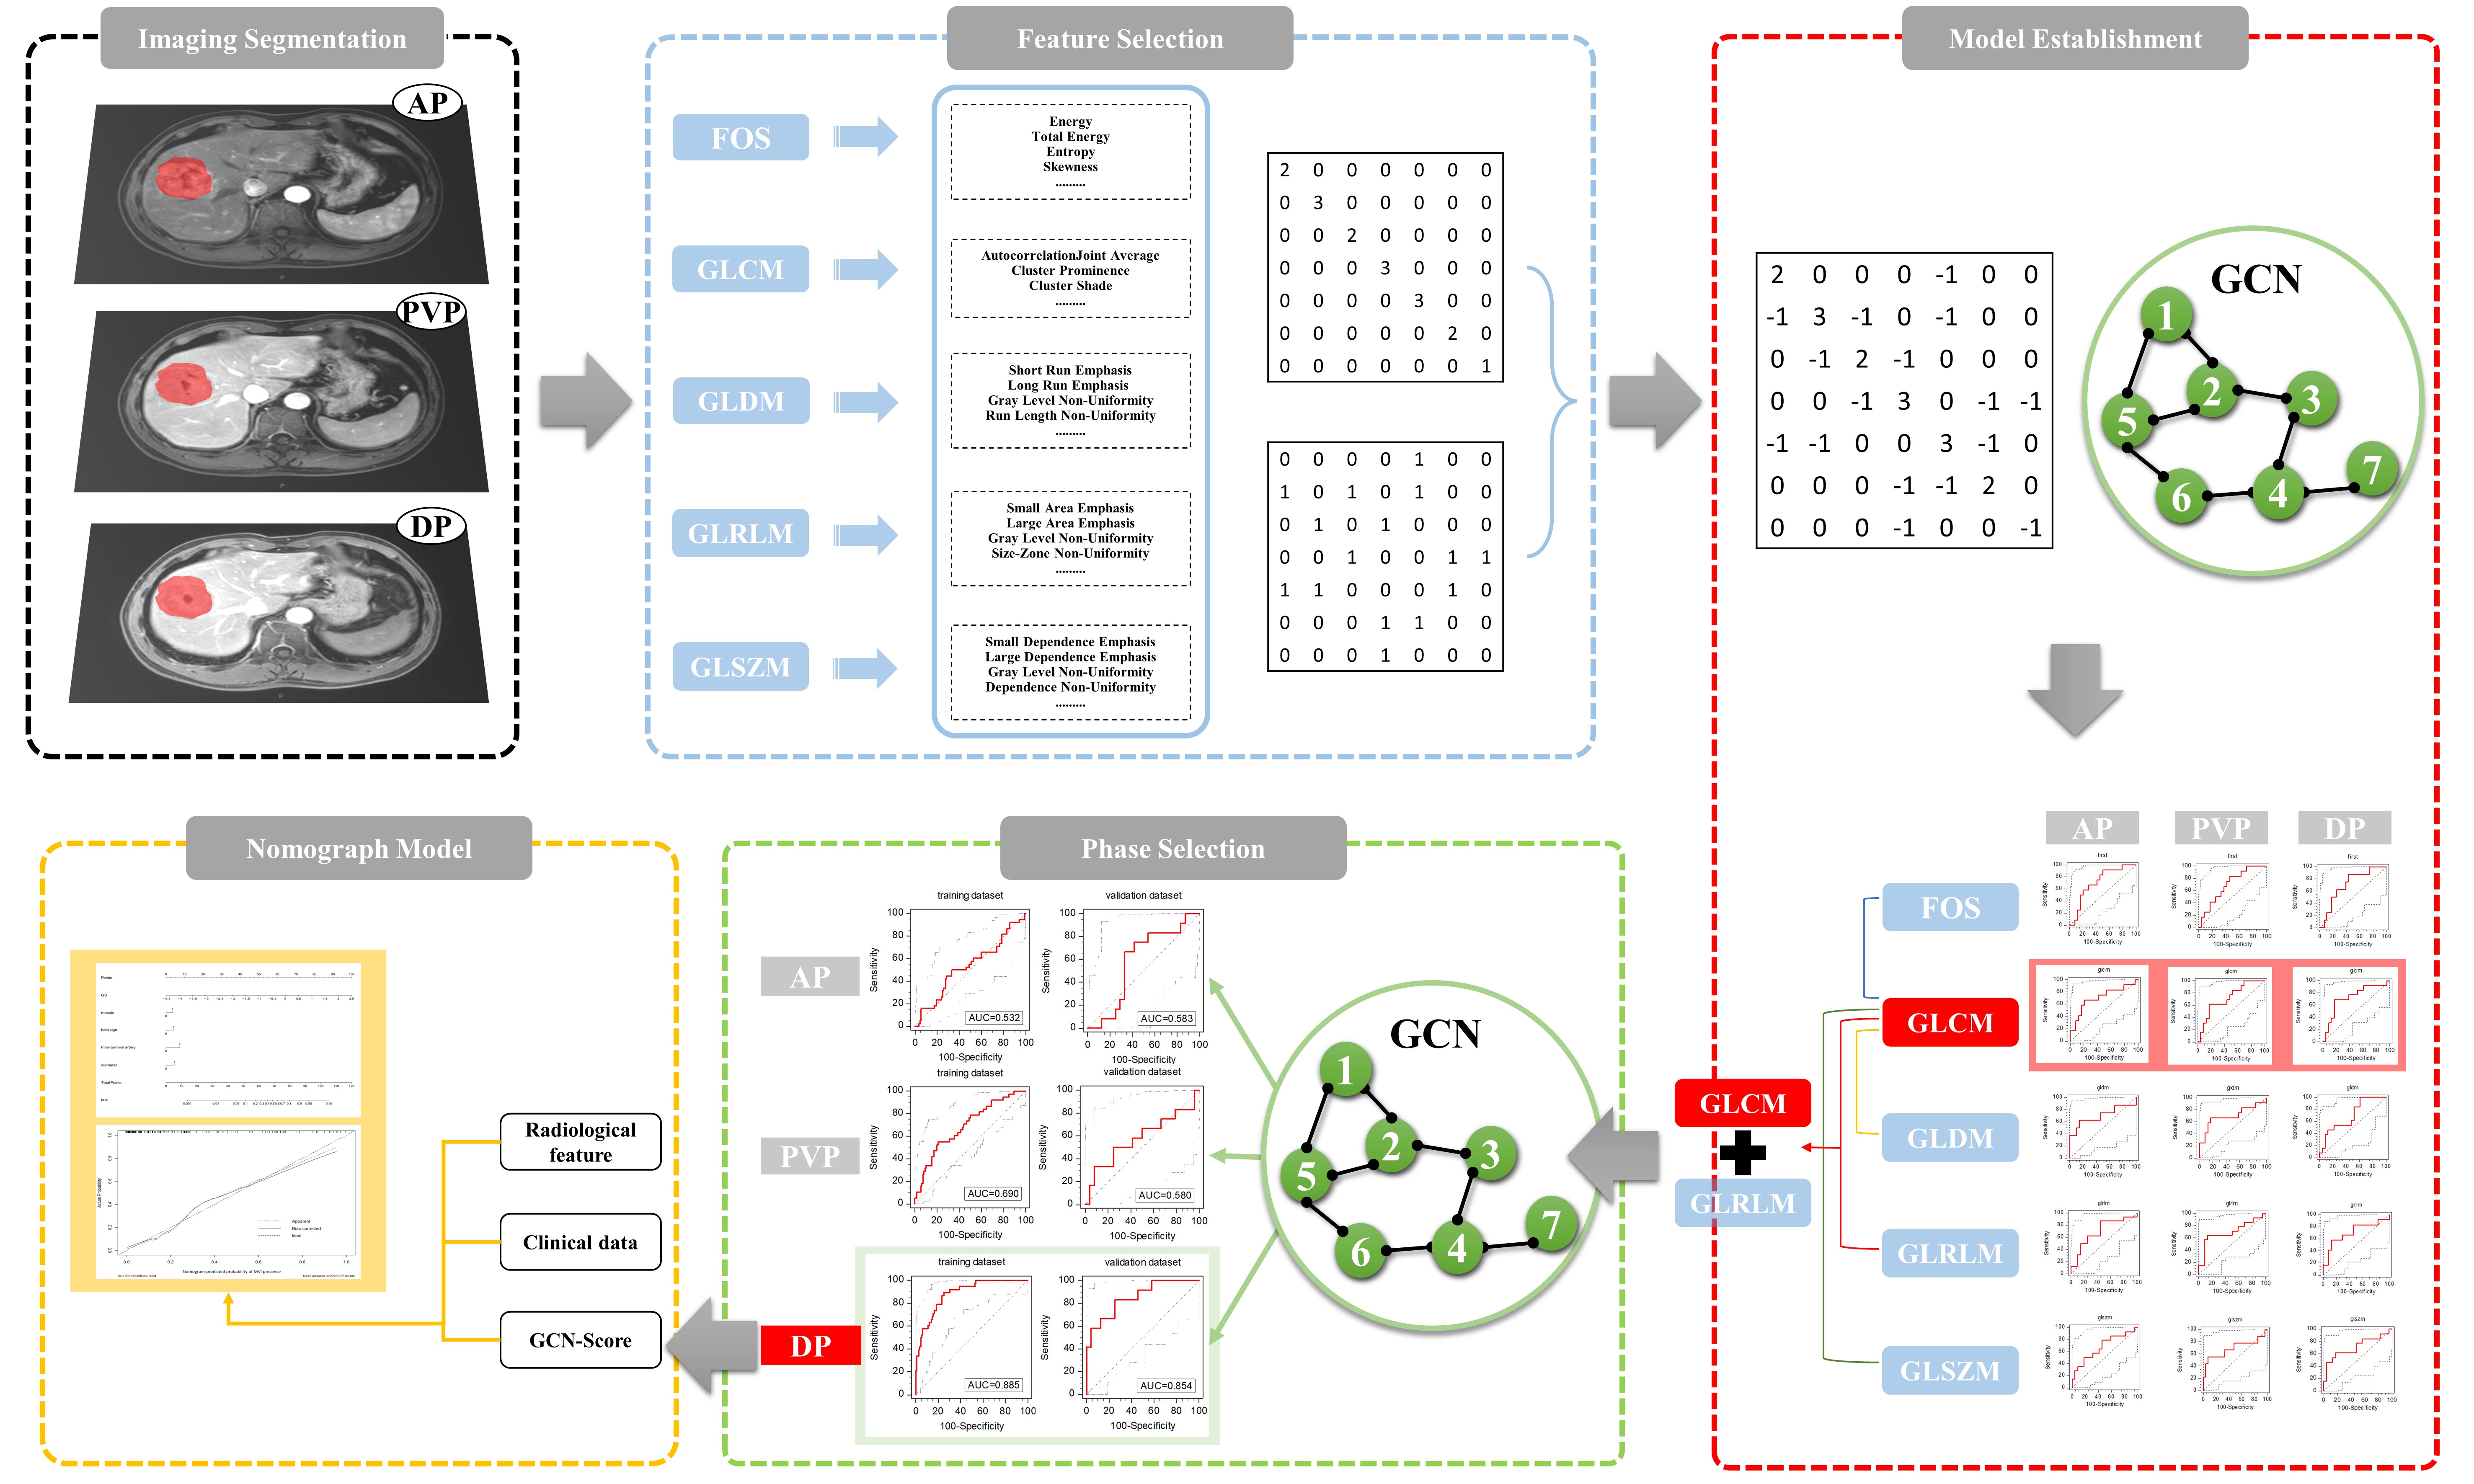
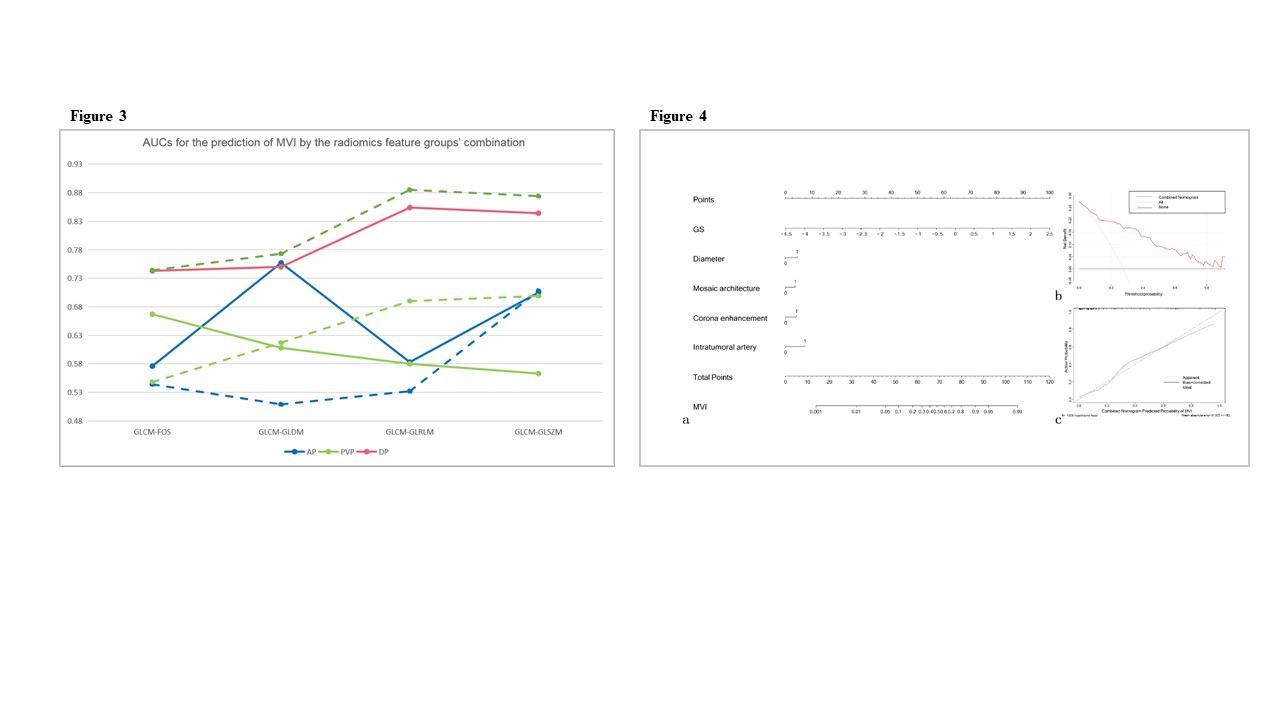
Figure 3. The AUC of each GCN combination model based on the AP, PVP and DP images of the training and validation groups, respectively.
Figure 4. a. Nomogram predicting the probability of MVI in HCC patients. b. The calibration curve for predicting the presence of MVI. c. Decision curve analysis for the combined nomogram.