3766
Dynamic Contrast-Enhanced T1 Mapping: Repeatability, Reproducibility, and Differentiating Clear Cell Renal Cell Carcinoma from Non-ccRCC1Radiology, Shanghai Tenth People’s Hospital, Tongji University School of Medicine, Shanghai, China, 2Philips Healthcare, Shanghai, China
Synopsis
T1 mapping is a quantitative MR technique that can be used to measure the longitudinal relaxation time of tissues. Previous studies demonstrated that it is potentially able to differentiate benign and malignant tumors and identify histopathological grade. In this study, the dynamic contrast enhanced (DCE) T1 mapping exhibited the robust reproducibility and repeatability and thus may have potential be used for quantitative renal tumor evaluation in cross-sectional and longitudinal studies. Furthermore, we found that clear cell renal cell carcinoma (ccRCC) had higher native and enhanced T1values than non-ccRCC. Thus, DCE T1 mapping is promising in differentiating ccRCC from non-ccRCC.
Introduction
Renal cell carcinomas (RCC) are the most common urologic malignancies and can be divided into various subtypes, among which ccRCC is the most common (about 70%). Prognosis at formally similar disease stages may differ despite same surgical treatment approaches to ccRCC and non–ccRCC1. Therefore, determination of the subtype of RCC by magnetic resonance imaging before surgery is vital for clinical decision-making in the management of RCC. For renal quantitative measurement, motion artifacts can affect the test–retest reproducibility, whichthis needs to be fully evaluated before cross sectional and longitudinal research. Thus, the purpose of this study was to assess the repeatability and reproducibility of dynamic contrast enhanced(DCE)T1 mapping in renal tumors, and to assess the capability of DCE T1 mapping to differentiate ccRCC from non-ccRCC.Methods
Thirteen patients with renal-occupying lesions were scanned continuously with an Ingenia CX 3.0T MRI system (Philips Healthcare, Best, the Netherlands) using a 32-channel body coil. The patients underwent a clinical routine image protocol of the kidneys and a pre-contrast T1 mapping based on Modified Look-Locker Inversion Recovery (MOLLI)sequences in coronal planes was acquired parallel to the long axis of both kidneys. Contrast-enhanced T1 mapping were acquired at 20 s and 120 s after intravenous administration of Gd-DTPA. Two radiologists, each with 5 years of experience in abdominal MRI, delineated ROIs independently and were blind to the pathology. ROIs were selected as the whole-lesion section without any choice. Each ROI was placed in the same section of a lesion in pre- and post-contrast cases. T1 reduction (T1d) was calculated in cortex phase and delay phase respectively as follows: T1d=T1pre(T1p)-T1enhanced(T1e). The intraclass correlation coefficient (ICC) was calculated to assess the intraobserver and interobserver reproducibility of the min, max, mean, and SD of T1 values. The agreement was considered good when ICC > 0.75. The differences in T1 mapping parameters between ccRCCs and non-ccRCC were compared using the Mann-Whitney U test. A value of P lower than 0.05 was considered statistically significant.Results
There were 10 patients diagnosed with ccRCC and 3 patients diagnosed with non-ccRCC (2 chromophobe RCC and 1 papillary RCC). The min, max, mean, and SD of T1 values measured by observer A and observer B showed good intraobserver and interobserver agreement. (ICC>0.75). CcRCC had higher mean T1p and T1d delay than non-ccRCC (p=0.043, 0.043 respectively). CcRCC had higher minimum T1d cortex and T1d delay than non-ccRCC (p= 0.028, 0.043 respectively). CcRCC had higher maximum T1p and T1e cortex than non-ccRCC (p= 0.011, 0.042 respectively). CcRCC had higher maximum T1e cortex and T1d cortex than non-ccRCC (p= 0.011, 0.018 respectively). The box-and-whisker plots are displayed in Figure 1.Discussion
This study showed that DCE T1 mapping with Gd-DTPA can be used to quantitatively evaluate the renal masses (Figure 2, 3). Overall, ccRCC had higher T1values than non-ccRCC both in pre- and post-contrast. There are two potential reasons for our findings. Firstly, ccRCCs are highly vascularized tumors and can secrete growth factors that act on endothelial cells to stimulate angiogenesis, which helps the tumor recruit blood vessels from adjacent tissues2. Secondly, the components of ccRCCs mainly include cells with clear cytoplasm and necrosis, hemorrhage, and cystic degeneration3. Based on the above findings, T1d may increase with the increase of necrosis, cystic degeneration and blood supply. Therefore, the T1 value may directly reflect the components of tumor and can be used instead of signal intensity to evaluate the tissues.Conclusion
Dynamic contrast-enhanced T1 mapping can provide reliable and accurate parameters for the assessment of renal tumors and promising in differentiating ccRCC from non-ccRCC.Acknowledgements
None.References
1. Ahrens M, Scheich S, Hartmann A, Bergmann L; IAG-N Interdisciplinary Working Group Kidney Cancer of the German Cancer Society. Oncol Res Treat. 2019;42(3):128-135.
2. Kinouchi T, Mano M, Matsuoka I, Kodama S, Aoki T, Okamoto M, Yamamura H, Usami M, Takahashi K. Immature tumor angiogenesis in high-grade and high-stage renal cell carcinoma. Urology. 2003;62:76570
3. Campbell N, Rosenkrantz AB, Pedrosa I. MRI phenotype in renal cancer: is it clinically relevant? Top Magn Reson Imaging. 2014;23:95-115.Figures
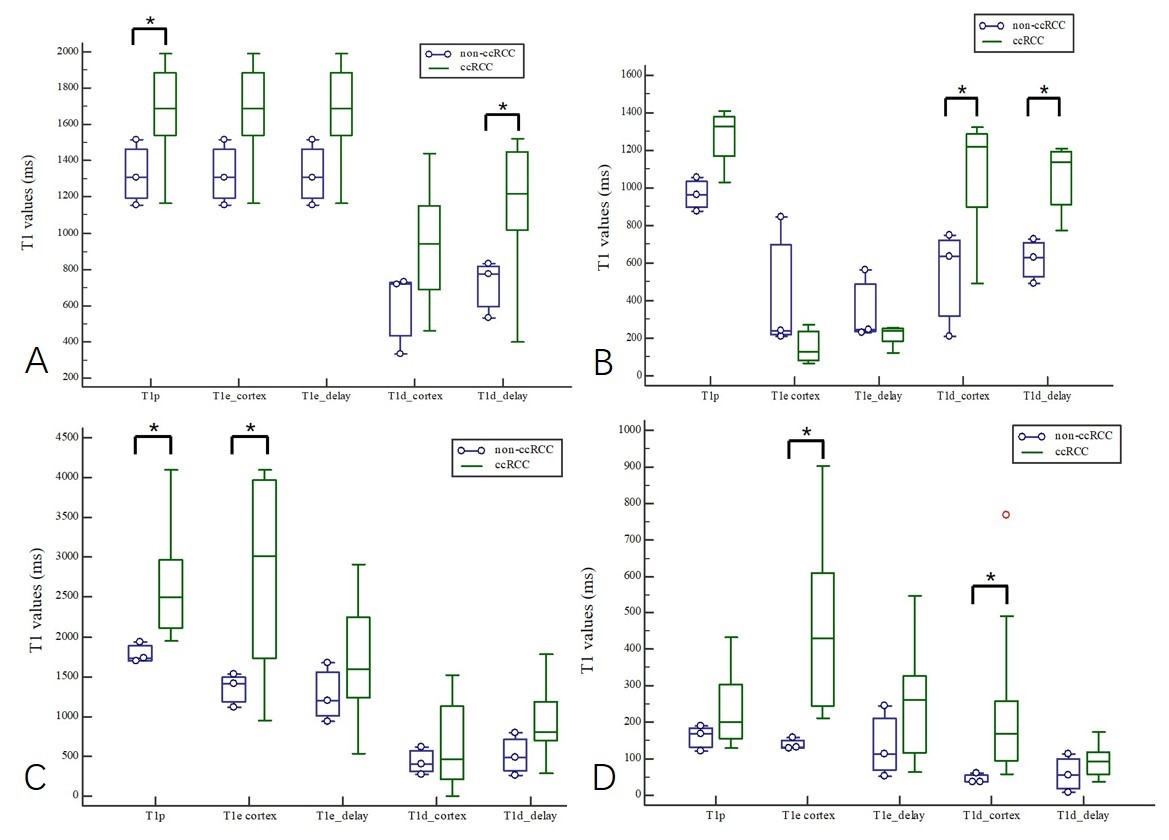
Figure 1 Distribution of T1p, T1e cortex, T1e delay, T1d cortex, and T1d delay between ccRCC and non-ccRCC. *, P<0.05.
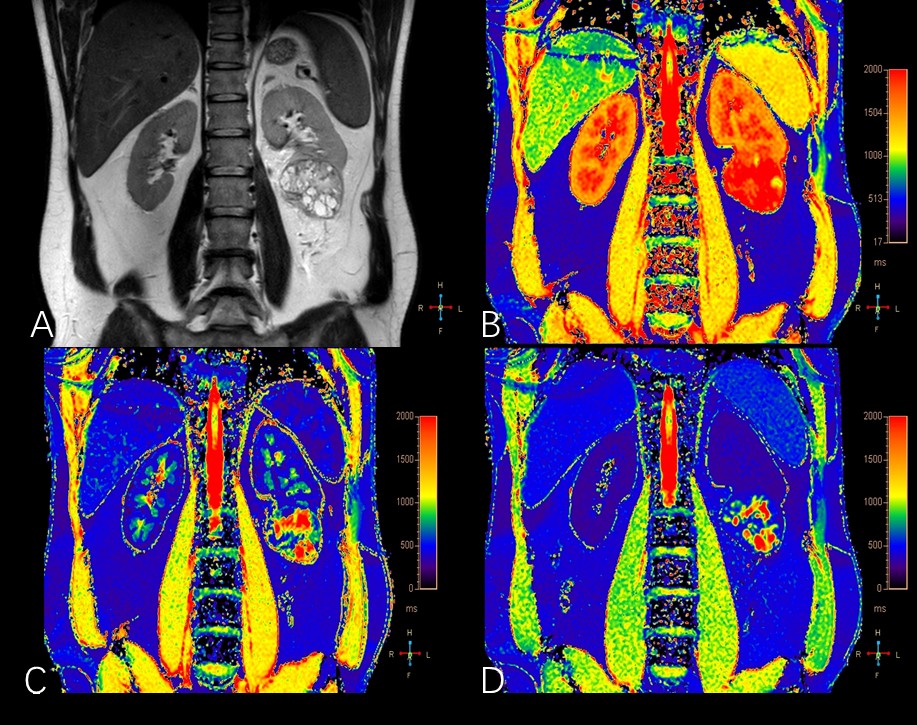
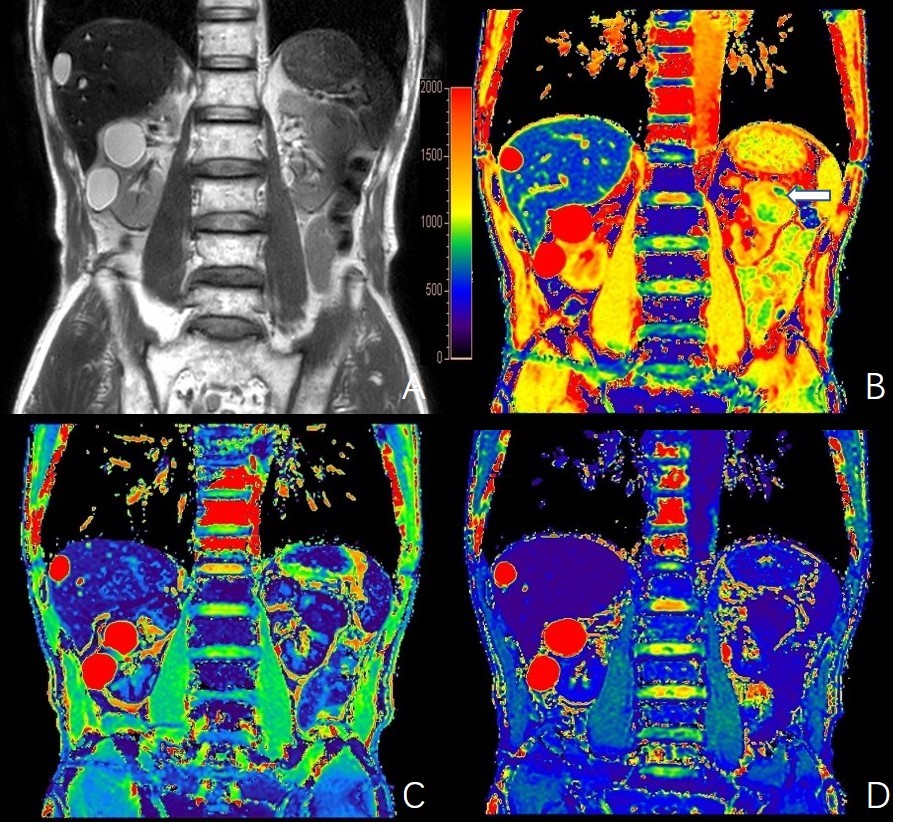
Figure 3 A 75-year-old man diagnosed as left renal chromophobe RCC. (A) T2 weighted image; (B) native T1 value map; (C) T1 value maps in cortex phase; (D) T1 value map in delay phase. The lesion appeared iso-intense on T2WI, which reflected a lower native T1 value (mean 1264.21ms). The arrow showed the region of hemorrhage with a lowest T1 value (mean 804.74ms). Enhanced T1 mapping showing an continuous enhancement reflected the reduction of T1 values (mean 507.05ms in cortex phase, mean 284.86ms in delay phase).