3765
To characterize clear cell renal cell carcinoma using diffusion weighted imaging with a fractional order calculus model1Department of Medical Imaging, Clinic Medical School, Yangzhou University, Northern Jiangsu Province Hospital, Yangzhou, China, 2MR Collaboration, Central Research Institute, Shanghai United Imaging Healthcare Co.,Ltd, Shanghai, China, 3Shanghai Key Laboratory of Magnetic Resonance, School of Physics and Electronics Science, East China Normal University, Shanghai, China, 4MR Collaboration, Central Research Institute, Shanghai United Imaging Healthcare, Shanghai, China
Synopsis
Accurately characterizing ccRCC grades with a non-invasive method would be vital for guiding treatment and prognosis. This study evaluated and compared the performance of conventional ADC and the FROC parameters, Dfroc, β, μ, in differentiation of low- and high-grade ccRCC. All the FROC parameters showed better diagnostic performance than ADC in characterizing ccRCC grades, among which β yielded the highest AUC value. This implied the clinical potential of the FROC model in evaluating renal tumor aggressiveness and the dominant role of β in probing tumor heterogeneity and microstructural complexity.
Introduction
As the most common kidney malignancy with high incidence and mortality, renal cell carcinoma (RCC) accounts for more than 85% of cases, of which clear cell RCC (ccRCC) is more aggressive than other subtypes1. Due to the variable biological mechanism and diverse clinical outcomes of ccRCC patients with different grades, accurate tumor grading with a non-invasive method would be vital for guiding treatment and prognosis2-3. Apparent diffusion coefficient (ADC), derived from conventional diffusion weighted imaging (DWI) on the basis of Gaussian distribution, has become a potential biomarker for characterizing ccRCC histological grades4-5. While the instinct limitation of ADC and complexity of microenvironment limited the diagnostic ability of ADC in grading ccRCC6-7. The fractional order calculus (FROC) model has been developed to explore the true diffusion process within complex biologic tissues in the scope of non-Gaussian diffusion with three parameters: diffusion coefficient (Dfroc, μm²/ms), fractional order derivative in space (β), and a spatial parameter (μ, μm)8. This study aims to evaluate and compare the performance of the FROC model and conventional ADC in distinguishing low- from high-grade ccRCC.Methods
Totally 35 ccRCC patients were enrolled in this study, of which 20 patients were low-grade ccRCC (age range: 46-79 years) and the rest were high-grade ccRCC (age range: 53-75 years). All MRI examinations including T1-weighted, T2-weighted imaging and DWI (11 b-values: 0, 20, 50, 100, 300, 500, 800, 1000, 1500, 2000, 3000 s/mm2) were performed on a 3 T scanner (uMR780, United Imaging Healthcare, Shanghai, China). The detailed protocols of MR sequences are presented in Table 1. Three FROC parameters comprising Dfroc, β and μ, together with ADC, were calculated with different b-value DWI (ADC: 0/800 s/mm2; FROC: all the b values) using MATLAB 2021a (MathWorks, Natick, MA, USA) based on the corresponding mathematical expressions9-10. Regions of interest (ROIs) were manually delineated on the DWI images of b value = 1000 s/mm2, covering the whole tumor without the part of necrotic and cystic regions, and then transferred to the corresponding diffusion metric maps. The differences of diffusion metrics were compared between two groups utilizing Independent student’s t-test or Mann-Whitney U test according to their normal distribution evaluated by Kolmogorov-Smirnov’s test. A diagnostic model combining FROC parameters, Dfroc, β, μ, was established by applying the binary logistic regression analysis. The diagnostic performance of single parameter as well as above combination in grading ccRCC was accessed by receiver operating characteristic (ROC) analysis. Statistical analyses were performed with software SPSS (version 20, SPSS Inc., IL, USA) and statistical significance was considered when P < 0.050.Results
Manifestations of low- and high-grade ccRCC in diffusion parametric maps are shown in Figure 1. Box-and-whisker plots are used to display the distribution of all metrics for low- and high-grade ccRCC (Figure 2). All metrics, Dfroc (P < 0.001), β (P < 0.001), μ (P < 0.001) and ADC (P = 0.022) were statistically different between the two groups (Table 2). The results of ROC analysis for single parameter and the combination of the FROC parameters are demonstrated in Figure 3, among which β and the combination of the FROC parameters yielded the same highest AUC values (0.947), followed by μ (0.900), Dfroc (0.880) and ADC (0.730).Discussion
In this study, the role of the FROC parameters and ADC in characterizing ccRCC with different grades was evaluated. Higher ADC and Dfroc values in low-grade ccRCC compared with high-grade ccRCC were found, which might be caused by decreased extracellular space due to tumor cells proliferation and increased cellularity in high-grade group11. The lower β values observed in high-grade ccRCC were consistent with previous study12. One possible explanation is that as the increase of histological grade, the nuclei tends to be larger and the vascularity higher, which may result in the more heterogeneous and complex microstructure13-14. ROC analysis showed that μ, Dfroc and β outperformed ADC in grading ccRCC in our study, and this finding further demonstrated the potential of the FROC model in the clinical application of ccRCC. Additionally, the highest AUC value was found for β in characterizing ccRCC with different grades and the combination of the FROC parameters did not improve the diagnostic efficacy compared with β, suggesting the dominant role of β in probing the heterogeneity in tumors with different grades. In conclusion, our study showed that the FROC parameters yielded better performance than conventional ADC in distinguishing low- from high-grade ccRCC and β could provide more useful and additional information for predicting tumor aggressiveness, heterogeneity and microstructural complexity. The FROC model could serve as a compliment to ADC and have great clinical potential for renal tumor diagnosis, grading, treatment decision and monitoring for treatment response.Acknowledgements
No acknowledgement found.References
1. Barata PC, Rini BI. Treatment of renal cell carcinoma: current status and future directions. CA: a cancer journal for clinicians. 2017; 67: 507-524.
2. Chen DYT, Uzzo RG. Optimal management of localized renal cell carcinoma: surgery, ablation, or active surveillance. J Natl Compr Canc Ne. 2009; 7: 635-643.
3. Tsui KH, SHVARTS O, SMITH RB, et al. Prognostic indicators for renal cell carcinoma: a multivariate analysis of 643 patients using the revised 1997 TNM staging criteria. J Urology. 2000; 163: 1090-1095.
4. Villavicencio CP, Mc Carthy RJ, Miller FH. Can diffusion-weighted magnetic resonance imaging of clear cell renal carcinoma predict low from high nuclear grade tumors. Abdom Radiol. 2017; 42: 1241-1249.
5. Mytsyk Y, Dutka I, Borys Y, et al. Renal cell carcinoma: applicability of the apparent coefficient of the diffusion-weighted estimated by MRI for improving their differential diagnosis, histologic subtyping, and differentiation grade. Int Urol Nephrol. 2017; 49: 215-224.
6. Lai V, Lee VHF, Lam KO, et al. Intravoxel water diffusion heterogeneity MR imaging of nasopharyngeal carcinoma using stretched exponential diffusion model. Eur Radiol. 2015; 25: 1708-1713.
7. Zhang JL, Sigmund EE, Chandarana H, et al. Variability of renal apparent diffusion coefficients: limitations of the monoexponential model for diffusion quantification. Radiology. 2010; 254: 783-792.
8. Chen W, Sun H, Zhang X, et al. Anomalous diffusion modeling by fractal and fractional derivatives. Computers & Mathematics with Applications. 2010; 59: 1754-1758.
9. Yu X, Lin M, Ouyang H, et al. Application of ADC measurement in characterization of renal cell carcinomas with different pathological types and grades by 3.0 T diffusion-weighted MRI. Eur J Radiol. 2012; 81: 3061-3066.
10. Tang L, Sui Y, Zhong Z, et al. Non‐Gaussian diffusion imaging with a fractional order calculus model to predict response of gastrointestinal stromal tumor to second‐line sunitinib therapy. Magn Reson Med. 2018; 79: 1399-1406.
11. Ye J, Xu Q, Wang SA, et al. Quantitative evaluation of intravoxel incoherent motion and diffusion kurtosis imaging in assessment of pathological grade of clear cell renal cell carcinoma. Acad Radiol. 2020; 27(7): e176-e182.
12. Magin RL, Abdullah O, Baleanu D, et al. Anomalous diffusion expressed through fractional order differential operators in the Bloch–Torrey equation. J Magn Reson Imaging. 2008; 190(2): 255-270.
13. Qian CN, Huang D, Wondergem B, et al. Complexity of tumor vasculature in clear cell renal cell carcinoma. Cancer. 2009; 115(S10): 2282-2289.
14. Fuhrman SA, Lasky LC, Limas C. Prognostic significance of morphologic parameters in renal cell carcinoma. Am J Surg Pathol. 1982; 6: 655-664.
Figures
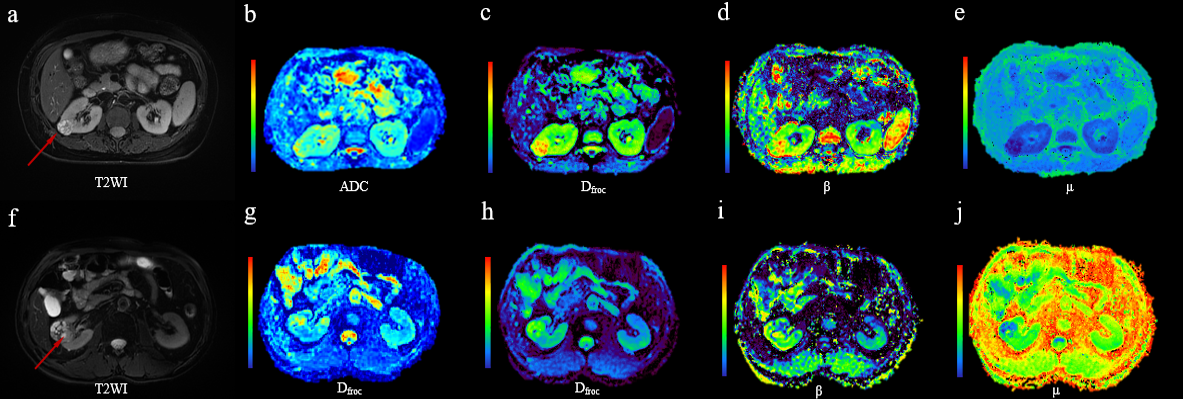
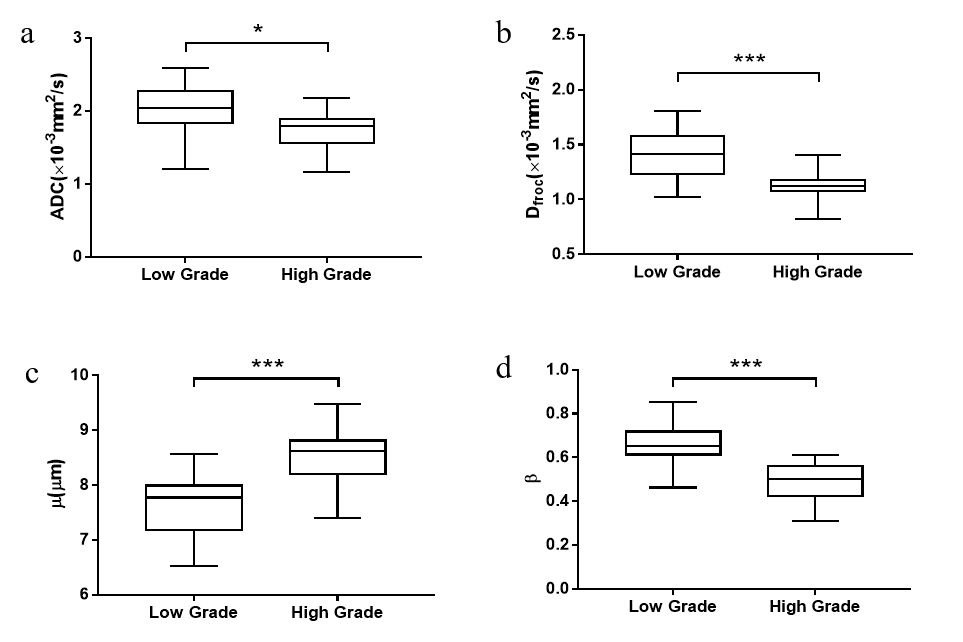
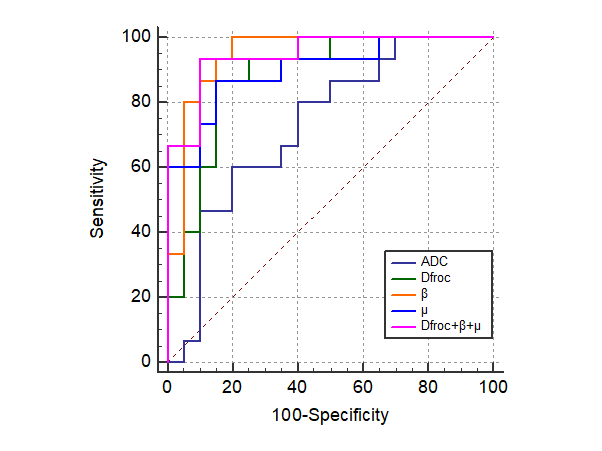
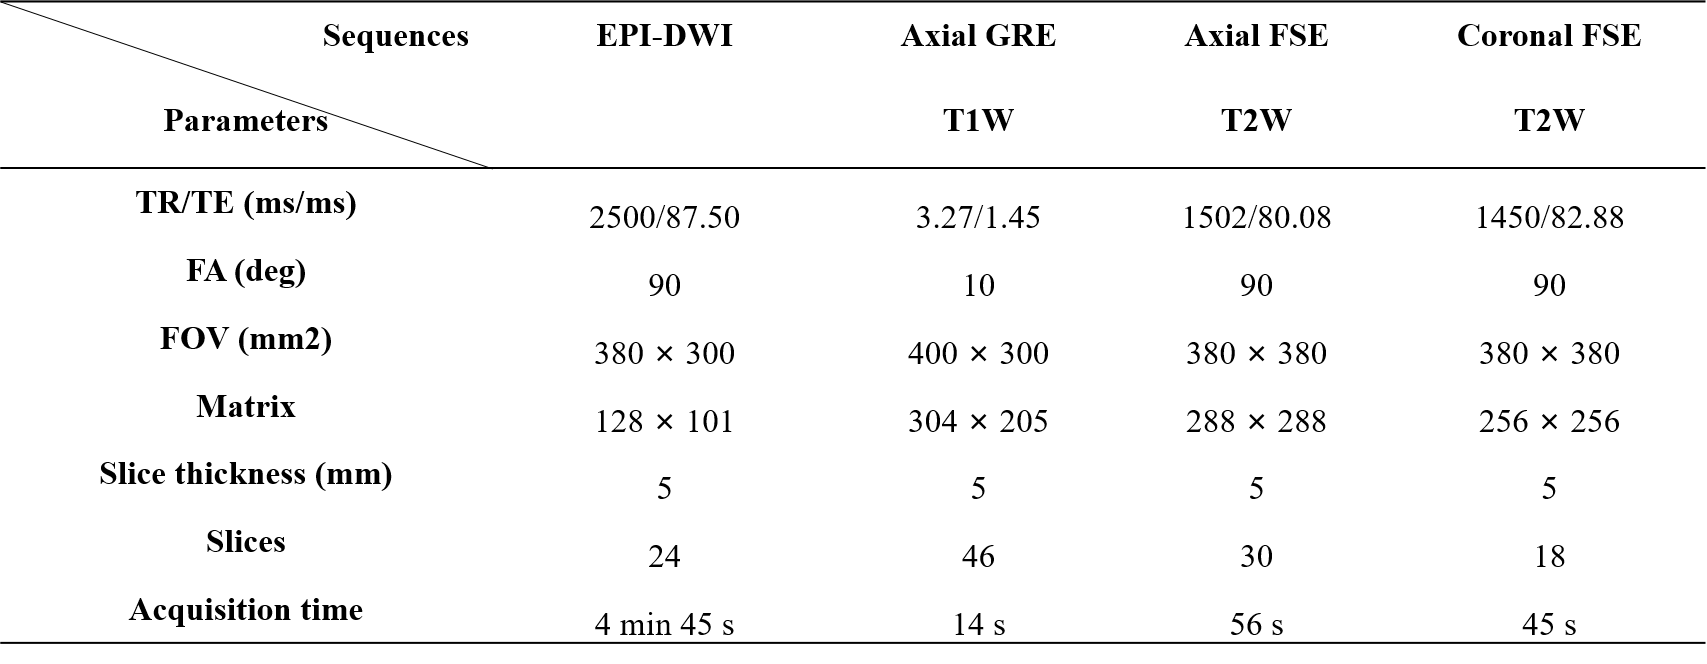
Table 1 The scanner parameters of MR sequences
* EPI, echo planar imaging; DWI, diffusion weighted imaging; GRE, gradient recalled echo; FSE, fast spin echo; TR, repetition time; TE, echo time; FA, flip angle; FOV, field of view.
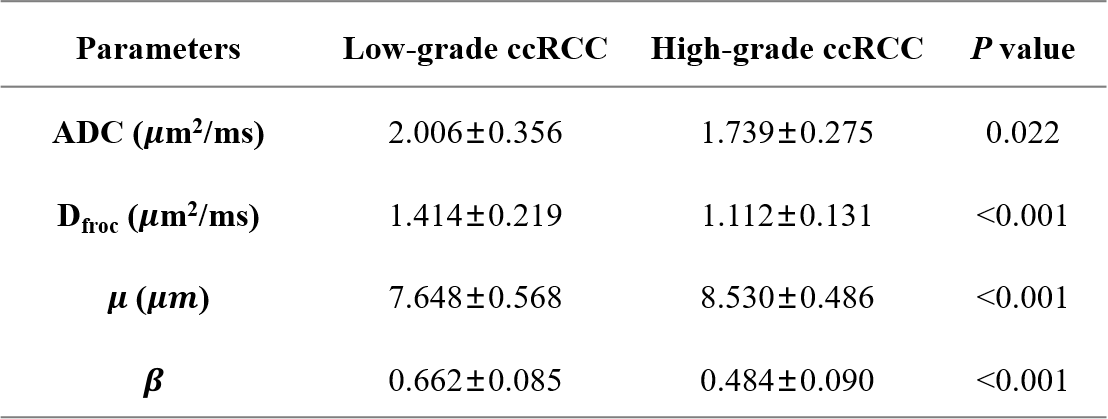
Table 1 Diffusion metrics of low- and high-grade ccRCCs
* ccRCC, Clear cell renal cell carcinoma; ADC, apparent diffusion coefficient. Data are presented as mean ± standard deviation.