3764
Differentiation of Primary and Secondary Liver Cancer with Amide Proton Transfer-weighted imaging and Dynamic contrast-enhanced imaging1Department of Radiology, the First Affiliated Hospital of Dalian Medical University, Dalian, China, 2Philips Healthcare, Beijing, China
Synopsis
Liver cancer has become one of the most frequent fatal malignancies around the world. And the early precise diagnosis of different types of liver cancer is very critical for treatment strategy design. This retrospective study evaluated the diagnostic efficacy of amide proton transfer weighted (APTw) and dynamic contrast-enhanced (DCE) imaging for the differentiation between primary and secondary liver cancer. Results showed that a combination of APTw and DCE significantly improved the diagnosis of liver cancer.
Introduction
Hepatocellular carcinoma (HCC), intrahepatic cholangiocellular carcinoma (ICC), and hepatic metastases (HM) are the most common malignant liver lesions, among which HCC and ICC are primary, while HM is secondary liver cancer. The early diagnosis of liver cancer is very critical for the treatment selection and prognosis [1]. Amide proton transfer weighted (APTw) imaging, also known as amide CEST, is by far the most popularly studied branch of CEST imaging because of its feasibility and robustness at 3.0 T and its sensitivity to mobile protons on peptides/proteins in tissue. Previous studies showed that APTw imaging at 3.0 T had great potential value in the clinical diagnosis of brain tumors, breast tumors, cerebral ischemia disease, and Parkinson’s disease [2]. In this study, we investigated the performance of APTw and DCE imaging in the differentiation of primary and secondary liver cancer.Materials and Methods
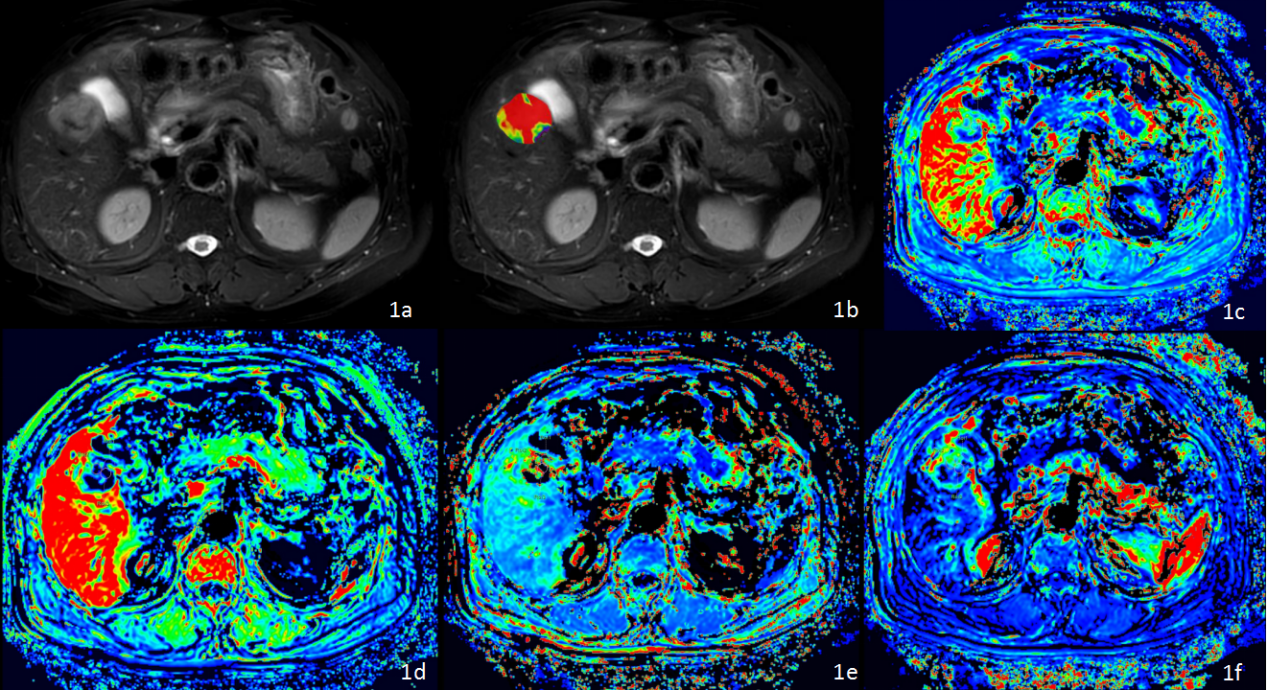
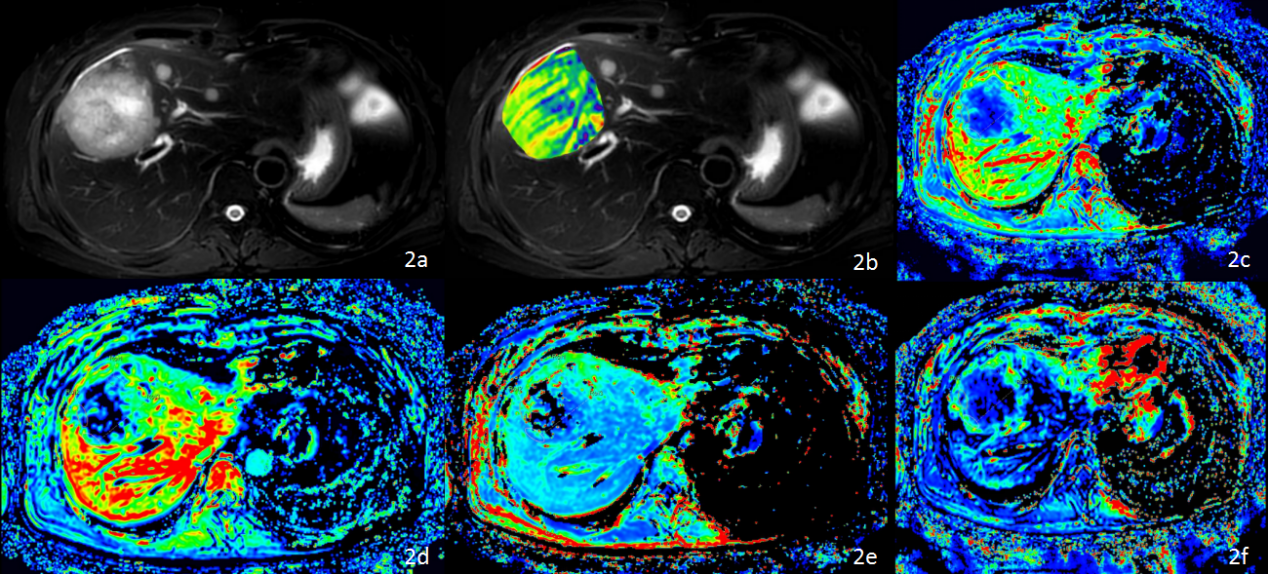
This study has been approved by the local IRB. 28 cases of focal liver lesions in our hospital were retrospectively analyzed, including 18 cases of primary liver cancer (15 male, 61.94±9.27 years old; HCC, n=12; ICC, n=6) and 10 cases of secondary liver cancer (6 male, 61.33±5.85 years old). DCE, ATPw, and T2w were performed on a 3.0 T MR scanner using a 16-channel abdominal array coil (Ingenia CX, Philips Healthcare) with parameters listed in Table 1. MR raw data were transferred to a workstation (Intellispace Portal v10, Philips Healthcare) for post-processing. The circle ROIs (100-200 mm2) were manually placed on the slices with a maximum display of lesions on APTw and DCE parameter images referring to the anatomical location of lesions on T2w images, respectively (Figures. 1 and 2). Ktrans, Kep, Ve, and Vp measured by DCE and MTRasym by APTw imaging were compared between the two groups of patients using the independent t-test or Mann-Whitney U test. ROC curves were used to analyze the diagnostic efficiency of the above parameters in differentiation between primary and secondary liver cancer. Logistic regression was used to calculate the combined value of APTw with DCE parameters in the diagnosis of primary and secondary liver cancer. The AUC values of different parameters were compared using the Delong test. Spearman correlation analysis was used to evaluate the correlation between APTw and DCE parameters for patients with both primary and secondary liver cancer. 0.8 < r ≤1 means highly correlated, 0.5 < r ≤ 0.8 means moderately correlated, 0.3 < r ≤ 0.5 means mildly correlated, and r ≤ 0.3 means no correlated [4]. P< 0.05 was considered to be statistically significant.Results
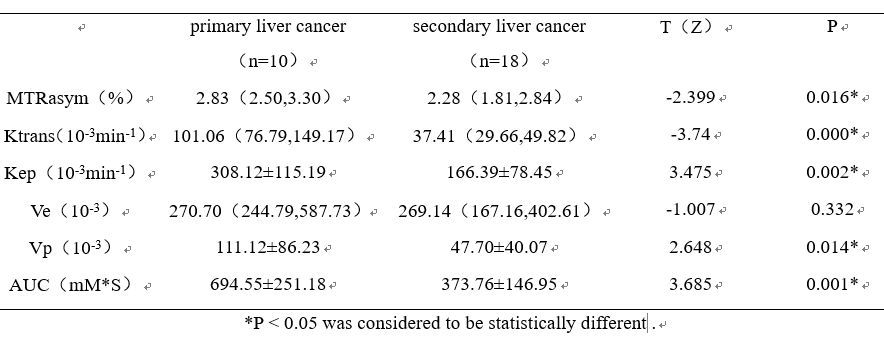
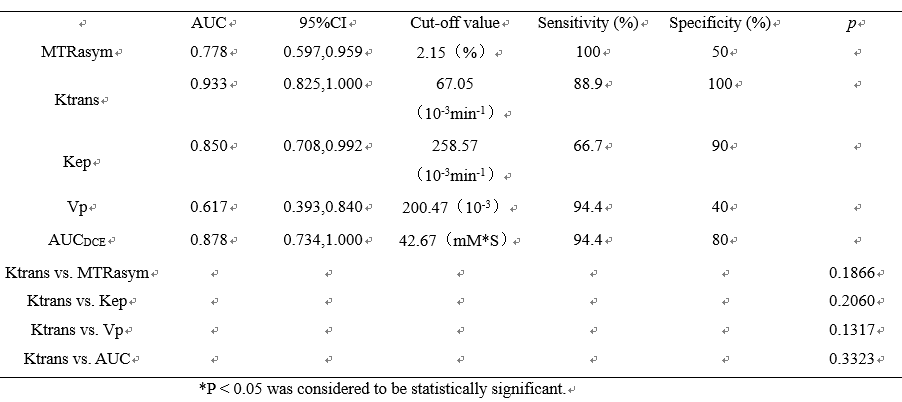
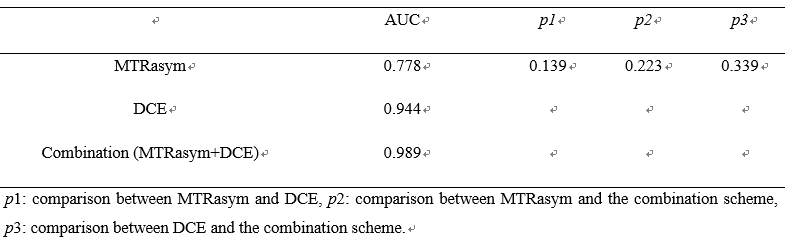
The Ktrans, Kep, Vp, AUC, and MTRasym in primary liver cancer were significantly higher than those of secondary liver cancer (all p < 0.05, Table 2). The area under the ROC curves (AUCs) for Ktrans, Kep, Vp, AUC, and MTRasym for differential diagnosis between primary and secondary liver cancer were 0.933, 0.850, 0.617, 0.878, and 0.778, respectively (Table 3 and Figure 3). The sensitivity of above parameters under respective feasible thresholds were 100%, 88.9%, 66.7%, 94.4%, 94.4%, and the corresponding specificity were 50%, 100%, 90%, 40%, 80%. Differences between the AUC for Ktrans and AUCs for other parameters were not statistically significant (Table 3). The combination of APT and DCE parameters showed the highest AUC value of 0.989, and the diagnostic sensitivity and specificity were 90% and 100% respectively (Table 4). No obvious correlation was observed between APT and DCE parameters (r ≤ 0.3, Table 5).Discussion and conclusion
Quantitative parameters including the MTRasym by APTw, and Ktrans, Kep, Vp, and AUC by DCE imaging were observed significantly higher in primary than in secondary liver cancer. Amide proton transfer (APT) imaging is sensitive to mobile protons of peptides/proteins in tissues. In addition, the previous literature indicated that DCE measurements reflect significant differences between malignant liver lesions [5], especially at peak enhancement and during the washout phases. And Ktrans can reflect the mixed effect of blood flow rate (Fp) and tissue permeability (PS) [6]. APTw combined DCE imaging may serve as a promising tool for clinical differentiation between primary and secondary liver cancer.Acknowledgements
No acknowledgement.References
[1] Anwanwan D, Singh SK, Singh S, Saikam V, Singh R. Challenges in liver cancer and possible treatment approaches. Biochim Biophys Acta Rev Cancer. 2020 Jan;1873(1):188314.
[2] Li S, Chan P, Li C, Chen H, Chen M, Su W, Li K, Lu N, Yu L, Chu D, Wu PY. Changes of Amide Proton Transfer Imaging in Multiple System Atrophy Parkinsonism Type. Front Aging Neurosci. 2020 Sep 30;12:572421.
[3] Zwick S, Brix G, Tofts PS, Strecker R, Kopp-Schneider A, Laue H, Semmler W, Kiessling F. Simulation-based comparison of two approaches frequently used for dynamic contrast-enhanced MRI. Eur Radiol. 2010 Feb;20(2):432-42.
[4] Dan Z, Yi F, Qi Z, Yi-Jie Q, Xiao-Fan T, Shuai-Nan S, Yi D, Tian-Shu L, Wen-Ping W. The value of dynamic contrast enhanced ultrasound (DCE-US) in monitoring treatment effect of high-intensity focused ultrasound (HIFU) in locally advanced pancreatic cancer (LAPC). Clin Hemorheol Microcirc. 2020 Nov 25.
[5] Tofts PS, Brix G, Buckley DL, Evelhoch JL, Henderson E, Knopp MV, Larsson HB, Lee TY, Mayr NA, Parker GJ, Port RE, Taylor J, Weisskoff RM. Estimating kinetic parameters from dynamic contrast-enhanced T(1)-weighted MRI of a diffusable tracer: standardized quantities and symbols. J Magn Reson Imaging. 1999 Sep;10(3):223-32.
Figures