3763
Histogram Peritumoral Enhanced Features on 3.0T MRI Arterial Phase Can Predict the Microvascular Invasion of Hepatocellular Carcinoma1Department of Radiology, Harbin Medical University Cancer Hospital, Harbin, China, 2Harbin University, Harbin, China, 3Philips Healthcare, Beijing, China
Synopsis
Preoperative microvascular invasion (MVI) prediction plays an important role in therapeutic decision-making of hepatocellular carcinoma (HCC). We aimed to investigate the value of histogram based on the arterial phase (AP) of magnetic resonance imaging (MRI) with extracellular contrast agent compared with radiological features for predicting MVI of solitary HCC. Results showed that peritumoral AP enhanced degree on MRI showed an encouraging predictive performance for preoperative prediction of MVI, especially in sHCCs (AUC=0.798, sensitivity =54.84%, specificity =100% ). Corona enhancement thickness≤8 mm may be used as a predictive marker for MVI when compared with the group with thickness>8 mm.
Introduction
Microvascular invasion (MVI) is one of the crucial potential risk factors for early recurrence of hepatocellular carcinoma (HCC), even for solitary small HCC (sHCC) (1). The definitive diagnosis of MVI in HCC preoperatively can guide treatment choice and reduce the duration of the disease. Previous studies revealed that MVI of HCC can be predicted by radiological features, such as peritumoral enhancement, corona enhancement or incomplete capsule by using contrast-enhanced methods such as computed tomography (CT) or dynamic contrast-enhanced magnetic resonance imaging (DCE-MRI) (2-4). However, more quantitative parameters are needed because these predictors provide limited information. Histogram analysis is a straightforward quantitative method that can be used to calculate the differentiation of pixel gray distribution and is helpful for radiologists to make objective diagnoses (5,6). Recent evidence has shown that preoperative MVI predictors were mainly found in the arterial phase, but details on tumor status in the arterial phase of MRI have not been elaborated (7,8). In this study, we aimed to improve the diagnostic value of MVI using histogram features of HCC on the arterial phase images of DCE-MRI using extracellular contrast agent.Materials and Methods
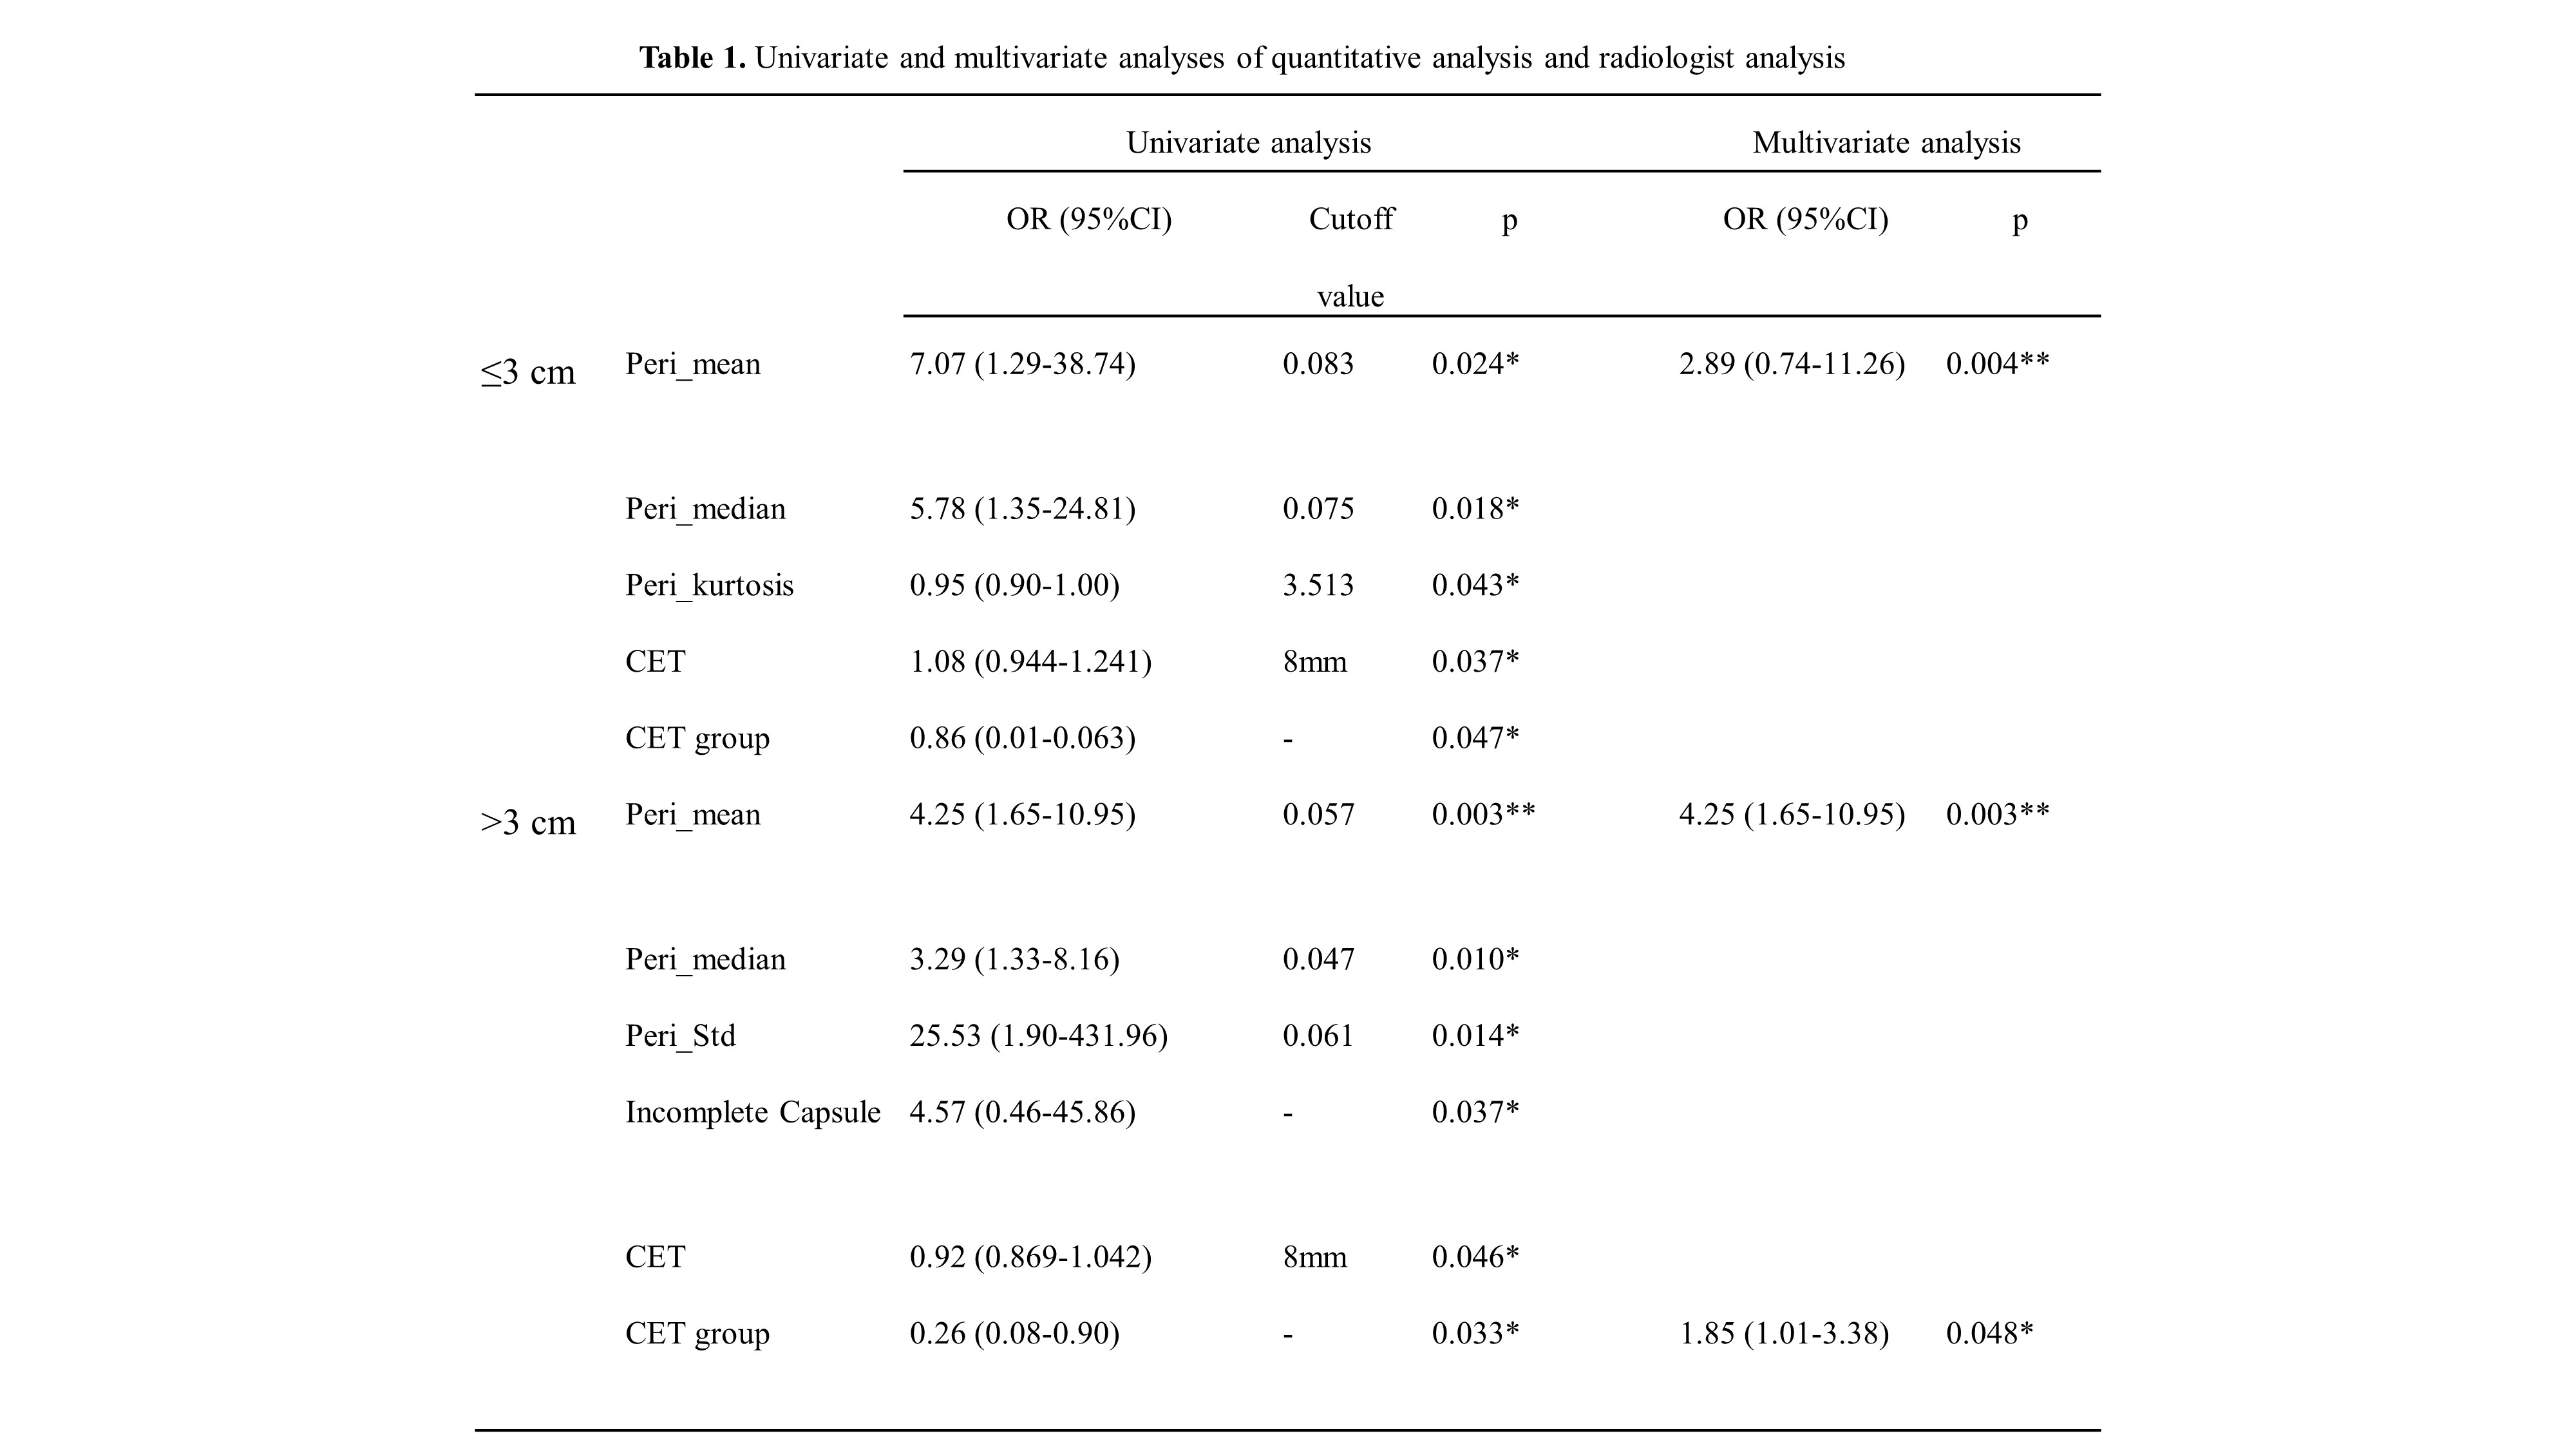
This single-center retrospective study was approved by the Institutional Review Board at our institution and the informed consent requirement was waived. 113 patients with pathologically proven solitary HCC were retrospectively enrolled who underwent preoperative abdominal MRI and received surgical resection were scanned using a 3.0 T MRI system (Ingenia CX, Philips Healthcare, the Netherland) with a 32-channel abdomen coil. The patients were divided into two groups according to the size of lesion: the ≤3 cm (small HCC, sHCC) and the >3 cm. In the meanwhile, based on pathological analysis of surgical specimens, the patients were classified into MVI negative (MVI-) and MVI positive (MVI+) groups. Peritumoral and intratumoral histogram features (mean, median, standard deviation (Std), coefficient of variation (CV), skewness, kurtosis) and radiological features (size, capsule, corona enhancement, corona enhancement thickness (CET), CET group) were acquired on arterial phase (AP) subtraction images. Univariate and multivariate analyses were performed by logistic analysis. Receiver operating characteristic (ROC) curve was constructed to assess diagnosis capability. Subgroup analysis of patients with a visible corona enhancement based on the CET cut-off value was performed.Results
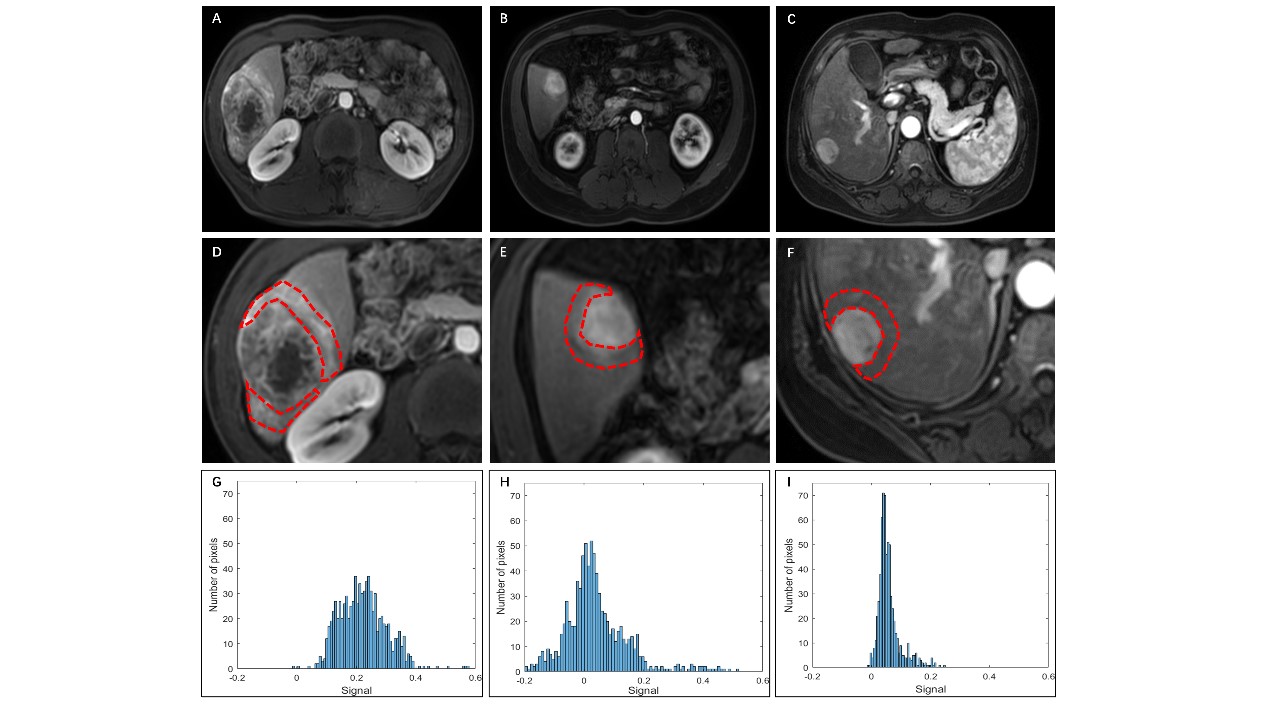
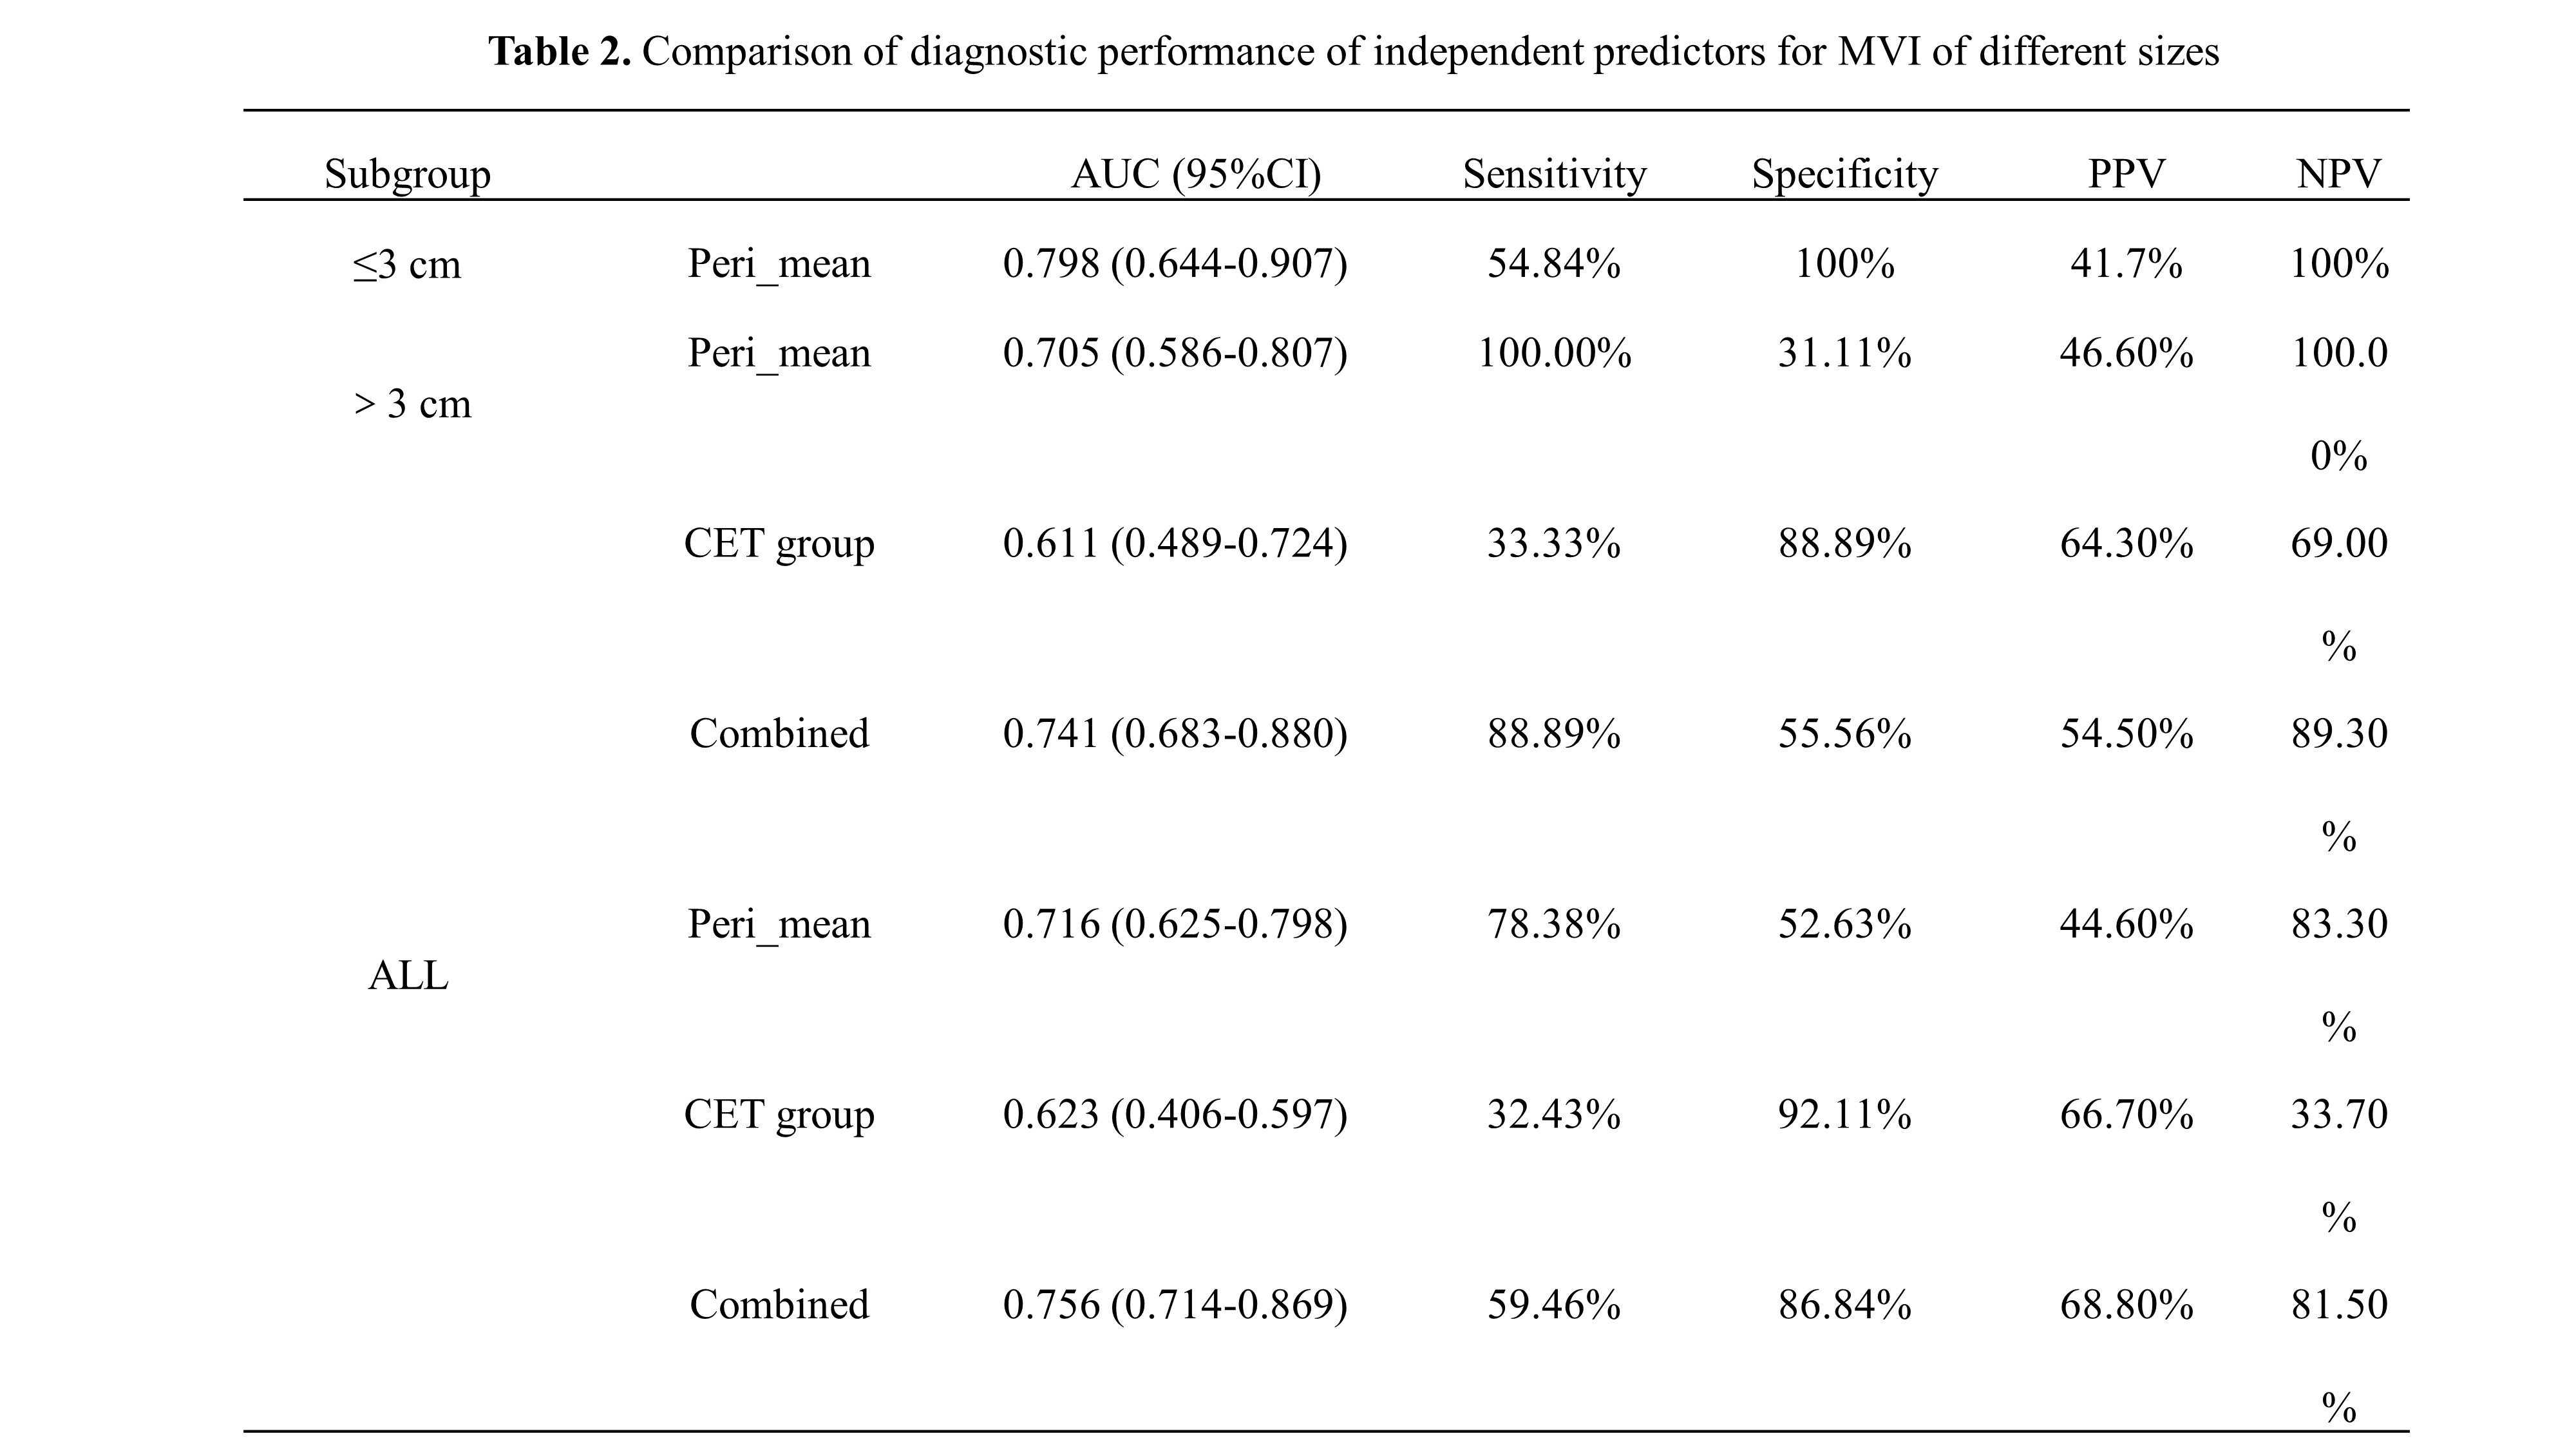
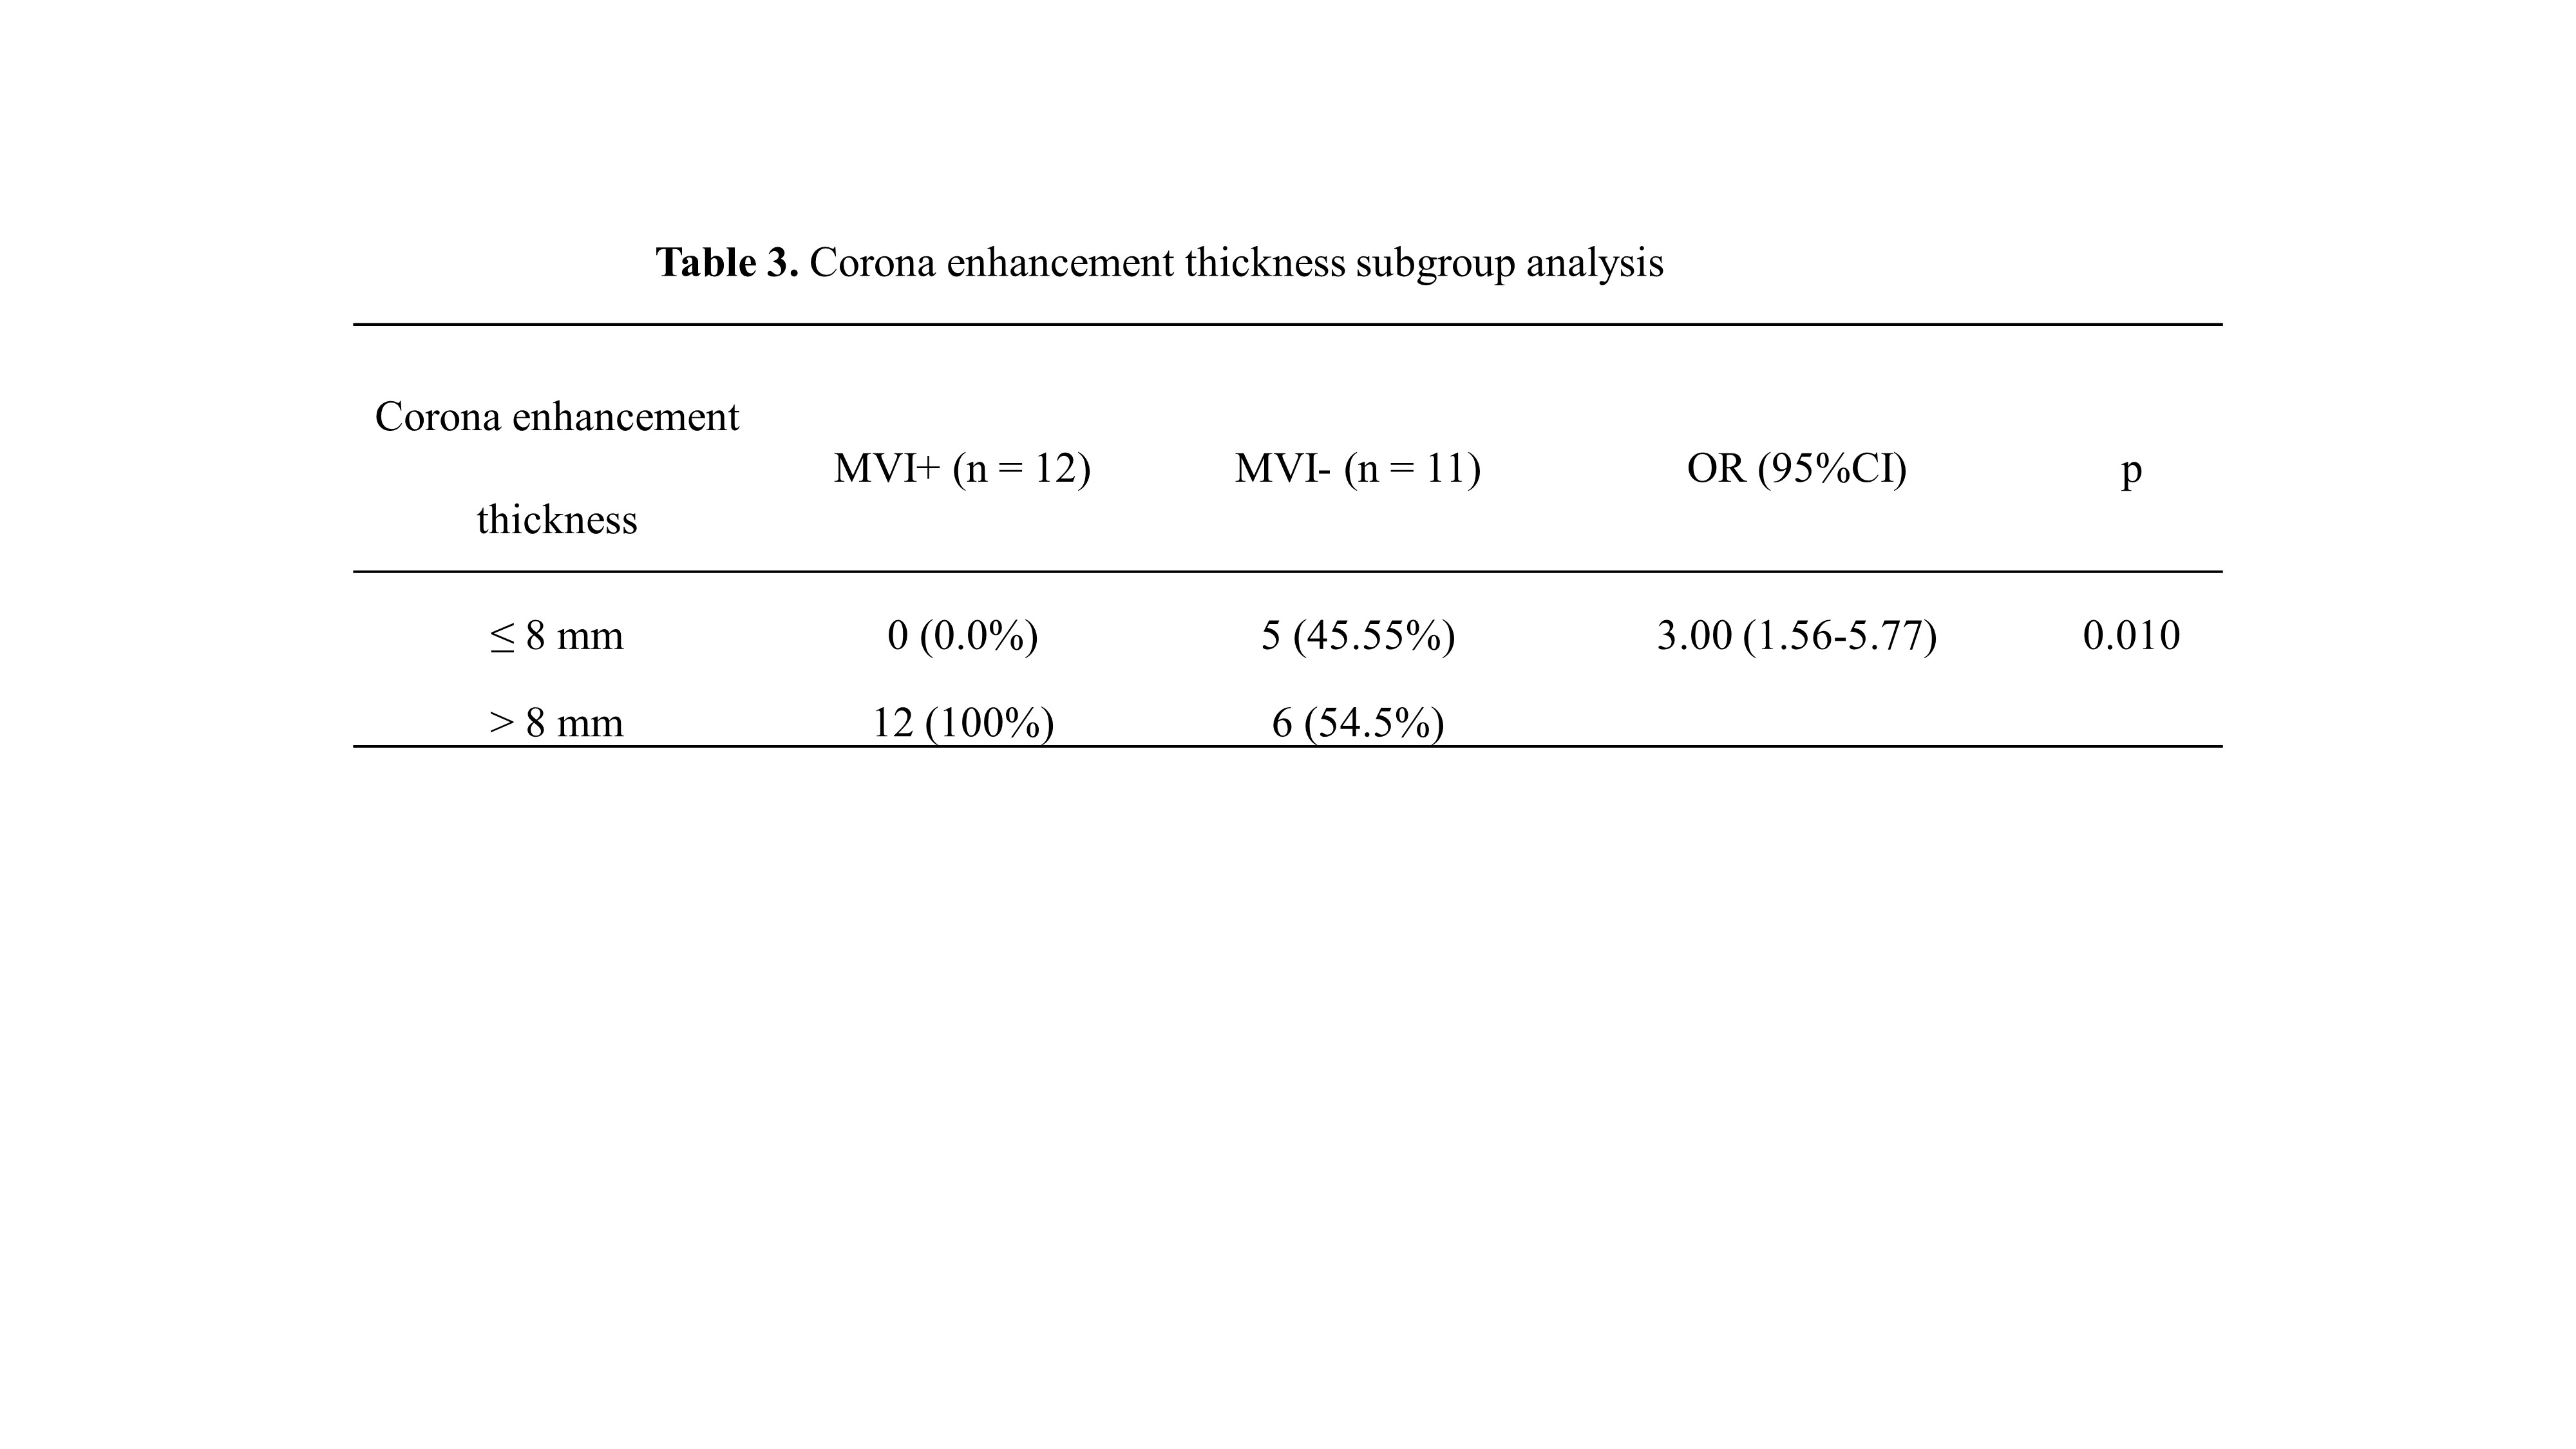
None of the features extracted from the intratumor area were significantly different between the MVI+ and MVI- groups in both cohorts. Histogram defined peritumoral (peri-) mean, median, kurtosis, and radiological features including CET and CET group were associated with MVI in sHCCs. Peri-mean, median, Std and radiological features including incomplete capsule, CET, and CET group were associated with MVI in HCC>3cm (Table 1 and Figure1). In multivariate logistic regression analysis, the CET group and peri-mean were independent predictors for HCC>3cm with an area under the curve (AUC) of 0.741, the sensitivity and specificity were 88.89% and 55.56%respectively. Peri-mean was an independent predictor for sHCC (AUC=0.798, sensitivity =54.84%, specificity =100%) (Table 2 and Figure 2). Subgroup analysis of the corona enhancement using 8 mm as a cut-off value showed 100% sensitivity and 45.45% specificity (Table 3 and Figure 1).Discussion and Conclusion
Our results suggested that the mean degree of the peritumoral enhancement signal was associated with MVI. It may be related to peritumoral hemodynamic changes caused by positive MVI, and the enhancement degree of peritumoral is enhanced, reflecting the increase of peri-mean. Particularly in sHCC, only the peri-mean feature is taken as an independent predictive factor, and the diagnostic efficiency achieved a satisfactory result (AUC: 0.798, sensitivity =54.84%, specificity =100%). Corona enhancement thickness should also be considered rather than whether the corona enhancement is visible for MVI diagnosis in patients with HCC>3 cm.Acknowledgements
Funding: This study has received funding by the 2020 SKY Imaging Research Fund of the Chinese Internatinal Medical Foundatin (project No. Z-2014-07-2003-07); Harbin Medical University Cancer Hospital HaiYan Funds (No. JJZD2020-17). Harbin Medical University Cancer Hospital HaiYan Funds(No. JJQN2021-07) .References
1. Sumie S, Kuromatsu R, Okuda K, Ando E, Takata A, Fukushima N, Watanabe Y, Kojiro M, Sata M. Microvascular invasion in patients with hepatocellular carcinoma and its predictable clinicopathological factors. Ann Surg Oncol 2008;15:1375-82.
2. Lee S, Kim SH, Lee JE, Sinn DH, Park CK. Preoperative gadoxetic acid-enhanced MRI for predicting microvascular invasion in patients with single hepatocellular carcinoma. J Hepatol 2017;67:526-34.
3. Wei H, Jiang H, Liu X, Qin Y, Zheng T, Liu S, Zhang X, Song B. Can LI-RADS imaging features at gadoxetic acid-enhanced MRI predict aggressive features on pathology of single hepatocellular carcinoma. Eur J Radiol 2020;132:109312.
4. Chou CT, Chen RC, Lin WC, Ko CJ, Chen CB, Chen YL. Prediction of microvascular invasion of hepatocellular carcinoma: preoperative CT and histopathologic correlation. AJR Am J Roentgenol 2014;203:W253-9.
5. Tang Z, Yu D, Ni T, Zhao T, Jin Y, Dong E. Quantitative Analysis of Multiphase Contrast-Enhanced CT Images: A Pilot Study of Preoperative Prediction of Fat-Poor Angiomyolipoma and Renal Cell Carcinoma. AJR Am J Roentgenol 2020;214:370-82.
6. Dinapoli N, Barbaro B, Gatta R, Chiloiro G, Casà C, Masciocchi C, Damiani A, Boldrini L, Gambacorta MA, Dezio M, Mattiucci GC, Balducci M, van Soest J, Dekker A, Lambin P, Fiorino C, Sini C, De Cobelli F, Di Muzio N, Gumina C, Passoni P, Manfredi R, Valentini V. Magnetic Resonance, Vendor-independent, Intensity Histogram Analysis Predicting Pathologic Complete Response After Radiochemotherapy of Rectal Cancer. Int J Radiat Oncol Biol Phys 2018;102:765-74.
7. Huang YQ, Liang HY, Yang ZX, Ding Y, Zeng MS, Rao SX. Value of MR histogram analyses for prediction of microvascular invasion of hepatocellular carcinoma. Medicine (Baltimore) 2016;95:e4034.
8. Li H, Zhang J, Zheng Z, Guo Y, Chen M, Xie C, Zhang Z, Mei Y, Feng Y, Xu Y. Preoperative histogram analysis of intravoxel incoherent motion (IVIM) for predicting microvascular invasion in patients with single hepatocellular carcinoma. Eur J Radiol 2018;105:65-71.
Figures