3751
Blood Oxygen Level-Dependent Imaging of Lower Limbs: Perfusion and Clinical Assessment of Peripheral Artery Disease1Vascular Surgery, Peking Union Medical College Hospital, Beijing, China, 2Radiology, Peking Union Medical College Hospital, Beijing, China, 3Siemens Healthineers Ltd., Beijing, China, 4Advanced Therapies Collaboration, Siemens Healthineers Ltd., Beijing, China
Synopsis
This study used blood oxygen level-dependent (BOLD) MRI to assess the hemodynamics of the lower limbs for patients with peripheral artery disease. We obtained dynamic change of BOLD T2* with high temporal and spatial resolution in reactive hyperemia experiment and found good correlation between BOLD parameters and clinical walking performance, which verified the significance of perfusion measurement for clinical assessment.
Introduction
Peripheral artery disease (PAD) is a common vascular disease caused by stenosis or occlusion of blood vessels due to atherosclerosis. In patients with PAD, the reduced blood supply to the lower extremities reduces muscle strength and walking ability, and may lead to limb-threatening complications.[1] Therefore, assessing lower extremity hemodynamics is important and was recently emphasized by the American Heart Association (AHA).[2] Reactive hyperemia experiments, measured by blood oxygen level-dependent (BOLD) magnetic resonance imaging (MRI), permits the evaluation of changes in blood flow and oxygenation non-invasively and has tentatively been used in perfusion assessment of skeletal muscle in PAD.[3-5] However, there is little research in this area, and the value of perfusion assessment for clinical diagnosis is unclear. Therefore, this study aims to: 1) verify the feasibility of using BOLD MRI to measure perfusion in the lower limb in PAD patients and 2) explore the relationship between perfusion measurements and clinical features.Methods
Thirteen patients (69.1 ± 7.1 years old, ten males) diagnosed with PAD by typical symptoms and atherosclerosis on computed tomography angiography (CTA) were recruited for this study. Informed consent was obtained. All subjects underwent clinical examinations, including ankle brachial index (ABI), walking performance measurement [6, 7], and BOLD. The BOLD imaging consisted of three phases: one-minute resting phase, followed by a five-minute cuff phase under 250 mmHg pressure of an inflatable thigh cuff, and finally a four-minute recovery phase with pressure released. The BOLD imaging was performed on a 3T scanner (MAGNETOM Vida, Siemens Healthcare, Erlangen, Germany), equipped with an 18-channel Flex coil. BOLD imaging was acquired with a single slice multi-echo gradient echo sequence, sampled at 3.3 seconds per measurement, with TR 55 ms, and nine echoes equally spaced from 4.0 to 40.0 ms. The field of view was 16 x 15 cm2, and the matrix was 120 x 96. The BOLD T2* map of each measurement was fitted from the nine echoes and then non-rigidly registered to the first phase with the first echo of each measurement as the reference. The masks of muscle groups were hand-drawn on ITK-SNAP from the first echo BOLD image while avoiding major arteries. The T2* curve was normalized by the mean T2* during the resting phase to avoid the T2* heterogeneity induced by inhomogeneous B0 field. BOLD parameters, including minimum ischemia value (MIV), hyperemia peak value (HPV), time to half ischemia minimum (THIM), time to peak (TTP), and gradient (Grad) during reactive hyperemia (exemplified in Fig. 1e) were measured and reported as mean ± SD. Analysis of variance (ANOVA) was used to determine differences between muscle groups. Unpaired t-test and Pearson correlation was used in reporting the relationship between clinical features and BOLD imaging parameters. Data were analyzed with SPSS version 25.0 (SPSS, Chicago, Illinois). Statistical significance is defined as p values <0.05.Results
The clinical characteristics of all the patients are described in Table 1. The walking performance, evaluated by six-minute walk and short physical performance battery (SPPB), is listed in the right column [7]. Longer distances or higher SPPB scores indicate better walking ability. Rutherford classification of included patients was mostly at grade 2 ~ 4, and patients with the same Rutherford classification showed different performances on functional measurement. BOLD results were shown in Table 2. In general, the changes in the soleus and medial gastrocnemius were greater, though the differences lacked statistical significance. Figure 2 shows the relationship between the clinical characteristics and BOLD parameters (mean value of all muscle groups of interest). Patients with an SPPB score of 0 ~ 8 had a significantly lower MIV than those with an SPPB score of 9 ~ 12 (p<0.05). Moreover, MIV was positively correlated with a six-min walking distance, indicating that subjects with larger MIV had more tolerance and better walking performance. We also found that ABI was positively correlated with Grad and negatively correlated with TTP (p<0.05). Interestingly, in three subjects we observed the plump of T2* immediately following the release of pressure in some muscle groups, particularly in the soleus (Figure 3), possibly due to the increased blood volume under hyperemia conditions and the pouring in of deoxygenated blood right after the cuff was released. This phenomenon has not been reported previously.Discussion
Previous studies focused minimally on the relationship between perfusion and clinical function, and a few explored the relationship between ABI and perfusion parameters. However, whether perfusion, rather than stenosis, affects clinical function and outcome was unclear. This study included the six-minute walking and SPPB score as the clinical metrics and showed the feasibility of using BOLD MRI to measure perfusion in the lower limb in PAD patients.Conclusion
In conclusion, perfusion images of lower limbs were collected by BOLD-MRI in PAD patients with high spatial and temporal resolution. The results of BOLD parameters were consistent with the walking performance, which is important for perfusion assessment to guide clinical diagnosis.Acknowledgements
Not applicable.References
1. Morley RL, Sharma A, Horsch AD, et al. Peripheral artery disease. Bmj, 2018,360:j5842.2. Misra S, Shishehbor MH, Takahashi EA, et al. Perfusion Assessment in Critical Limb Ischemia: Principles for Understanding and the Development of Evidence and Evaluation of Devices: A Scientific Statement From the American Heart Association. Circulation, 2019,140(12):e657-e672.
3. Jacobi B, Bongartz G, Partovi S, et al. Skeletal muscle BOLD MRI: from underlying physiological concepts to its usefulness in clinical conditions. J Magn Reson Imaging, 2012,35(6):1253-65.
4. Bajwa A, Wesolowski R, Patel A, et al. Blood Oxygenation Level-Dependent CMR-Derived Measures in Critical Limb Ischemia and Changes With Revascularization. J Am Coll Cardiol, 2016,67(4):420-431.
5. Törngren K, Eriksson S, Arvidsson J, et al. A Reperfusion BOLD-MRI Tissue Perfusion Protocol Reliably Differentiate Patients with Peripheral Arterial Occlusive Disease from Healthy Controls. J Clin Med, 2021,10(16):3643.
6. McDermott MM, Tian L, Liu K, et al. Prognostic value of functional performance for mortality in patients with peripheral artery disease. J Am Coll Cardiol, 2008,51(15):1482-9.
7. Guralnik JM, Ferrucci L, Simonsick EM, et al. Lower-extremity function in persons over the age of 70 years as a predictor of subsequent disability. N Engl J Med, 1995,332(9):556-61.
Figures
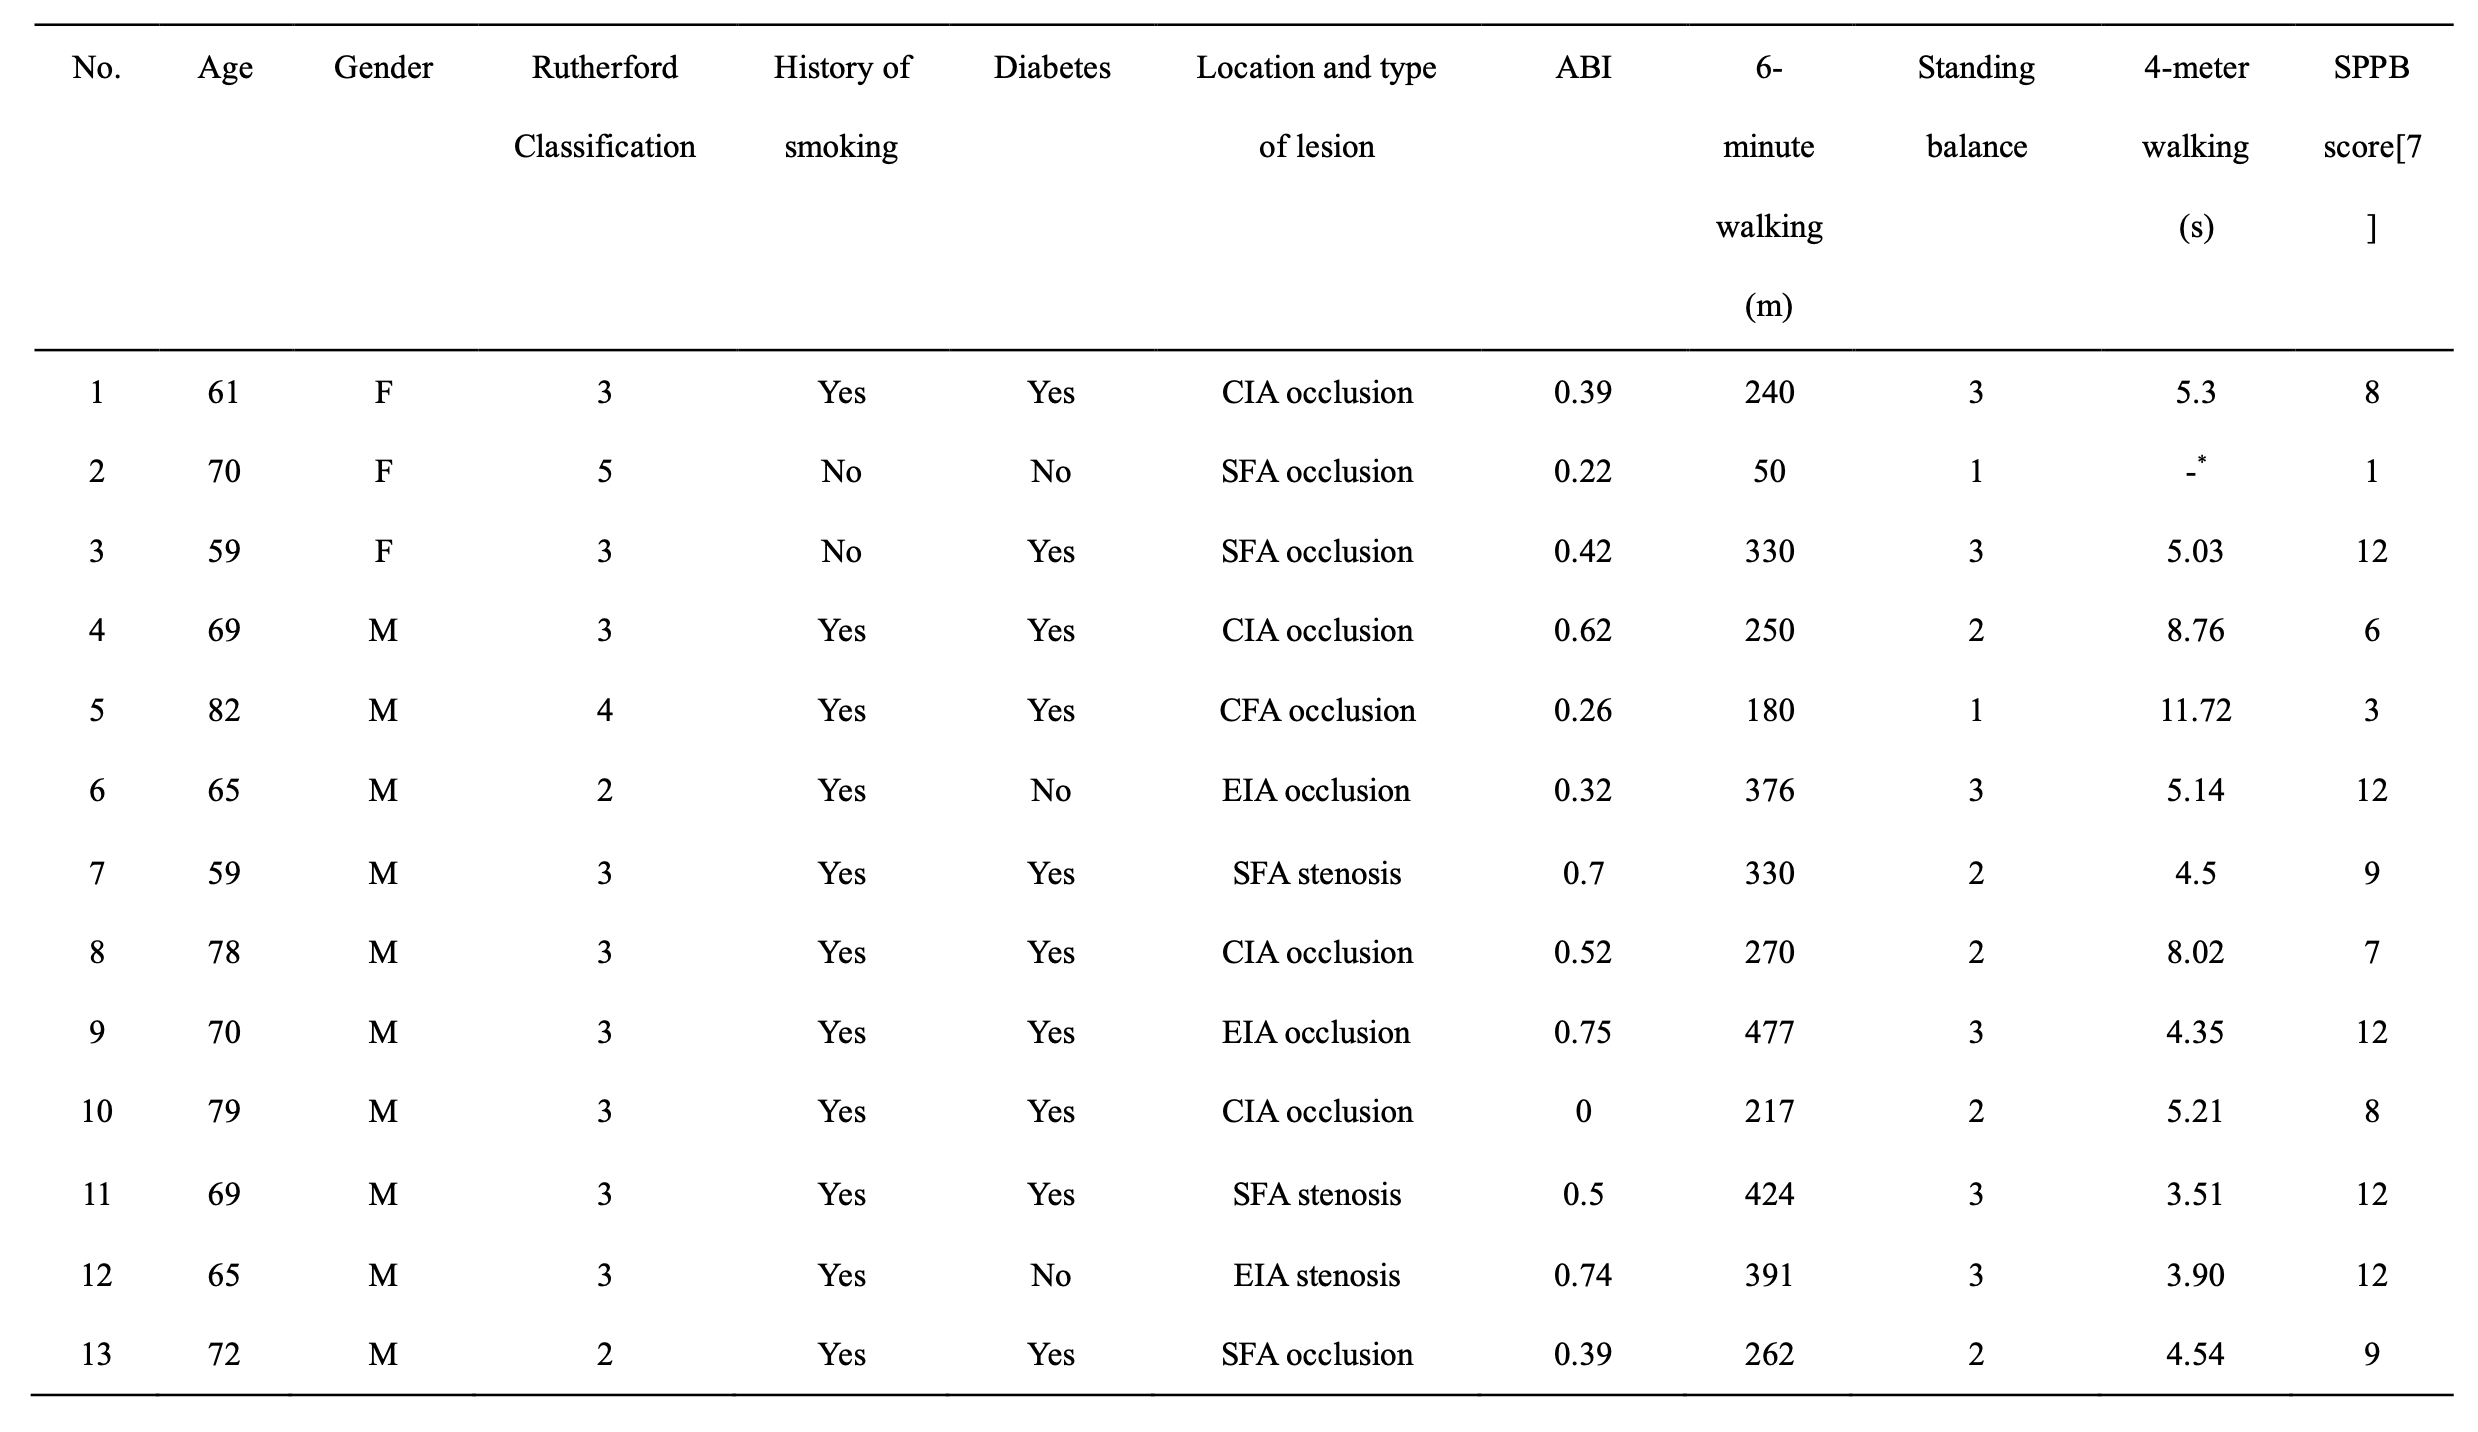
Table 1. Characteristics of the 13 included patients.
ABI, ankle brachial index; CIA, Common iliac artery; EIA, External iliac artery; SFA, Superficial femoral artery; SPPB, Short Physical Performance Battery;
* Subject 2 could barely walk on her own.
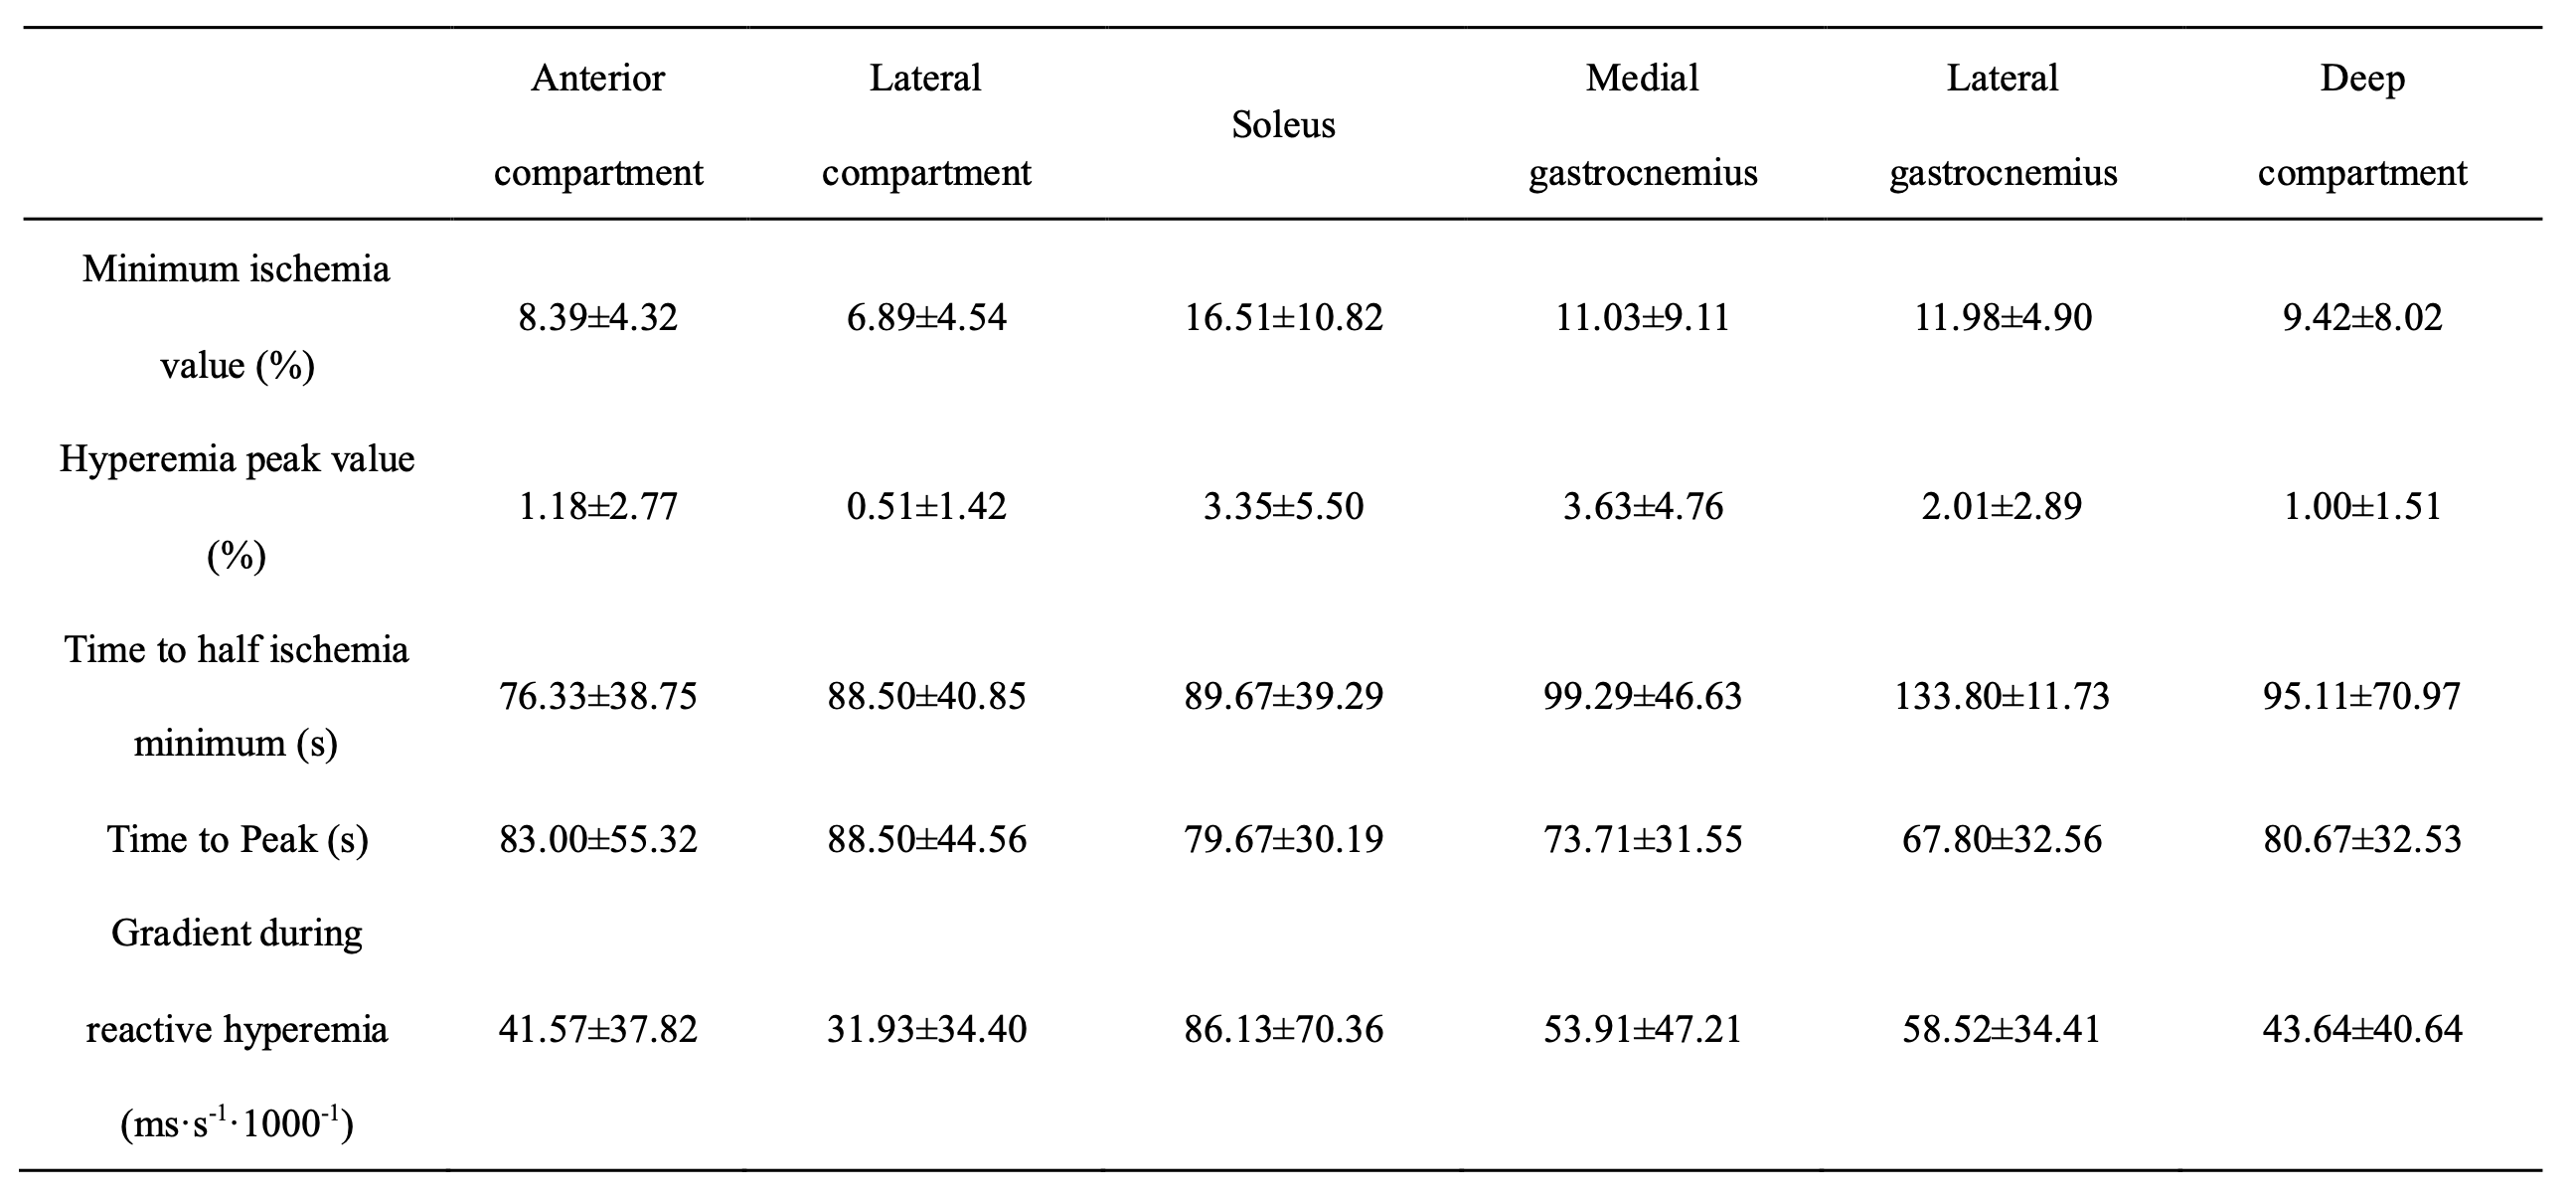
Table 2. BOLD response in different regions of interest.
Values are shown as mean ± SD.
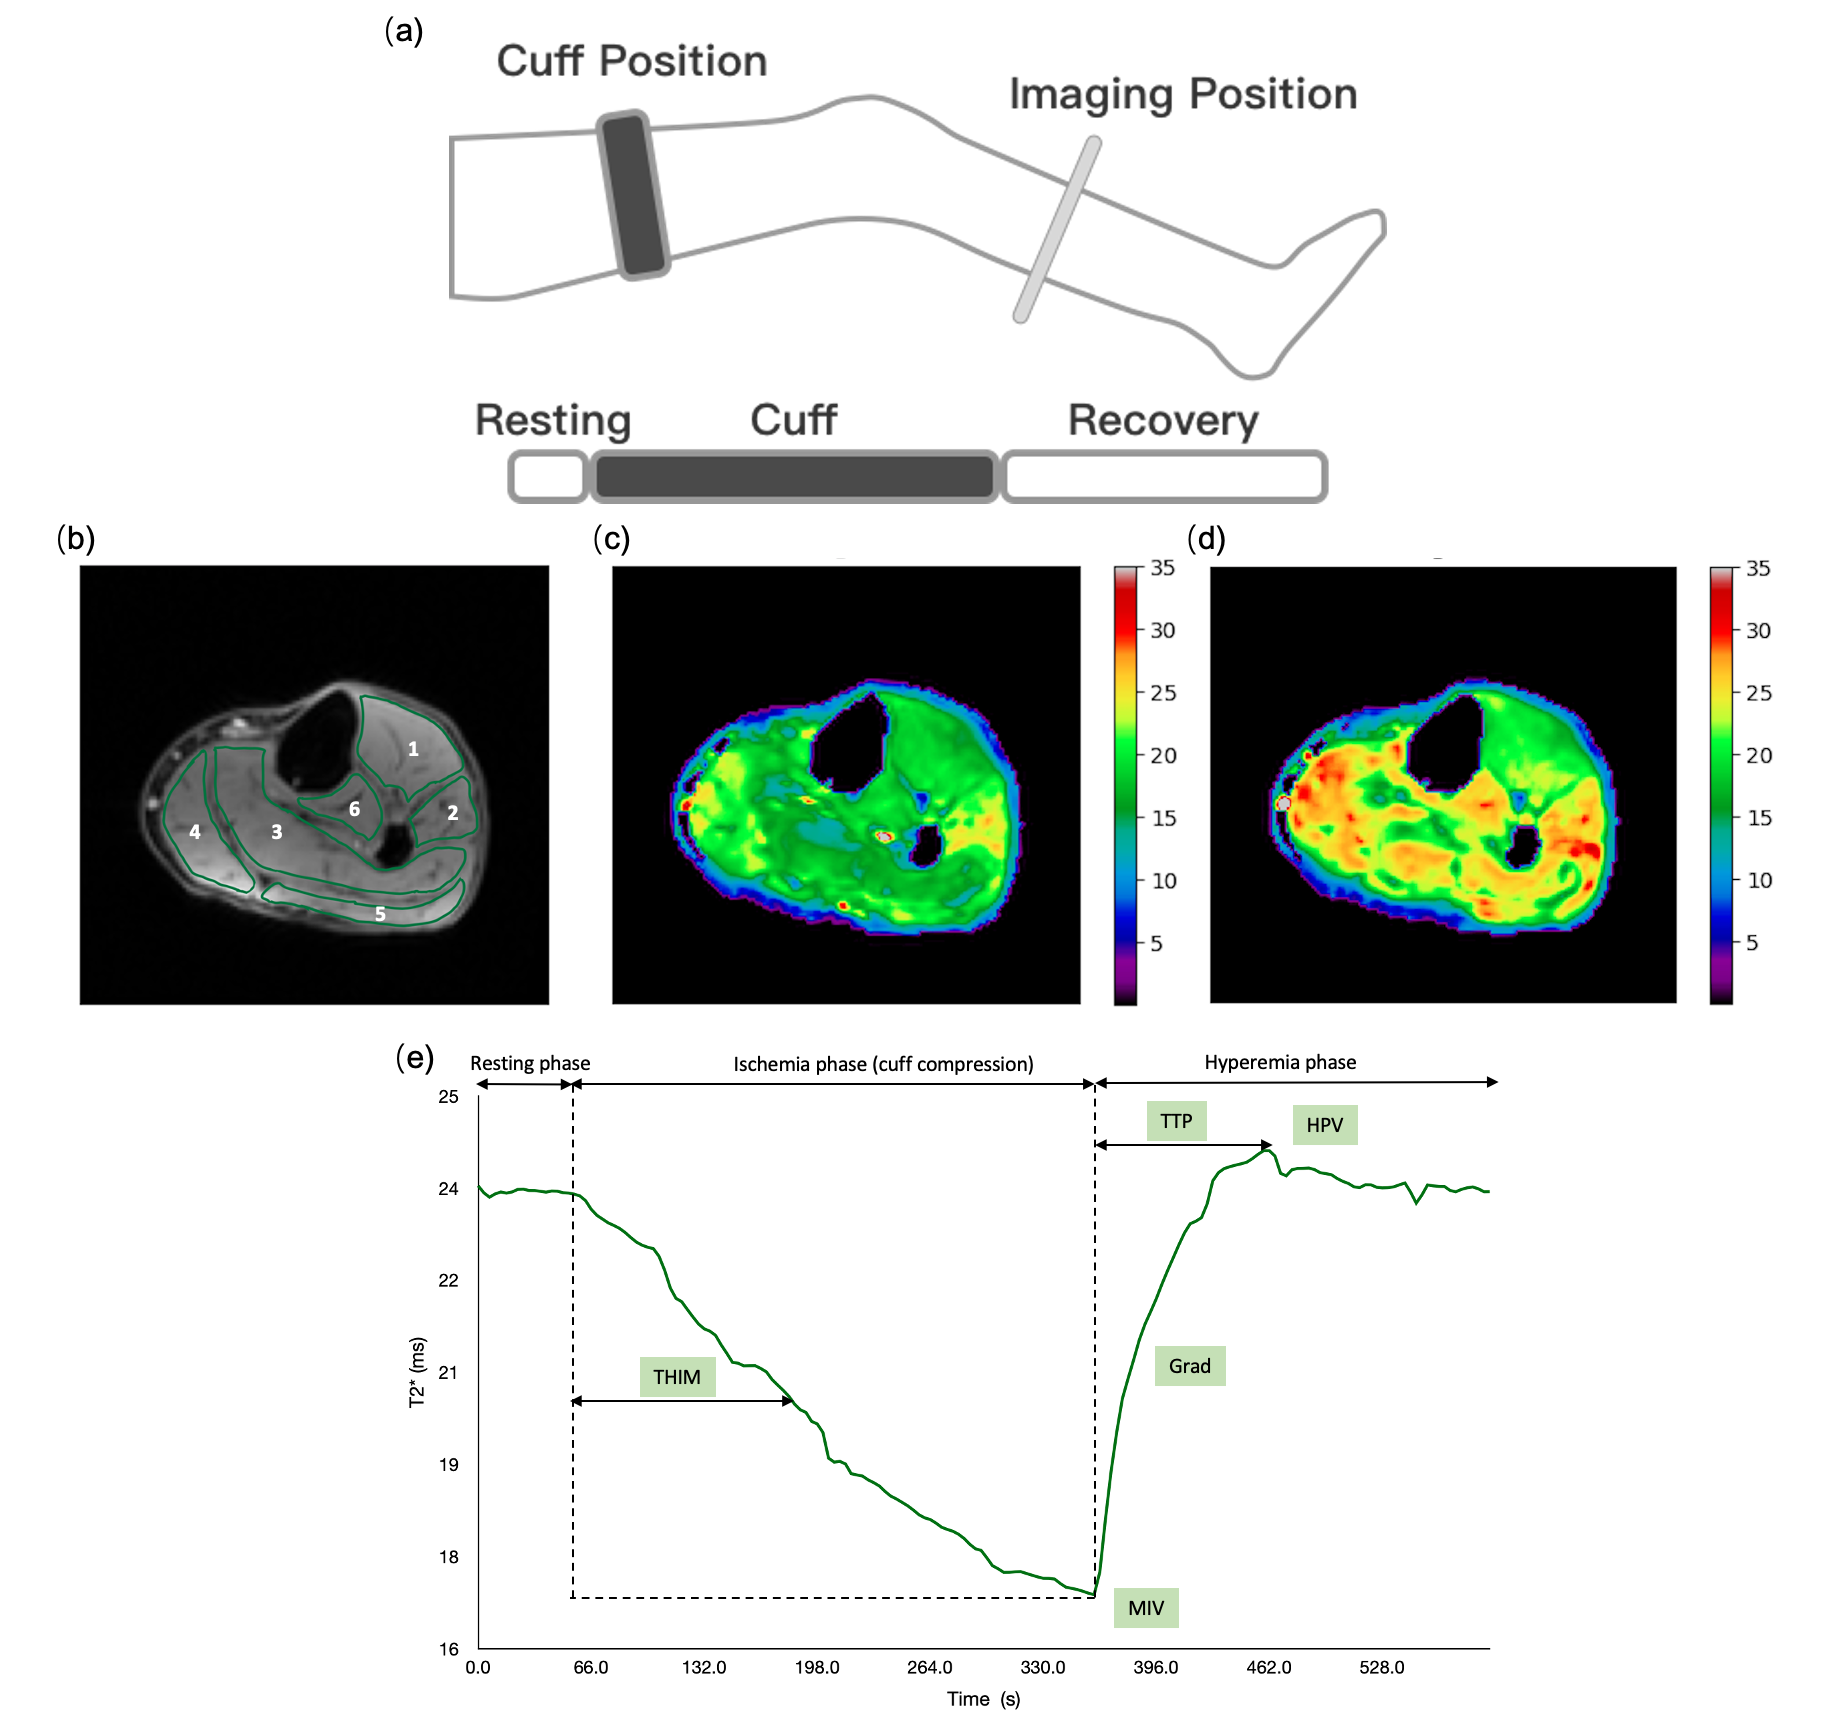
Figure 1. Perfusion images and curve by BOLD MRI.
(a) Reactive hyperemia paradigm and protocol (b)Regions of interest in calf muscles: 1) anterior compartment; 2) lateral compartment; 3) soleus; 4) medial gastrocnemius; 5) lateral gastrocnemius; 6) deep compartment. Experiment comprised a resting phase (1 min), cuff phase (5 min), and recovery phase (4 min). T2* perfusion maps shown at (c) ischemic phase and (d) hyperemic phase. (e) T2*-time curve over the experiment. BOLD parameters: MIV, HPV, THIM, TTP, Grad
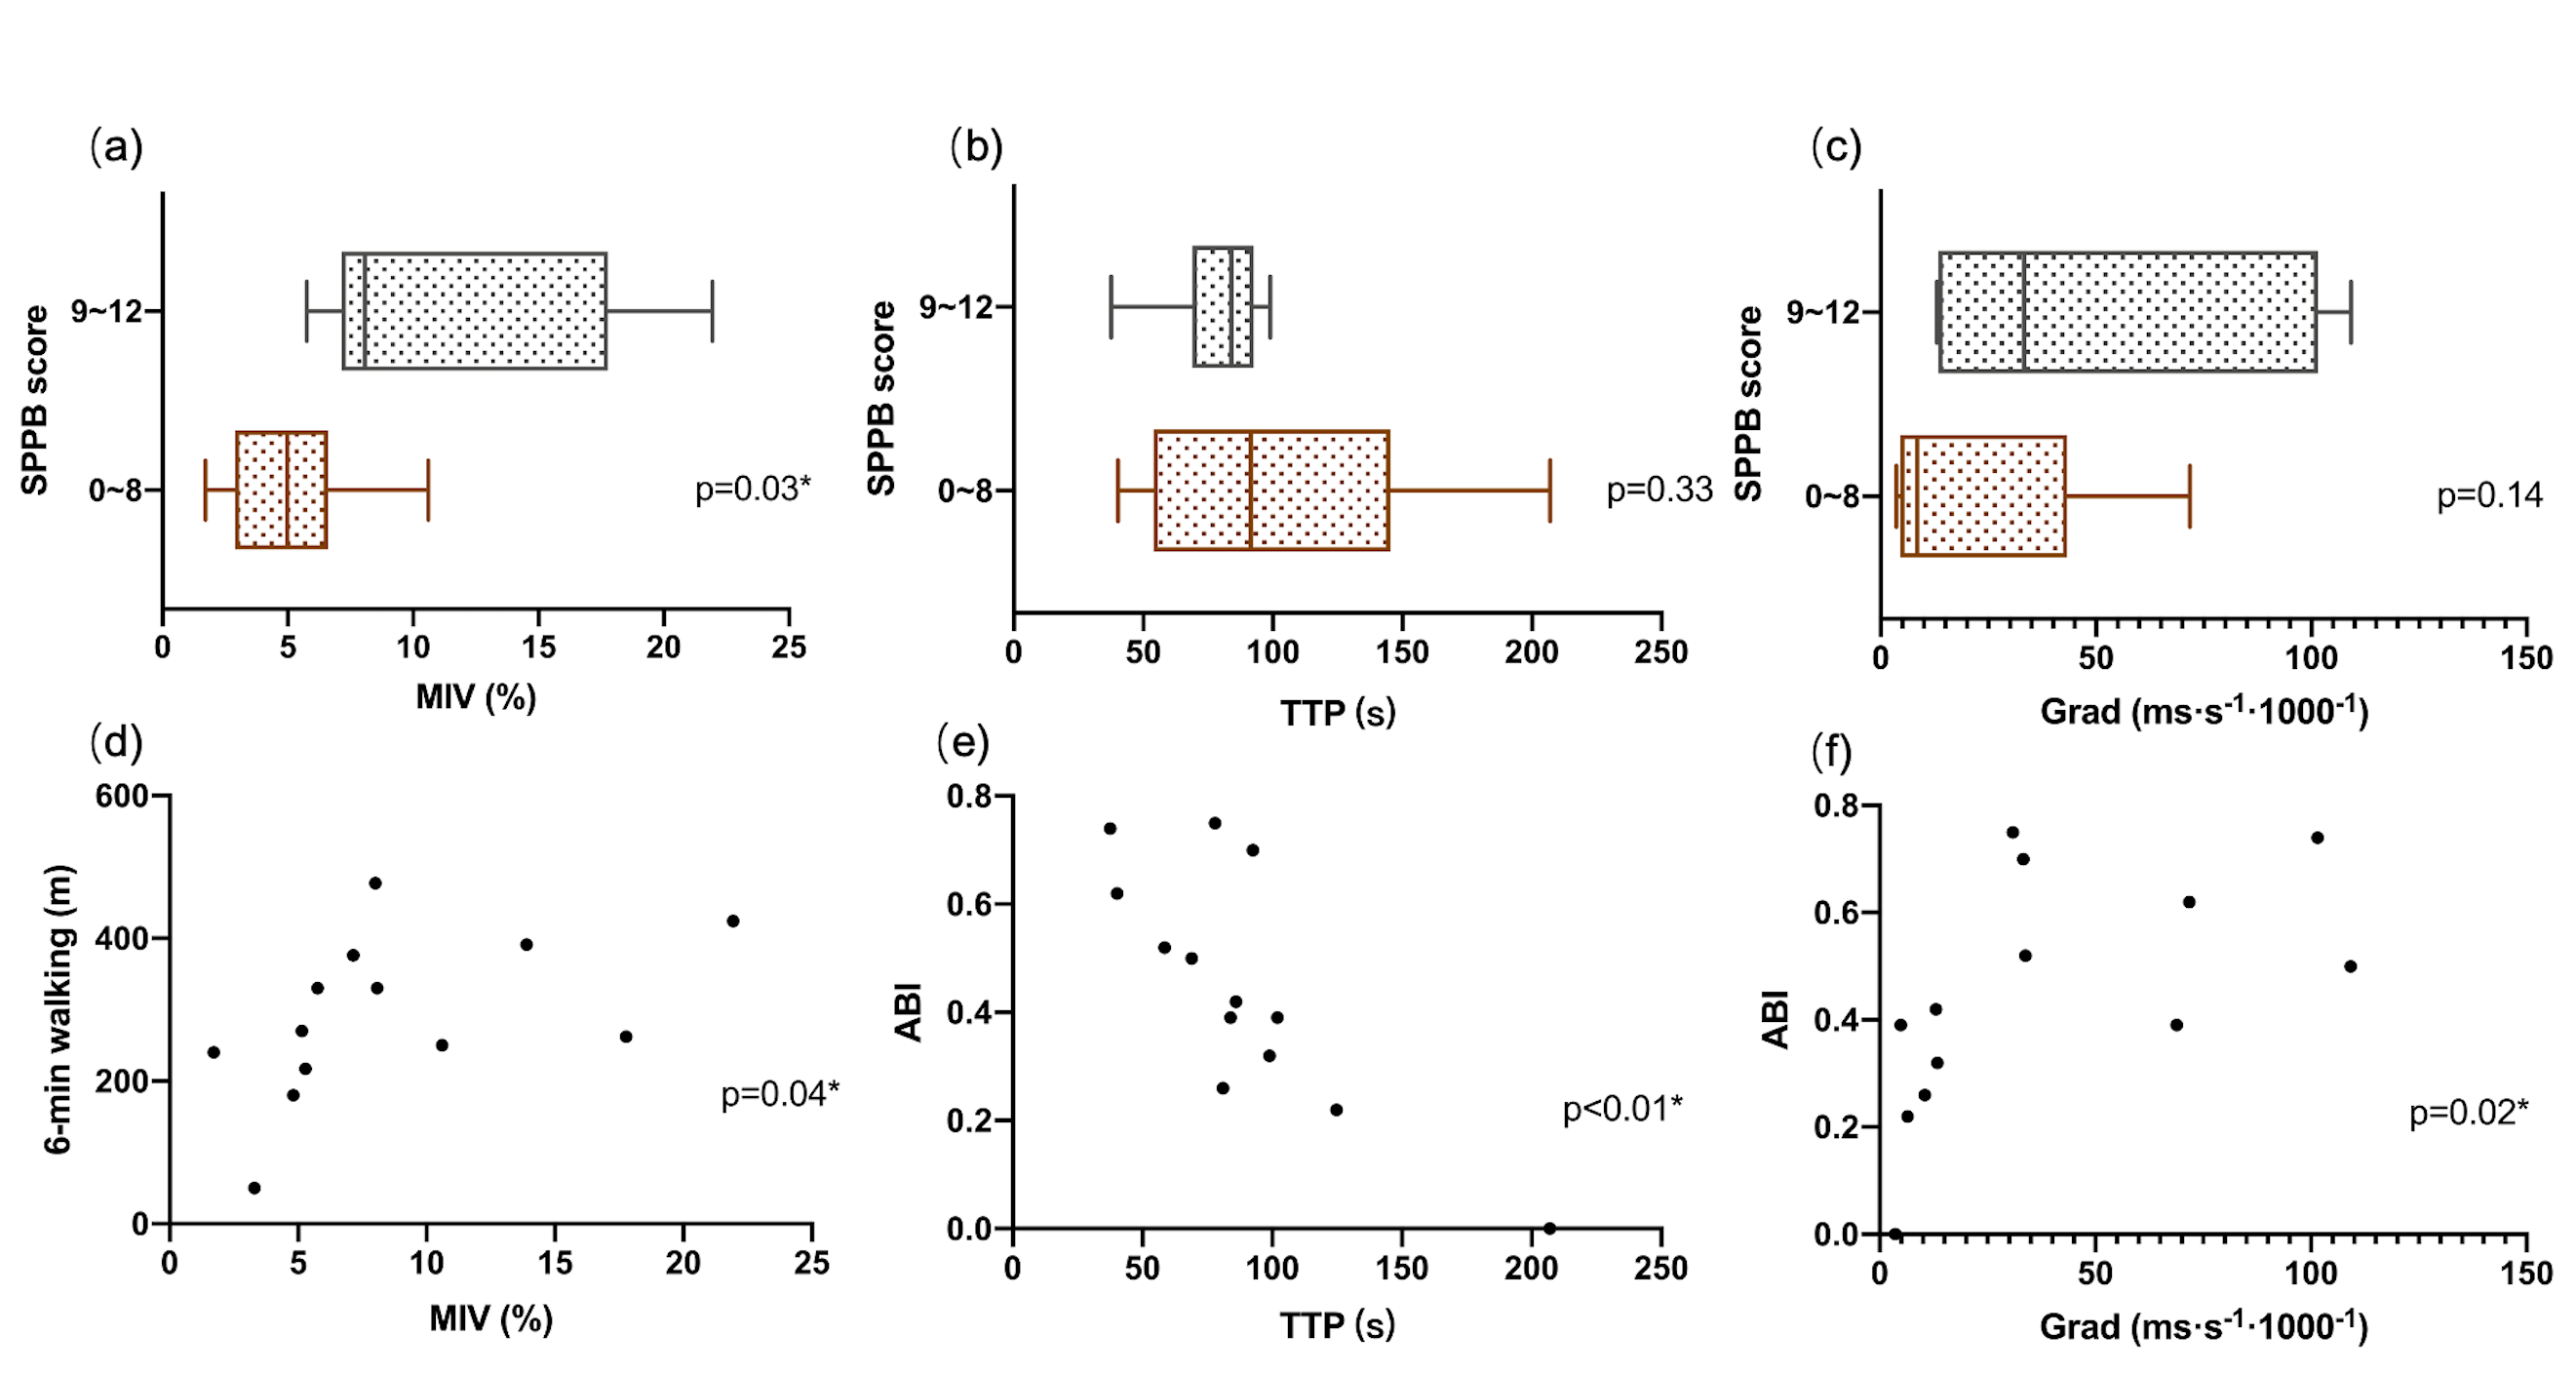
Figure 2 Relationship between BOLD parameters and clinical assessment.
MIV (a) was significantly lower in the group with SPPB score of 0~8 (brown) than in group with SPPB score of 9~12 (grey). The differences in TTP (b) and Grad (c) between groups were not significant. Correlation analysis was performed to study the relationship between perfusion parameters and 6-min walking as well as ABI. Positive correlation was found between MIV and 6-min walking (d), and Grad and ABI (f), whereas TTP and ABI showed a negative correlation (e).
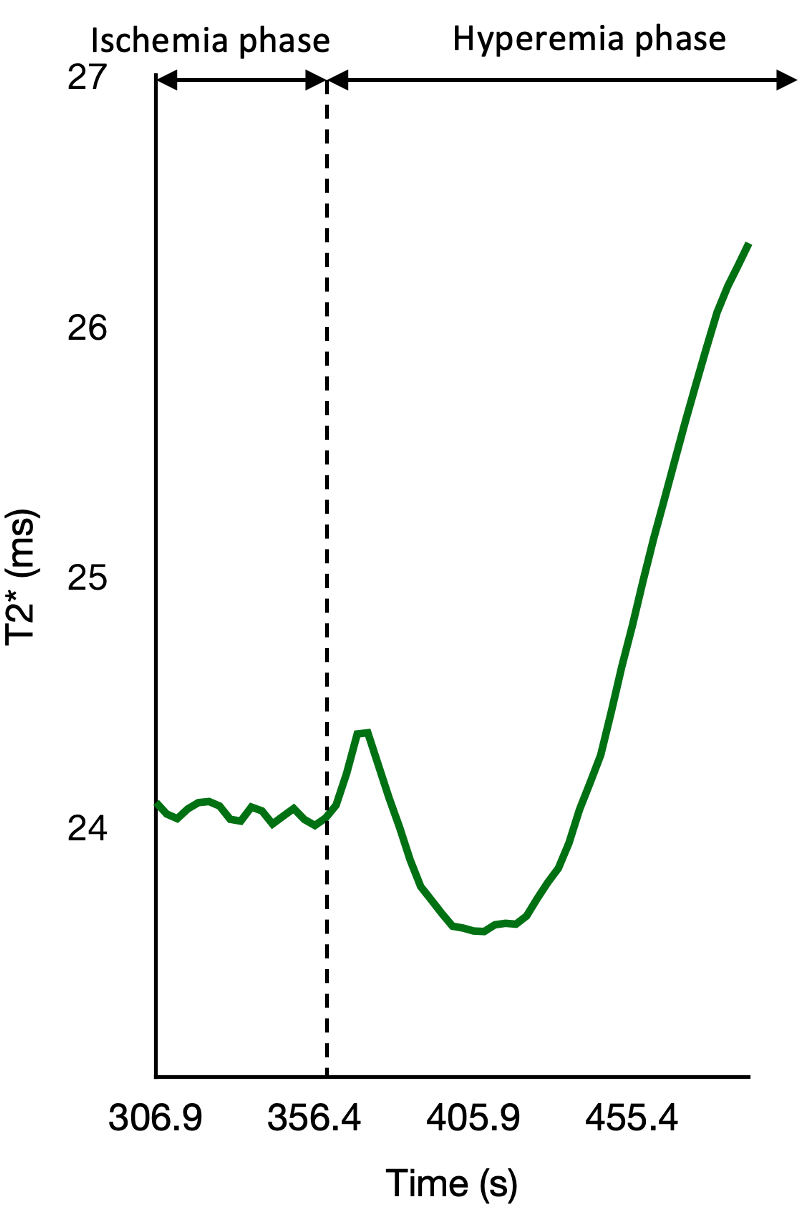
Figure 3 A Case of T2* plump after releasing the cuff
The figure is part of T2*-time curve before and after releasing the cuff. As far as we know, it is the first reported T2* plump measured by BOLD during reactive hyperemia phase.