3748
Explainable and Quantitative LI-RADS Automated Grading System for Hepatocellular Carcinoma based on Dynamic Contrast-Enhanced MRI1Human Phenome Institute, Fudan University, Shanghai, China, 2Department of Radiology, Zhongshan Hospital, Fudan University, Shanghai, China, 3Shanghai Institute of Medical Imaging, Shanghai, China, 4Institute of Science and Technology for Brain-Inspired Intelligence, Fudan University, Shanghai, China, 5Philips Healthcare, Shanghai, China, 6Cancer Center, Zhongshan Hospital, Fudan University, Shanghai, China
Synopsis
The judgment of the three major features of LI-RADS by radiologists is subjective and time-consuming. We proposed an explainable and quantitative algorithm based on DCE MRI to recognize the three major features and then get LI-RADS grades together with tumor diameter. The AUC is 0.96, 0.92, 0.70 in the validation set and 0.98, 0.90, 0.76 in the testing set for arterial phase hyper-enhancement (APHE), washout, and capsule. The overall accuracy of LI-RADS grades is 0.68 and 0.71 for the validation and testing set. The developed automatic LI-RADS grading system can provide explainable results for HCC diagnosis with high efficiency.
Introduction
Liver Imaging Reporting and Data System (LI-RADS) has been widely used for hepatocellular carcinoma (HCC) diagnosis and staging1. Three major features of the liver tumor, including non-rim APHE, non-peripheral washout and enhancing capsule, are of great importance for LI-RADS grading1-3. However, the judgment of these features by radiologists is subjective and time-consuming. Several algorithms have been proposed for automatic LI-RADS grading4-8. Some of these algorithms did not use the three major features, instead they trained an end-to-end deep learning or machine learning models using MRI images4-7. Sheng et al. trained three deep learning classification models to judge if the three major features exist8. The accuracy for LI-RADS grading is very low for external validation datasets4,8. Our study aims to improve the recognition accuracy and generalizability of the three major features to ameliorate the accuracy of LI-RADS grade category classification.Methods
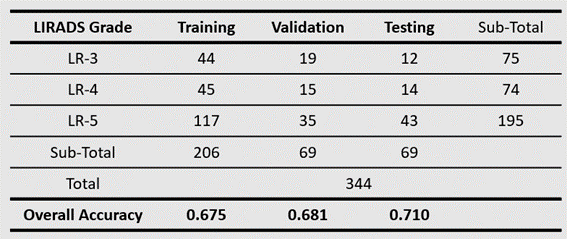
Image AcquisitionAll images were acquired with Dynamic Enhanced Contrast (DCE) MRI from Zhongshan Hospital, Fudan University, including pre-contrast (Pre), arterial phase (AP), portal venous phase (PVP), and delayed phase (DP). The total number of patients analyzed is 344. Table 1 shows positive (with the feature) and negative (without the feature) sample numbers of the three major features. Table 2 shows tumor numbers of LI-RADS grade LR-3, LR-4 and LR-5. The dataset was randomly split into three groups (60% training, 20% validation and 20% testing).
Image Analysis
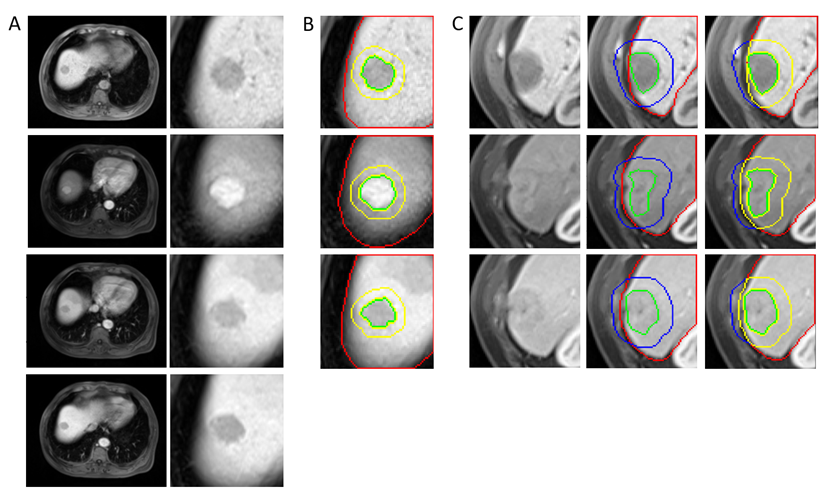
The tumors are delineated and graded (three major features and final LI-RADS grade) by three radiologists independently. Our image processing algorithm follows LI-RADS guidelines as well as clinical diagnostic experience. Three classifiers are developed for automatic judgment of the major features and generating the final LI-RADS grade. To eliminate interference in the extrahepatic region, we apply 3D U-net9 for automatic segmentation of the liver. After image processing, Scores of APHE, Washout, and Capsule are calculated. During the training process, the optimal threshold of theses scores is decided by Youden Index based on the ROC (Receiver Operating Characteristic) curve. During the validation and testing phase, Scores larger than the optimal threshold are classified as ‘with APHE’, ‘with Washout’ or ‘with Capsule’.
(1) Non-rim APHE Classifier
The intensity ratio of tumor to liver parenchyma in AP and Pre is calculated as ‘Score AP’ and ‘Score Pre’.
$$Score\ AP= \frac{{{I_t}_A}_P}{{{I_l}_A}_P}\tag{1}$$
$$Score\ Pre= \frac{{{{I_t}_P}_r}_e}{{{{I_l}_P}_r}_e}\tag{2}$$
Where $$${{{I_t}_A}_P}$$$, $$${{{I_l}_A}_P}$$$, $$${{{{I_t}_P}_r}_e}$$$ and $$${{{{I_l}_P}_r}_e}$$$ are mean intensity of tumor in AP, liver parenchyma in AP, tumor in Pre, and liver parenchyma in Pre. Considering the intensity variation of liver parenchyma between different phases, Score APHE is defined as:
$$Score\ APHE = \frac{ Score\ AP}{Score\ Pre} \tag{3}$$
(2) Non-peripheral Washout Classifier
Firstly, AP and Pre are analyzed together to decide if ‘Wash In’ exists. If ‘Wash In’ exists, consider PVP and AP together to judge if ‘Washout’ exists. We consider that 'wash in' exists if both formulas (4) and (5) are satisfied, here 0.95 is used as the empirical threshold.
$${{{I_t}_A}_P} > {{{{I_t}_P}_r}_e}\tag{4}$$
$$Score\ AP>0.95\tag{5}$$
The Score Washout is defined as Formula (6), where $$${{{I_t}_P}_V}_P$$$ and $$${{{I_l}_P}_V}_P$$$ are mean intensity of tumor in PVP and liver parenchyma in PVP.
$$Score\ Washout= \frac{{{{I_l}_P}_V}_P}{{{{I_t}_P}_V}_P}\tag{6}$$
(3) Enhancing Capsule Classifier
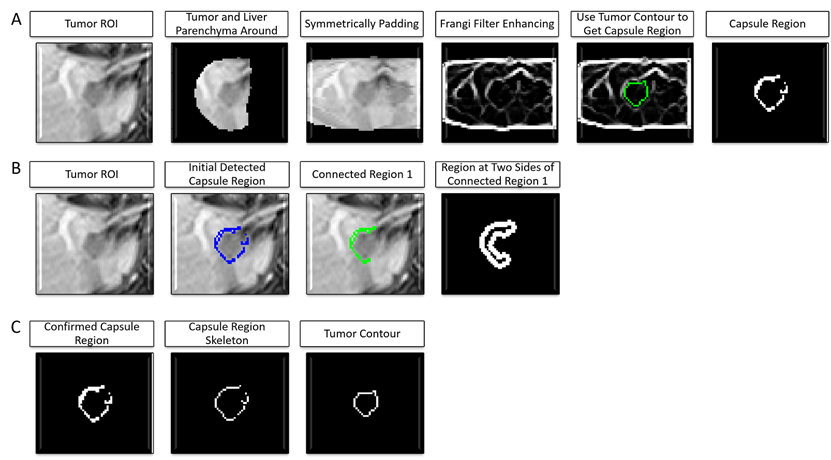
Figure 2 shows the workflow of capsule detection. First, Frangi filter10-11 is applied to enhance the capsule to obtain candidate capsule regions. Then, each candidate capsule region is considered to be a true capsule if the mean intensity is greater than that of the regions on either side of it. Finally, get skeleton of the true capsule regions, and calculate Score Capsule as formulas (7) to (13).
$$Score\ Capsule=max(Score\ Capsule\ PVP,Score\ Capsule\ DP)\tag{7}$$
$$Score\ Capsule\ PVP= \frac{{\textstyle \sum_{1}^{{{{n_P}_V}_P}}} {{{{l_i}_P}_V}_P}*min({{{{{R_1}_P}_V}_P}_i}, {{{{{R_2}_P}_V}_P}_i})}{L}\tag{8}$$
$${{{{R_1}_P}_V}_P}_i= \frac{{{{{{{I_t}_c}_r}_P}_V}_P}_i}{{{{{{{I_s}_r}_1}_P}_V}_P}_i} \tag{9}$$
$${{{{R_2}_P}_V}_P}_i= \frac{{{{{{{I_t}_c}_r}_P}_V}_P}_i}{{{{{{{I_s}_r}_2}_P}_V}_P}_i} \tag{10}$$
$$Score\ Capsule\ DP= \frac{{\textstyle \sum_{1}^{{{n_D}_P}}}
{{{l_i}_D}_P}*min({{{{R_1}_D}_P}_i}, {{{{R_2}_D}_P}_i})}{L}\tag{11}$$
$${{{R_1}_D}_P}_i= \frac{{{{{{I_t}_c}_r}_D}_P}_i}{{{{{{I_s}_r}_1}_D}_P}_i} \tag{12}$$
$${{{R_2}_D}_P}_i= \frac{{{{{{I_t}_c}_r}_D}_P}_i}{{{{{{I_s}_r}_2}_D}_P}_i} \tag{13}$$
Where, $$${{{n_P}_V}_P}$$$ and $$${{n_D}_P}$$$ are the numbers of true capsule regions in PVP and DP. $$${{{{{{I_t}_c}_r}_P}_V}_P}_i$$$ and $$${{{{{I_t}_c}_r}_D}_P}_i$$$ are mean intensity of the capsule region $$${i}$$$ in PVP and DP. $$${{{{{{I_s}_r}_1}_P}_V}_P}_i$$$, $$${{{{{{I_s}_r}_2}_P}_V}_P}_i$$$, $$${{{{{I_s}_r}_1}_D}_P}_i$$$ and $$${{{{{I_s}_r}_2}_D}_P}_i$$$ are mean intensity of two regions at either side of the capsule region $$${i}$$$ in PVP and DP. $$${{{l_i}_P}_V}_P$$$ and $$${{l_i}_D}_P$$$ are the skeleton length of capsule region $$${i}$$$ in PVP and DP. $$${L}$$$ is tumor perimeter.
Results
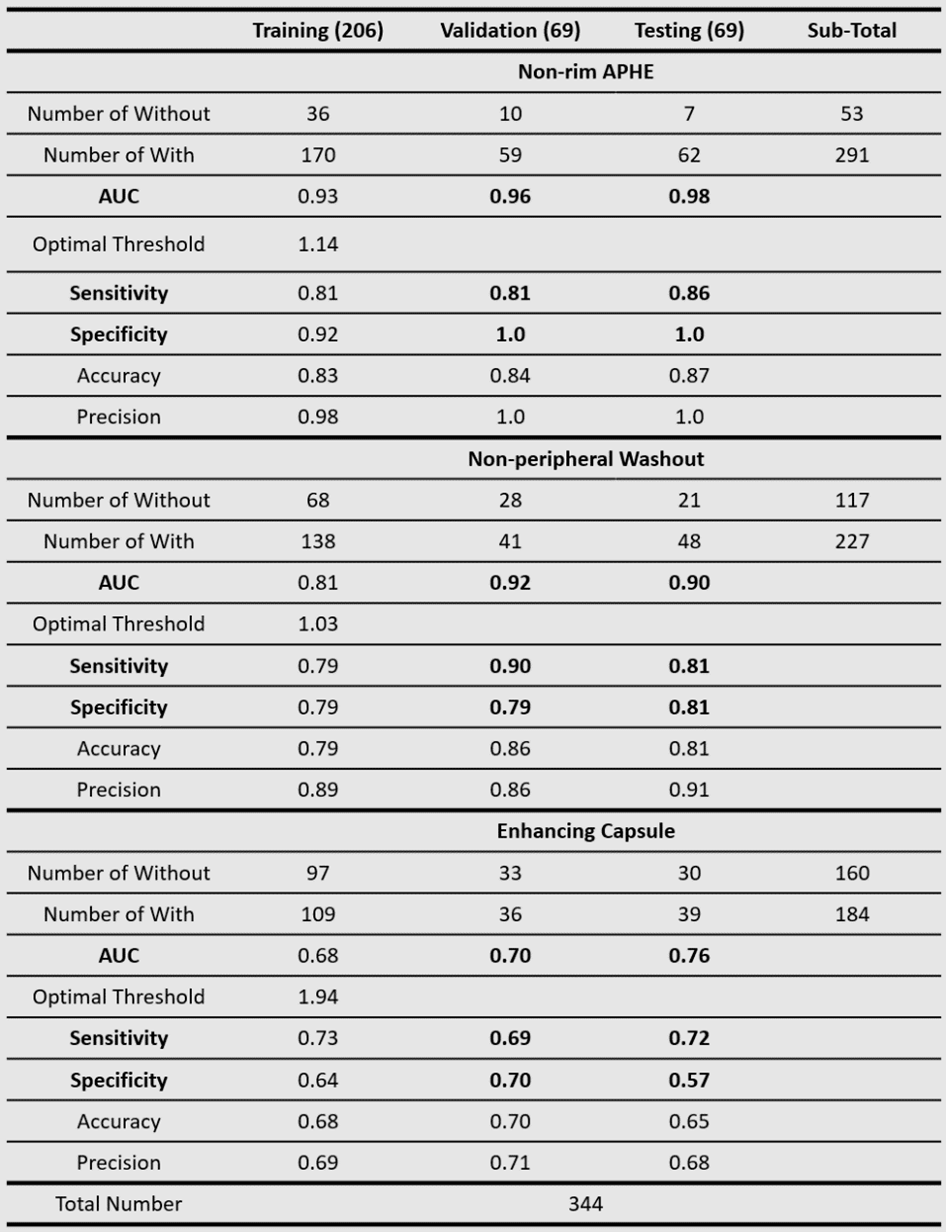
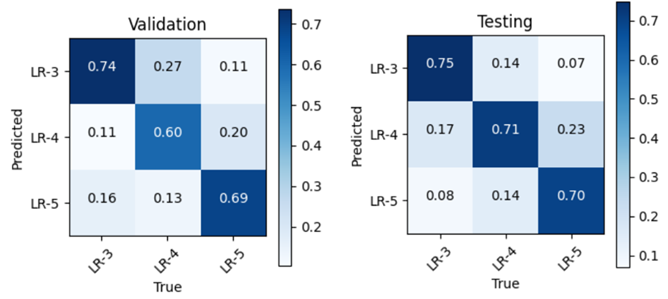
The AUCs are 0.96, 0.92, 0.70 in validation set and 0.98, 0.90, 0.76 in testing set for APHE, washout, and capsule respectively. The sensitivities are 0.81, 0.90, 0.69 in validation set and 0.86, 0.81, 0.72 in testing set for APHE, washout and capsule respectively. The specificity is 1.0, 0.79, 0.70 in validation set and 1.0, 0.81, 0.57 in testing set for APHE, washout and capsule respectively. The overall accuracy of LI-RADS grade is 0.68 in validation set and 0.71 in testing set. More detailed results are shown in Table 1, Table 2, and Figure 3.Discussion and Conclusion
The results for APHE and washout are good, but result for capsule still needs to be improved. The future work will focus on algorithm improvement for capsule and further accuracy improvement for LI-RADS grades. The developed automatic LI-RADS grading system can provide objective, quantitative, relatively accurate results for HCC diagnosis and staging with high efficiency. Meanwhile, the judgment of the three major features and the final LI-RADS category is explainable.Acknowledgements
This study was funded in part by the National Natural Science Foundation of China (No. 62001120) and the Shanghai Sailing Program (No. 20YF1402400) and ZJLab.References
1.Chernyak V, Fowler KJ, Kamaya A, et al. Liver Imaging Reporting and Data System (LI-RADS) Version 2018: Imaging of Hepatocellular Carcinoma in At-Risk Patients. Radiology. 2018;289(3):816-830. doi:10.1148/radiol.2018181494
2.Tang A, Bashir MR, Corwin MT, et al. Evidence Supporting LI-RADS Major Features for CT- and MR Imaging–based Diagnosis of Hepatocellular Carcinoma: A Systematic Review. Radiology. 2018;286(1):29-48. doi:10.1148/radiol.2017170554
3.Cerny M, Bergeron C, Billiard JS, et al. LI-RADS for MR Imaging Diagnosis of Hepatocellular Carcinoma: Performance of Major and Ancillary Features. Radiology. 2018;288(1):118-128. doi:10.1148/radiol.2018171678
4.Yamashita R, Mittendorf A, Zhu Z, et al. Deep convolutional neural network applied to the liver imaging reporting and data system (LI-RADS) version 2014 category classification: a pilot study. Abdom Radiol. 2020;45(1):24-35. doi:10.1007/s00261-019-02306-7
5.Alksas A, Shehata M, Saleh GA, et al. A Novel Computer-Aided Diagnostic System for Early Assessment of Hepatocellular Carcinoma. In: 2020 25th International Conference on Pattern Recognition (ICPR). IEEE; 2021:10375-10382. doi:10.1109/ICPR48806.2021.9413044
6.Wu Y, White GM, Cornelius T, et al. Deep learning LI-RADS grading system based on contrast enhanced multiphase MRI for differentiation between LR-3 and LR-4/LR-5 liver tumors. Ann Transl Med. 2020;8(11):701-701. doi:10.21037/atm.2019.12.151
7.Kim Y, Furlan A, Borhani AA, Bae KT. Computer-aided diagnosis program for classifying the risk of hepatocellular carcinoma on MR images following liver imaging reporting and data system (LI-RADS): CAD for HCC using LI-RADS. J Magn Reson Imaging. 2018;47(3):710-722. doi:10.1002/jmri.25772
8.Sheng R, Huang J, Zhang W, et al. A Semi-Automatic Step-by-Step Expert-Guided LI-RADS Grading System Based on Gadoxetic Acid-Enhanced MRI. JHC. 2021;Volume 8:671-683. doi:10.2147/JHC.S316385
9. Çiçek Ö, Abdulkadir A, Lienkamp SS, Brox T, Ronneberger O. 3D U-Net: Learning Dense Volumetric Segmentation from Sparse Annotation. arXiv:160606650 [cs]. Published online June 21, 2016. Accessed November 8, 2021. http://arxiv.org/abs/1606.06650
10.Frangi AF, Niessen WJ, Vincken KL, Viergever MA. Multiscale vessel enhancement filtering. In: Wells WM, Colchester A, Delp S, eds. Medical Image Computing and Computer-Assisted Intervention — MICCAI’98. Vol 1496. Lecture Notes in Computer Science. Springer Berlin Heidelberg; 1998:130-137. doi:10.1007/BFb0056195
11. Longo A, Morscher S, Najafababdi JM, Jüstel D, Zakian C, Ntziachristos V. Assessment of hessian-based Frangi vesselness filter in optoacoustic imaging. Photoacoustics. 2020;20:100200. doi:10.1016/j.pacs.2020.100200
Figures