3746
How does Levodopa treatment in Parkinson’s disease impact perfusion: A MR pCASL Study1Tsinghua University, Beijing, China, 2Tsinghua University, Bejing, China, 3Department of Neurosurgery, Tsinghua University Yuquan Hospital, Beijing, China
Synopsis
Levodopa therapy of Parkinson’s disease(PD) was considered to have effects on dopamine and norepinephrine levels therefore tending to alter the cardiovascular circulation. To find how cerebral perfusion changes in the levodopa process among PD patients, both perfusion capacity and spatial patterns computations were performed in this study. The initial conclusion is no obvious evidence supporting that cerebral perfusion alternation was effected in levodopa process. Further investigations were required to validate this point of view.
Introduction
Levodopa therapy of Parkinson’s disease(PD) was considered to have effects on dopamine and norepinephrine levels therefore tending to alter the cardiovascular circulation1. Some research pointed out that Levodopa effects could tend to decrease cerebral blood flow(CBF) by negative inotropic effects while others reported cases with CBF increased after Levodopa treatment1,2. Additionally, the spatial covariance pattern of perfusion change in PD patients with Levodopa-ON/OFF status remains unclear, which may help thoroughly understand the Levodopa therapy effects and further improve the diagnostic and curing choices of PD patients. By utilizing non-invasive pCASL MRI in this study, we focus not only on the perfusion capacity but also spatial perfusion distribution.Methods
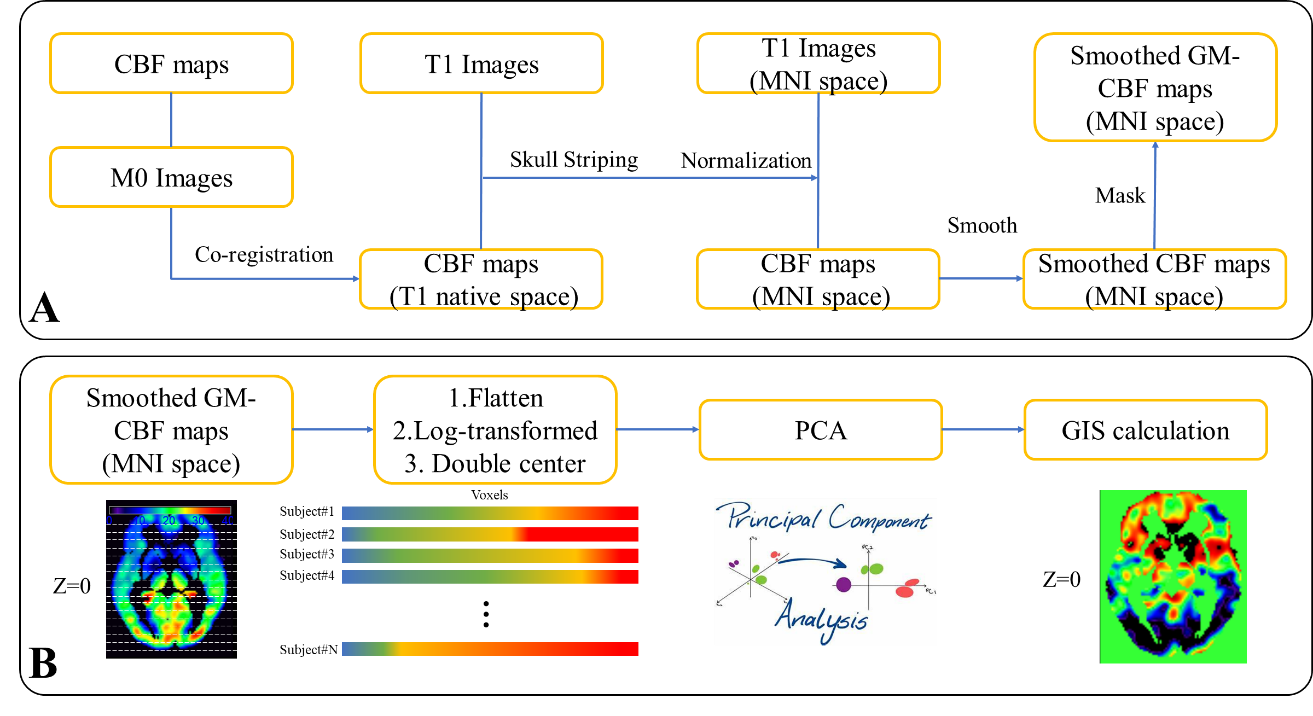
Demographic info and MR Imaging protocols: 46 de novo PD patients without obvious cerebrovascular disease (age: 59.9 ± 6.7 years old, H&Y stage 3.5 ±0.72) were recruited in the study. All PD patients were requested to stop levodopa intake at least 12 hours before the MRI exam. After the first scan (aka. “levodopa-OFF”), all patients took levodopa and were rescanned 50 minutes later (aka. “levodopa-ON”) with the same imaging protocols. All MR scans were completed on a 3T MR scanner (Achieva, Philips Medical System, Best, The Netherlands) with a 32-channel head coil. pCASL and 3D T1-TFE were scanned with parameters: 3D T1: sagittal acquisition with 256(FH)×256(AP)×160(RL) mm3 FOV; 1×1×2 mm3 resolution; TE/TR/Flip angle=3.6 ms/7.8 ms/8°. PCASL, axial acquisition with 240(AP)×240(RL)×132(FH) mm3; 3×3×6 mm3 resolution, TR/TE = 4013/12 ms, SENSE acceleration = 3, label duration = 1650 ms, post labeling delay (PLD) = 1575 ms.Image post processing (Figure 1A): Both levodopa-ON/OFF pCASL CBF maps were calculated from raw pCASL data by Philips workstation. Both ASL-M0 images were affinely co-registered to T1 images scanned at levodopa-OFF status and the transformation matrix was applied to corresponding CBF maps. Skull stripping was utilized to remove the non-brain tissues. A grey matter (GM) segmentation was applied to extract the GM-CBF maps in T1 local space. After deformable normalization for T1, CBF maps in T1 local space were simultaneously normalized to standard MNI space and smoothed by FWHM of 8mm. All image processing work were performed on SPM12 software3.
SSMPCA analysis (Figure 1B): Scaled sub-profile model with principal components analysis(SSMPCA)4-5 was conducted for processed GM-CBF maps. All voxels from each subject within GM mask were flattened and then constructed a “double centered” log-transformed subject residual profile(SRP) matrix. PCA was applied to the group covariance matrix to calculate principal components vectors and eigenvalues. Voxel-based principal components, also known as group invariant subprofile(GIS), were computed from SRP and PCA results. All input CBF maps can be projected to orthogonal GIS vectors and therefore output separate scores in each GIS vector. The scores were Z-transformed to normalize the individual variations. The GIS were extracted from both levodopa-ON and levodopa-OFF CBF maps and corresponding z-scores were computed for all CBF maps. GIS were chosen by variance account for(Vaf) > 5% for both calculations. Z-scores > 3 was considered outliers. Two sample t-test was used to show the difference spatial pattern of perfusion change, significance level was set to 0.05.
Results
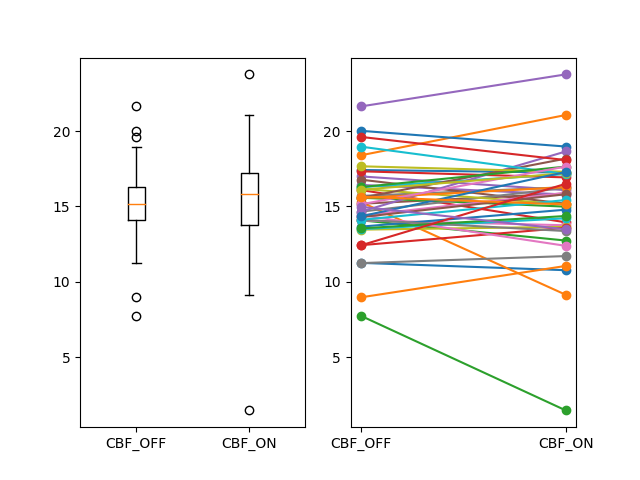
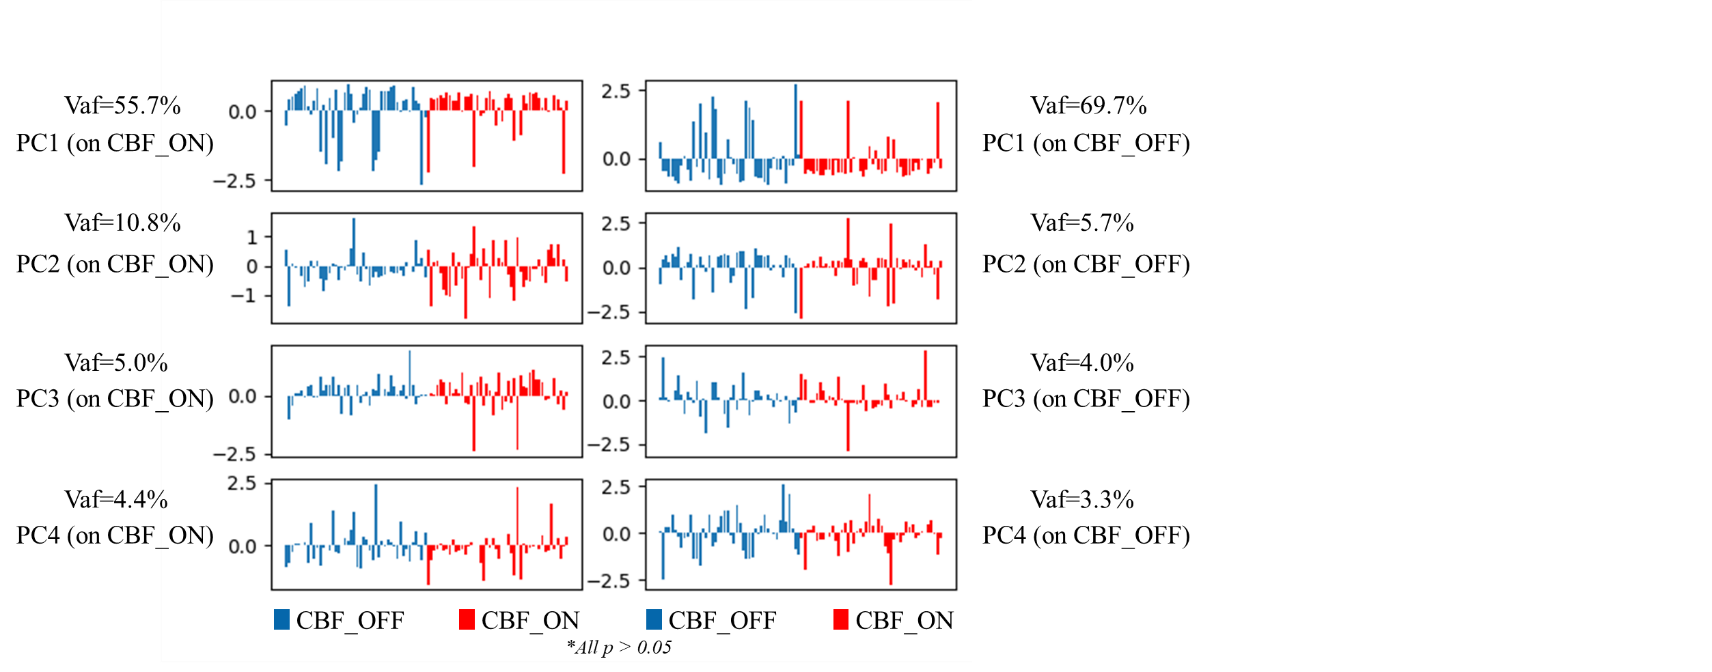
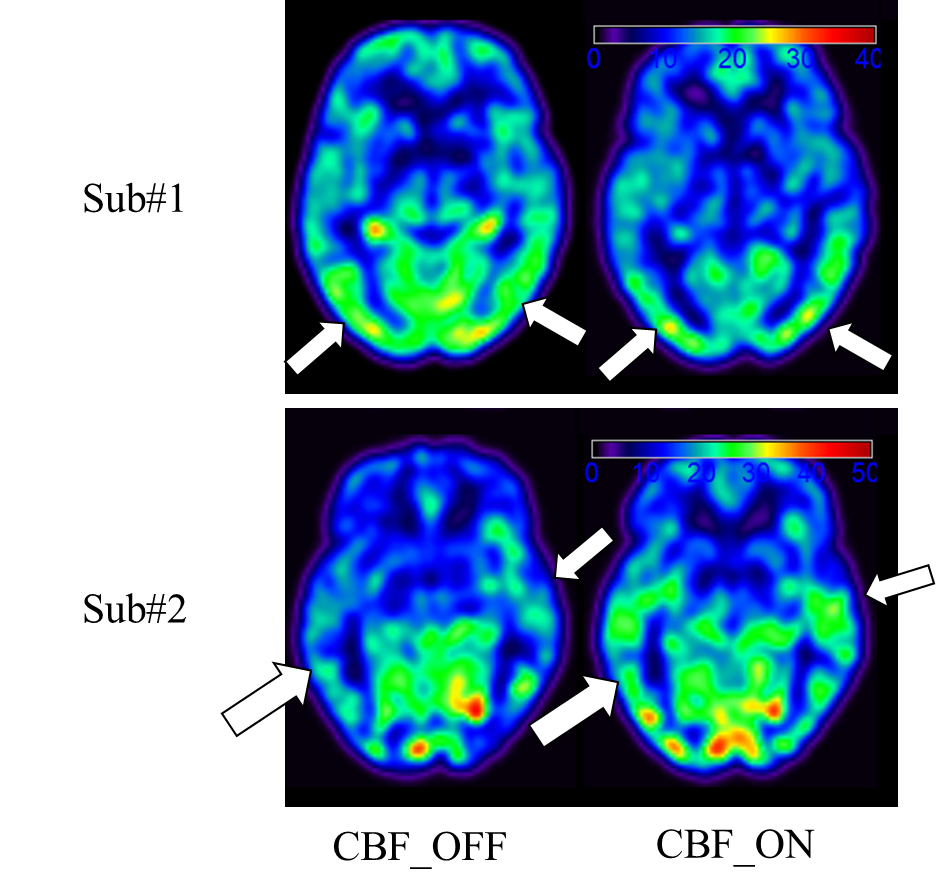
Perfusion capacity (Figure 2): As shown in Figure 2., the whole brain GM-CBF in levodopa-ON and levodopa-OFF does not show group level significant difference(p > 0.05). For each subject, it’s hard to predict GM-CBF at ON status given the information of GM-CBF at OFF status. Intuitively, as shown in Figure 4, two representative cases with different GM-CBF change levodopa ON/OFF were shown.Perfusion covariance pattern (Figure 3): As shown in Figure 3., on the left side the z-scores of all subjects projected on the GIS extracted from CBF at OFF status, and on the right side are all z-scores computed from ON status CBF GIS vectors. All t-test show not significant(p > 0.05) difference in every GIS vectors, which indicates the perfusion change between levodopa-ON and -OFF status has little fixed spatial patterns among PD patients. The change of CBF is kind of a random way among different subjects. Corresponding GIS vectors with Vaf% were also shown in Figure 3.
Discussion and conclusion
In this study, the perfusion change was investigated between levodopa-ON and levodopa-OFF status among PD patients. In the view of perfusion capacity, the whole brain GM-CBF change is hard to say increasing or decreasing at group level. Some subjects have significant GM-CBF gain while others may decrease. In the view of perfusion spatial distribution, for the first time to our knowledge, results show that the CBF change is not correlated with some specific brain locations (or structures). Unlike the disease-related perfusion pattern, this initial finding suggests the CBF change in levodopa-process are more complicated and seems to be more random. All these findings indicate that further investigations are required to clarify the mechanism of perfusion in neuro-degenerative diseases. One of the obvious drawback of this study is limited number of subjects.Acknowledgements
No acknowledgement found.References
1. Noack C, Schroeder C, Heusser K, Lipp A. Cardiovascular effects of levodopa in Parkinson's disease. Parkinsonism Relat Disord 2014;20(8):815-818.
2. Xiong Y, Ji L, He L. Effects of levodopa therapy on cerebral arteries and perfusion in Parkinson's disease patients. J Magn Reson Med 2021.
3. https://www.fil.ion.ucl.ac.uk/spm/software/spm12/.
4. Peng S, Ma Y, Spetsieris P, Mattis P, Feigin A, Dhawan V, Eidelberg D. Characterization of disease-related covariance topographies with SSMPCA toolbox: effects of spatial normalization and PET scanners. Hum Brain Mapp. 2014 May;35(5):1801-14.
5. Spetsieris P, Ma Y, Peng S, Ko J, Dhawan V, Tang C, and Eidelberg D. Identification of Disease-related Spatial Covariance Patterns using Neuroimaging Data. J Vis Exp. 2013; (76): 50319.
Figures