3745
Comparative analysis of IVIM and PET imaging versus APTw in assessing Ki-67 expression of non-small cell cancer1Zhengzhou University People's hospital, Zhengzhou, China, 2Henan Provincial People's Hospital, Zhengzhou, China, 3Beijing United Imaging Research Institute of Intelligent Imaging, Beijing, China, 4Central Research Institute, Shanghai, China
Synopsis
Intra-Voxel Incoherent Motion (IVIM), PET imaging, and Amide Proton Transfer weighted imaging (APTw) are all effective tools for distinguishing the pathological types of solitary pulmonary lesions. The difference between their ability to distinguish the Ki-67 high expression (HE) and low expression (LE) group is still unclear. Our study shows IVIM and PET imaging are better methods than APTw for distinguishing Ki-67 HE and LE groups of non-small cell cancer.
Introduction
Lung cancer is the most common cause of cancer-related deaths worldwide with non-small cell lung cancer (NSCLC) making up the majority of this case1. Ki67 was associated with a significantly higher hazard ratio for death and recurrence in NSCLC patients1. It has been confirmed that Amide Proton Transfer weighted imaging (APTw), Intra-Voxel Incoherent Motion (IVIM), and PET imaging are all effective tools not only for distinguishing benign and malignant lung lesions but also can distinguish squamous cell carcinoma (SCC) and adenocarcinoma (AC) in NSCLC2. The purpose of this study is to assess Ki-67 expression of NSCLC with APTw, IVIM, and PET imaging.Methods
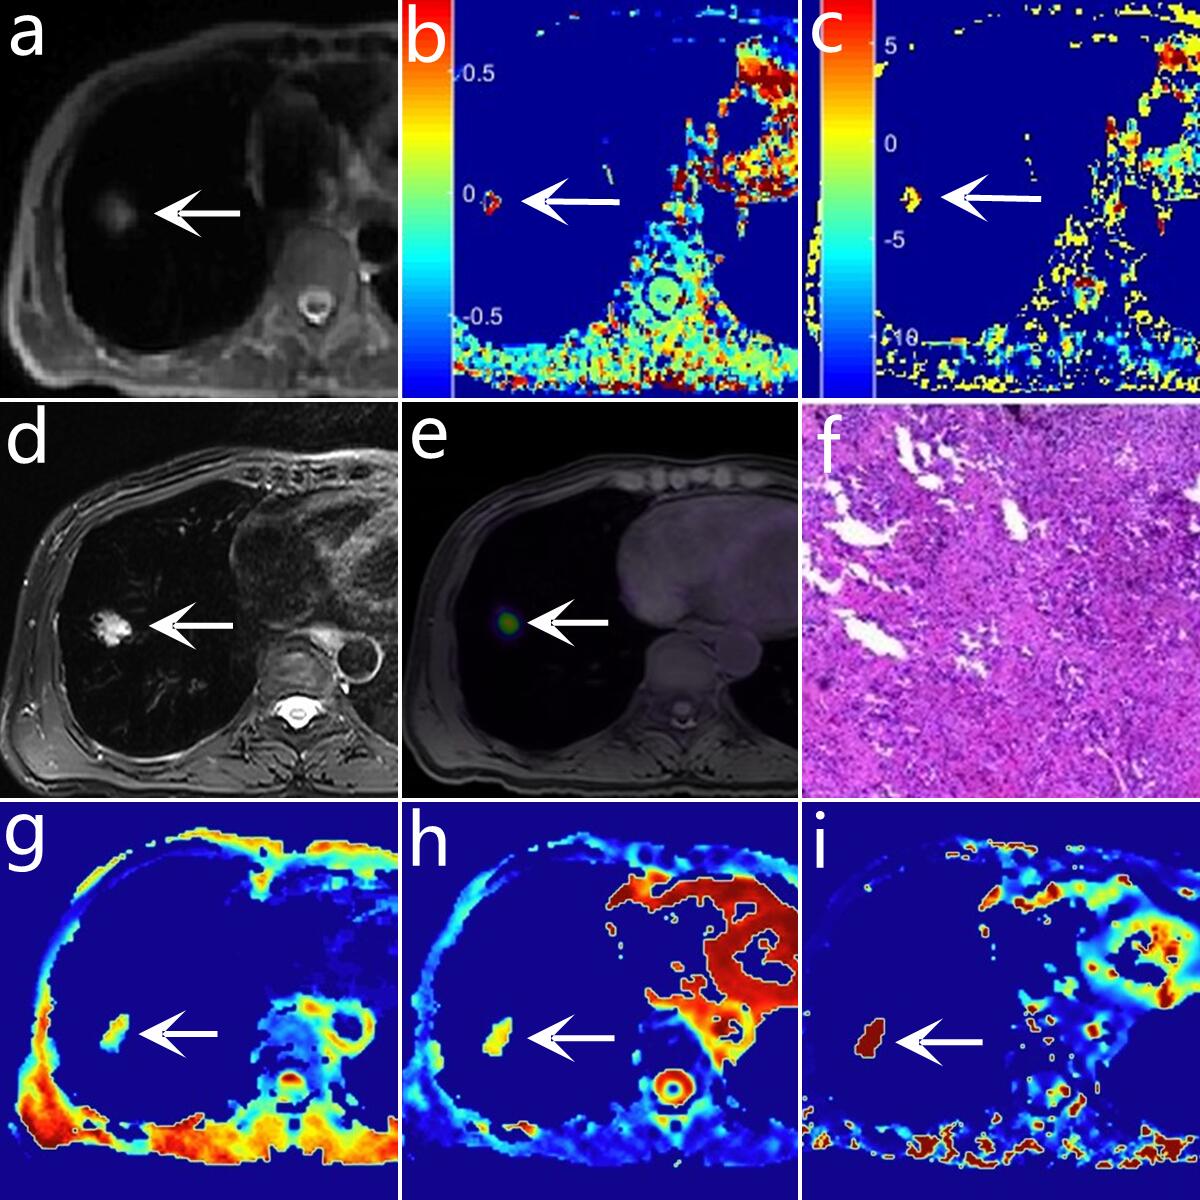
A total of 47 patients with NSCLC (16 with SCC, 31 with AC) underwent chest 18F-FDG PET/MR examinations, which included APTw, IVIM, and PET imaging (figure 1). Taking pathological results as the gold standard, patients were divided into Ki-67 high-expression (HE) group (22 patients) (Ki-67 labeling index (LI) ≥ 14%) and Ki-67 low-expression (LE) group (35 patients) (Ki-67 LI < 14%)3. The magnetization transfer ratio asymmetry (MTRasym), the true diffusion coefficient D, the perfusion fraction f, the pseudo diffusion coefficient D*, and the maximum normalized uptake value (SUVmax) at 3.5 ppm mapping were calculated. The IVIM sequence was set with the following parameters: TR= 1620 ms, TE= 69.6 ms; b-values = 0, 25, 50, 100, 150, 200, 400, 600, 800, and 1000 s/mm2, number of excitation = 1, 1, 2, 2, 4, 4, 6, 6, 8, 10. APTw was performed by using a single slice FSE protocol, parameters are as follows: ETL = 39, B1 = 1.3 μT and 2.5 μT, Gaussian pulse, 100ms duration, 10 repeats, Δ spanned from [-4.5 4.5] ppm in 31 steps, plus one S0 with no CEST saturation pulse for normalization; 11 low power B1 = 0.13 μT, Δ spanned from [-1.0 1.0] ppm images were collected as WASSAR images for B0 map correction, TR/TE/Flip Angle = 4500ms/35.4ms/160o. The ROI was placed to cover as much of the solid tumor as possible to avoid large blood vessels and bleeding, calcification, cystic, and necrotic areas. SPSS 26.0 and Medcalc 15.0 were used to perform the data analysis. The independent samples t-test was used to analyze the differences in parameters between groups. The receiver operating characteristic (ROC) curve is generated to evaluate the diagnostic accuracy and threshold of each parameter. The Delong method was used to compare the area under the curve (AUC) of different parameters. P<0.05 was considered statistically significant.Results
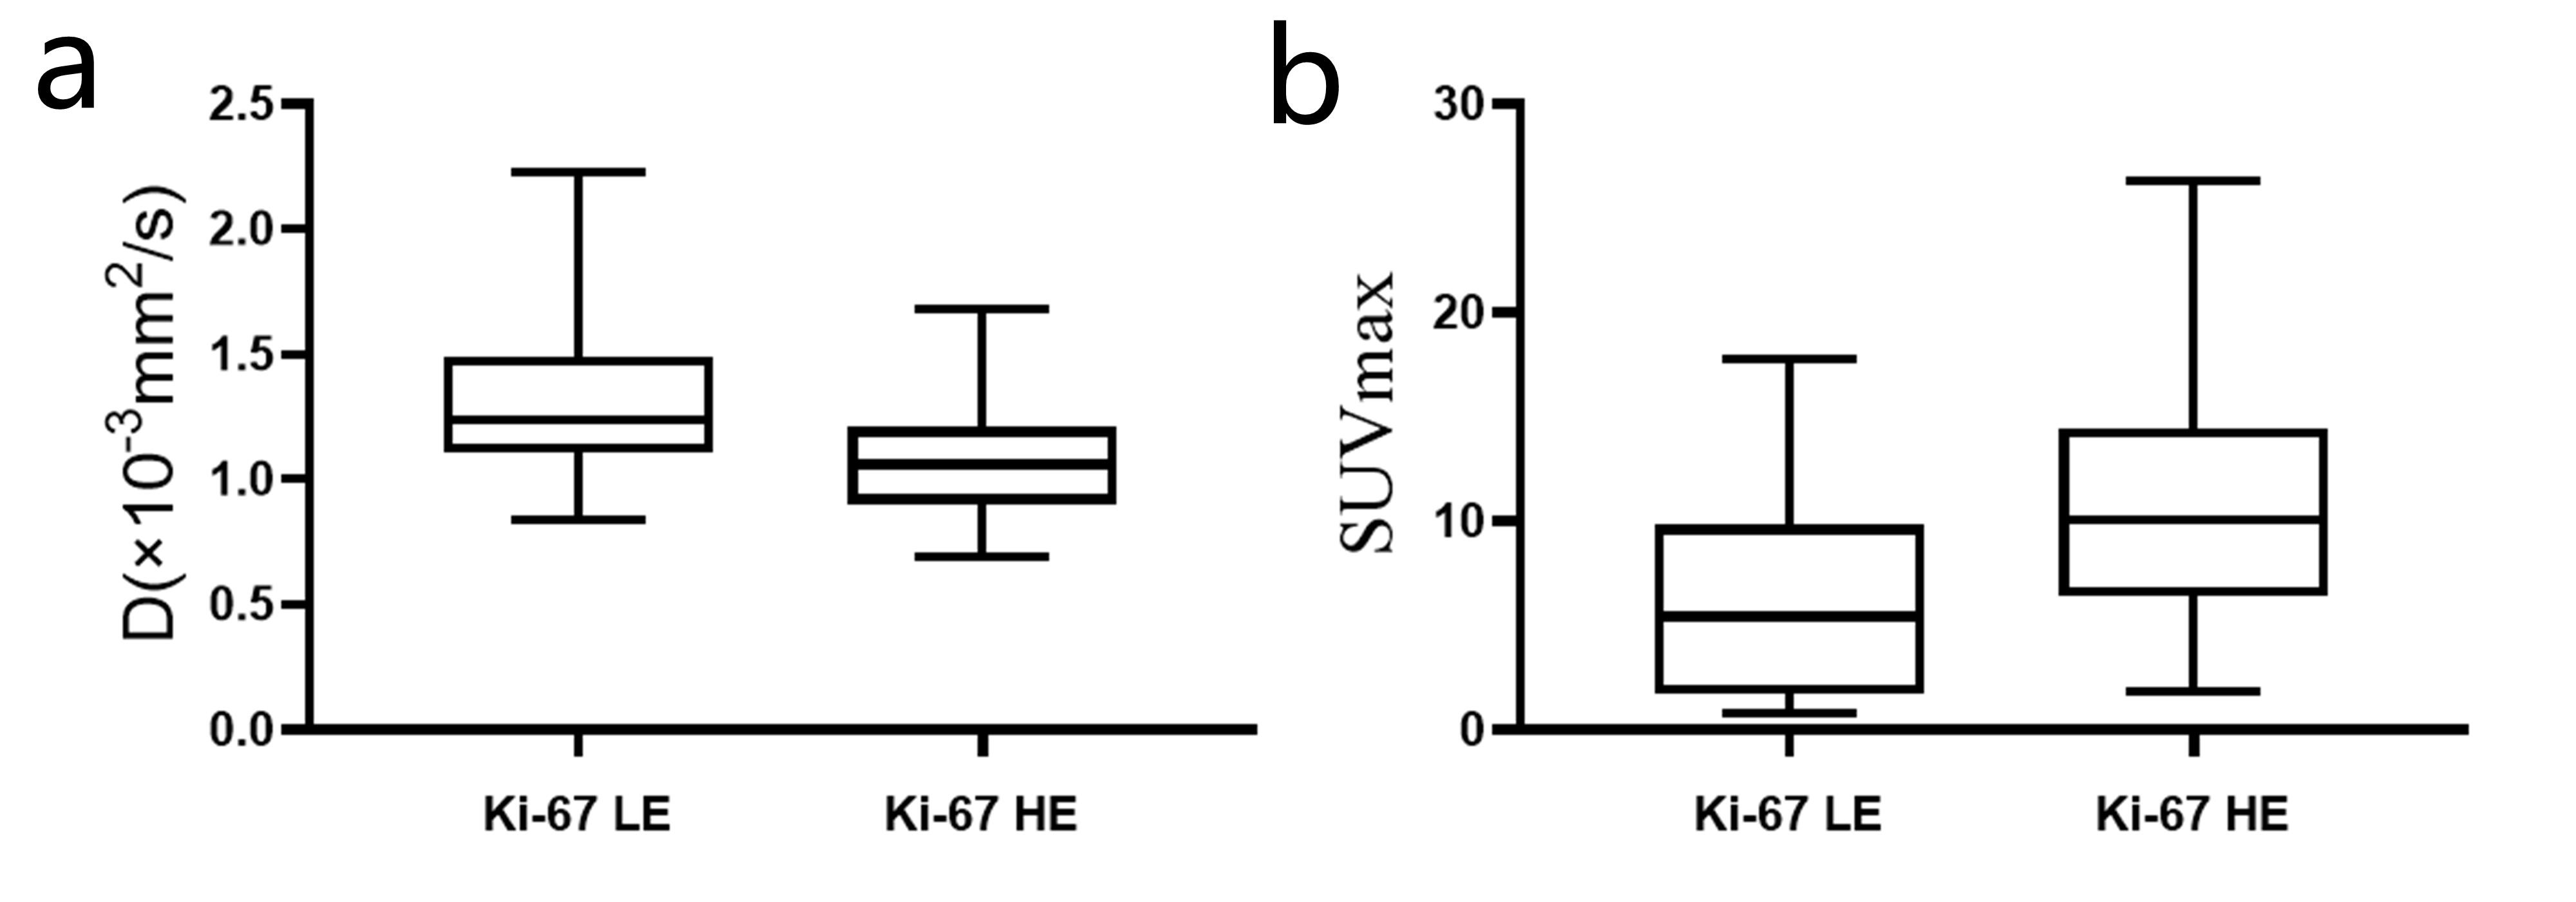
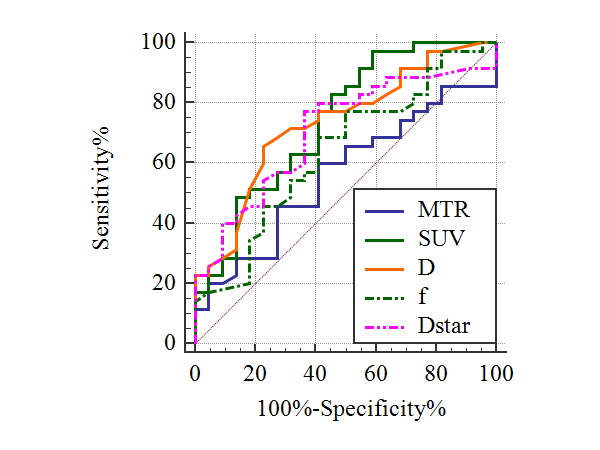
The SUVmax is significantly higher and the D value is significantly lower in Ki-67 HE (11.1±5.9, [1.1±0.3]×10-3mm2/s)) than in the LE group (6.2±4.9, [1.3±0.3]×10-3mm2/s), P=0.002, 0.004, respectively) (figure 2). However, there is no difference in MTRasym, f, and D* between Ki-67 HE and LE groups (P=0.249, 0.145, and 0.067, respectively). SUVmax has the best specificity (97.14%) and D has the best sensitivity (77.27%) in distinguishing these two groups. The AUC of different parameters (MTRasym, D, f, D*, and SUVmax) in distinguishing Ki-67 HE and LE groups are 0.563, 0.734, 0.637, 0.707, and 0.742, respectively (figure 3). Nevertheless, there is no difference in the pairwise comparison of ROC curves.Discussion
Our study shows that IVIM and PET imaging both are effective methods versus APTw to distinguishing Ki-67 HE and LE groups of NSCLC patients. Ki67, a cell cycle-related protein, has been listed as an effective index for evaluating the proliferation of cancer cells and the treatment prognosis4. The finding that the D value of Ki-67 HE is lower than the LE group is similar to the previous studies5-7. The objects of previous studies are breast cancer and rhabdomyosarcoma patients, although the object of the present study is NSCLC patients. The Ki-67 LI was positively correlated with the density of tumor cells (the density of tumor cells increased, and the extracellular space decreased)8, which can cause the decrease of D value. Tumors with high SUVmax contain high levels of cancer cell proliferation, and SUVmax is positively correlated with Ki-67 staining9. The SUVmax is significantly higher in Ki-67 HE than in the LE group can not only be seen in NSCLC, but also in pancreatic neuroendocrine tumor10, gastric cancer11, and pancreatic adenosquamous carcinoma12 except head and neck cancer13. It may be because there are many pathological types of head and neck cancer that cause uncertainty in the relationship between SUVmax and Ki-67. Surprisingly, there is no difference of MTRasym between Ki-67 HE and LE groups in our study, which is different from previous studies based on breast cancer14, gliomas15, rectal adenocarcinoma16, and glioblastoma17. It has been reported that the MTRasym of AC is significantly higher than SCC2. The object of the present study is composed of patients with AC and SCC, which may cause a difference from other studies.Limitations
The ROI was drawn in the solid part of the entire lesion, which may lead to selection bias because of the histological heterogeneity of the tumor.Conclusion
IVIM and PET imaging are more useful than APTw in distinguishing Ki-67 HE and LE groups. Furthermore, IVIM has the best sensitivity and PET imaging has the best specificity.Acknowledgements
The National Key R&D Program of China (2017YFE0103600), the Henan Medical Science and Technology Research Program (2018020357 and 2018020367), the National Natural Science Foundation of China (81720108021 and 31470047), and Zhongyuan Thousand Talents Plan Project - Basic Research Leader Talent (ZYQR201810117)References
1 Grant L, Banerji S, Murphy L et al. Androgen Receptor and Ki67 Expression and Survival Outcomes in Non-small Cell Lung Cancer. Hormones & cancer 2018;9:288-294.
2 Fang T, Meng N, Feng P et al. A Comparative Study of Amide Proton Transfer Weighted Imaging and Intravoxel Incoherent Motion MRI Techniques Versus (18) F-FDG PET to Distinguish Solitary Pulmonary Lesions and Their Subtypes. J Magn Reson Imaging 2021.
3 Cheang MC, Chia SK, Voduc D et al. Ki67 index, HER2 status, and prognosis of patients with luminal B breast cancer. Journal of the National Cancer Institute 2009;101:736-750.
4 Wen S, Zhou W, Li CM et al. Ki-67 as a prognostic marker in early-stage non-small cell lung cancer in Asian patients: a meta-analysis of published studies involving 32 studies. BMC cancer 2015;15:520.
5 Ma Y, Shan D, Wei J et al. Application of intravoxel incoherent motion diffusion-weighted imaging in differential diagnosis and molecular subtype analysis of breast cancer. American journal of translational research 2021;13:3034-3043.
6 Fan M, Yuan W, Zhao W et al. Joint Prediction of Breast Cancer Histological Grade and Ki-67 Expression Level Based on DCE-MRI and DWI Radiomics. IEEE journal of biomedical and health informatics 2020;24:1632-1642.
7 Kim Y, Ko K, Kim D et al. Intravoxel incoherent motion diffusion-weighted MR imaging of breast cancer: association with histopathological features and subtypes. Br J Radiol 2016;89:20160140.
8 Li C, Zheng M, Zheng X et al. Predictive Ki-67 Proliferation Index of Cervical Squamous Cell Carcinoma Based on IVIM-DWI Combined with Texture Features. Contrast media & molecular imaging 2021;2021:8873065.
9 Kernstine KH, Faubert B, Do QN et al. Does Tumor FDG-PET Avidity Represent Enhanced Glycolytic Metabolism in Non-Small Cell Lung Cancer? The Annals of thoracic surgery 2020;109:1019-1025.
10 de Mestier L, Armani M, Cros J et al. Lesion-by-lesion correlation between uptake at FDG PET and the Ki67 proliferation index in resected pancreatic neuroendocrine tumors. Digestive and liver disease : official journal of the Italian Society of Gastroenterology and the Italian Association for the Study of the Liver 2019;51:1720-1724.
11 Liu Y, Zheng D, Liu JJ et al. Comparing PET/MRI with PET/CT for Pretreatment Staging of Gastric Cancer. Gastroenterology research and practice 2019;2019:9564627.
12 Su W, Zhao S, Chen Y et al. (18)F-FDG PET/CT feature of pancreatic adenosquamous carcinoma with pathological correlation. Abdominal radiology (New York) 2020;45:743-749.
13 Samolyk-Kogaczewska N, Sierko E, Dziemianczyk-Pakiela D et al. Usefulness of Hybrid PET/MRI in Clinical Evaluation of Head and Neck Cancer Patients. Cancers 2020;12.
14 Zaric O, Farr A, Poblador Rodriguez E et al. 7T CEST MRI: A potential imaging tool for the assessment of tumor grade and cell proliferation in breast cancer. Magn Reson Imaging 2019;59:77-87.
15 Togao O, Yoshiura T, Keupp J et al. Amide proton transfer imaging of adult diffuse gliomas: correlation with histopathological grades. Neuro-oncology 2014;16:441-448.
16 Li L, Chen W, Yan Z et al. Comparative Analysis of Amide Proton Transfer MRI and Diffusion-Weighted Imaging in Assessing p53 and Ki-67 Expression of Rectal Adenocarcinoma. J Magn Reson Imaging 2020;52:1487-1496.
17 Kumari N, Thakur N, Cho HR et al. Assessment of Early Therapeutic Response to Nitroxoline in Temozolomide-Resistant Glioblastoma by Amide Proton Transfer Imaging: A Preliminary Comparative Study with Diffusion-weighted Imaging. Scientific reports 2019;9:5585.
Figures