3744
Habitat Analysis of Multi-parametric MRI for Predicting Postoperative Recurrence of Meningioma1Shanghai Key Laboratory of Magnetic Resonance, East China Normal University, Shanghai, China, 2MR Scientific Marketing, Siemens Healthineers, Shanghai, China, 3Department of Radiology, Fujian Medical University Union Hospital, Fuzhou, China, 4Shanghai University of Medicine & Health Sciences, Shanghai, China
Synopsis
We used multi-parametric MRI to predict the postoperative recurrence of meningioma. Compared to the usual radiomics on analyzing the whole tumor, we used an unsupervised clustering method to explore the tumor habitats. Interpretable features were extracted from subregions of the lesion and used to build a habitat radiomic model. The habitat model achieved an AUC of 0.711 compared with 0.569 achieved by whole tumor analysis. The split subregions of the tumor also have clear biological meanings to the radiologists.
INTRODUCTION
Meningiomas are the most common primary intracranial tumors, accounting for 38% of all tumors of the central nervous system 1. Surgical resection of the meningioma is the first choice of treatment 2. However, some tumors may still recur soon after surgery. Several studies have identified MRI images signs associated with meningioma recurrence 3. As most image signs are qualitative and subjective, accurate prediction of postoperative meningioma recurrence remains challenging. Radiomics is a popular method to extract quantitative information of the tumor from the medical images and uses machine learning to predict cancer characteristics. Recently, there have been several radiomics studies on meningioma 4-6. For usual Radiomics analysis, the features were extracted from the region of interest (ROI) of the whole tumor, which ignores the cancer habitats and heterogeneity. In this study, we used an unsupervised clustering method to split the whole tumor region and extracted quantitative features from subregions to predict the postoperative recurrence of meningioma.Materials and Methods
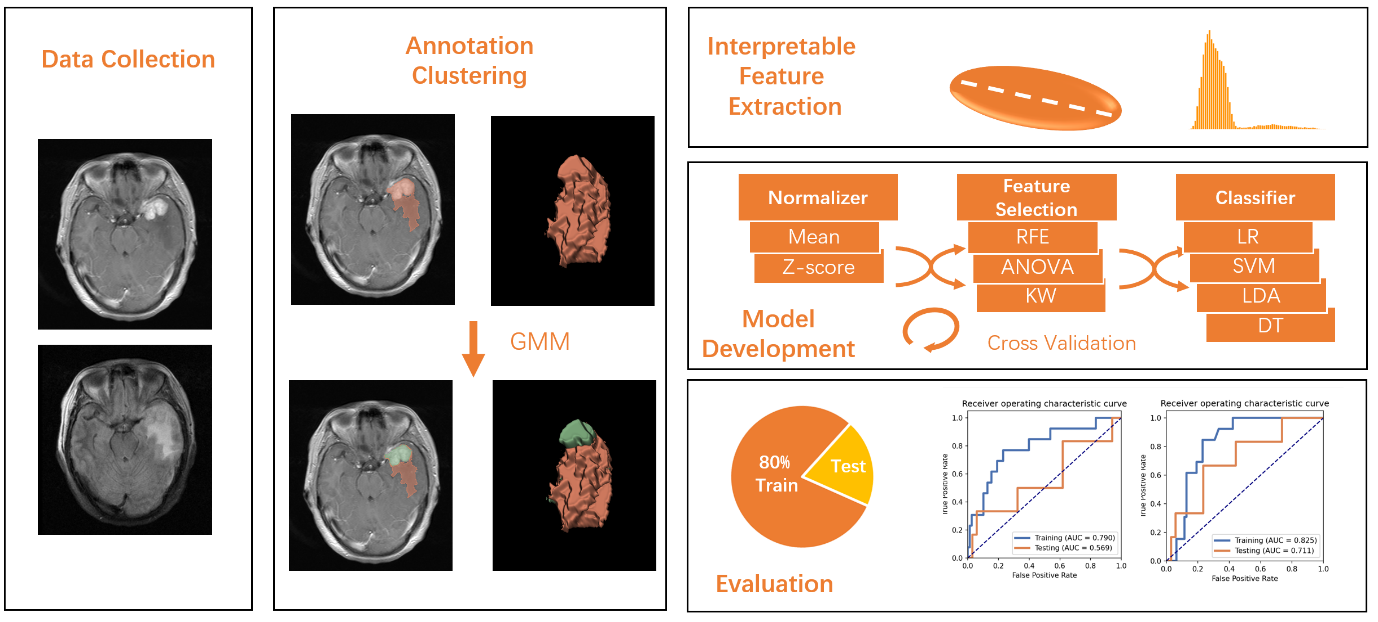
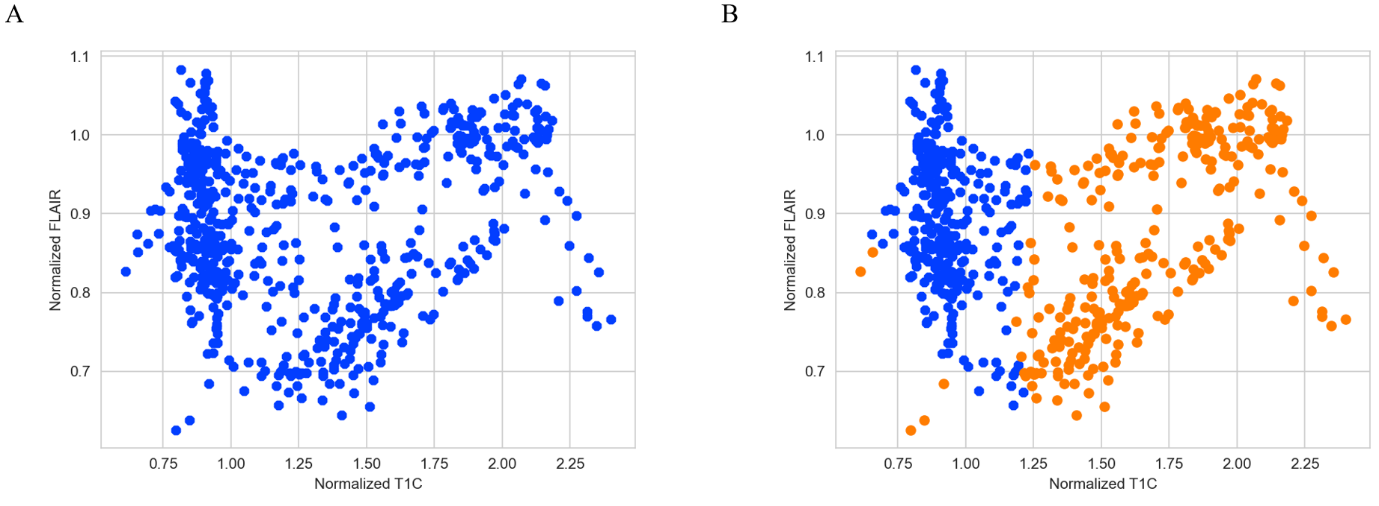
A total of 131 patients with meningioma who underwent surgical resection at the department of neurosurgery of the Fujian Medical University Union Hospital between June 2010 and December 2020 were enrolled in this retrospective study, 19 cases with recurrence and 112 cases without recurrence. We split them into a training cohort with 85 cases (13 recurrences) and a test cohort with 46 cases (6 recurrences). All patients were scanned on 3T Siemens MAGNETOM Trio or GE Discovery MR750. Dynamic contrast-enhanced T1-weighted images (T1C) and T2 fluid-attenuated inversion recovery (FLAIR) were acquired with the same scanning parameters (T1C: TR/TE=2500/25ms, FOV=20cm; FLAIR: TR/TE=9000/94ms). The FLAIR images were aligned onto the T1C images with Elastix. Tumor lesion was labeled by a radiologist with 5-years’ experience, and reviewed by a senior radiologist with 10-years’ experience. The workflow of the study is shown in Figure 1. We built a Modellesion with features extracted from the whole ROI. To analyze the habitats of the tumor, we treated each voxel in the ROI as a 2D vector with normalized T1C intensity and FLAIR intensity, and used Gaussian mixture model to segregate the voxels into two clusters, thus split the ROI into two parts. We extracted radiomics e features from each part from each sequence, and combined them into a habitat feature matrix to build Modelhabitats. We randomly upsampled positive cases to balance the samples in the training dataset. Different combinations of normalization, feature selection and classification algorithms were iterated to find the best model. Five-fold cross-validation was used on the training cohort, and the model with the best cross-validation AUC (area under the ROC curve) was selected. Then we used the whole training dataset to tune the weights in the model and evaluated it on the independent test cohort. ROC curve and confusion matrix was used to evaluate the model, and Delong’s test was used to compare Modelhabitats with Model Modellesion. All above process was implemented on FeAture Explorer (FAE, V. 0.4.3) 7.Results
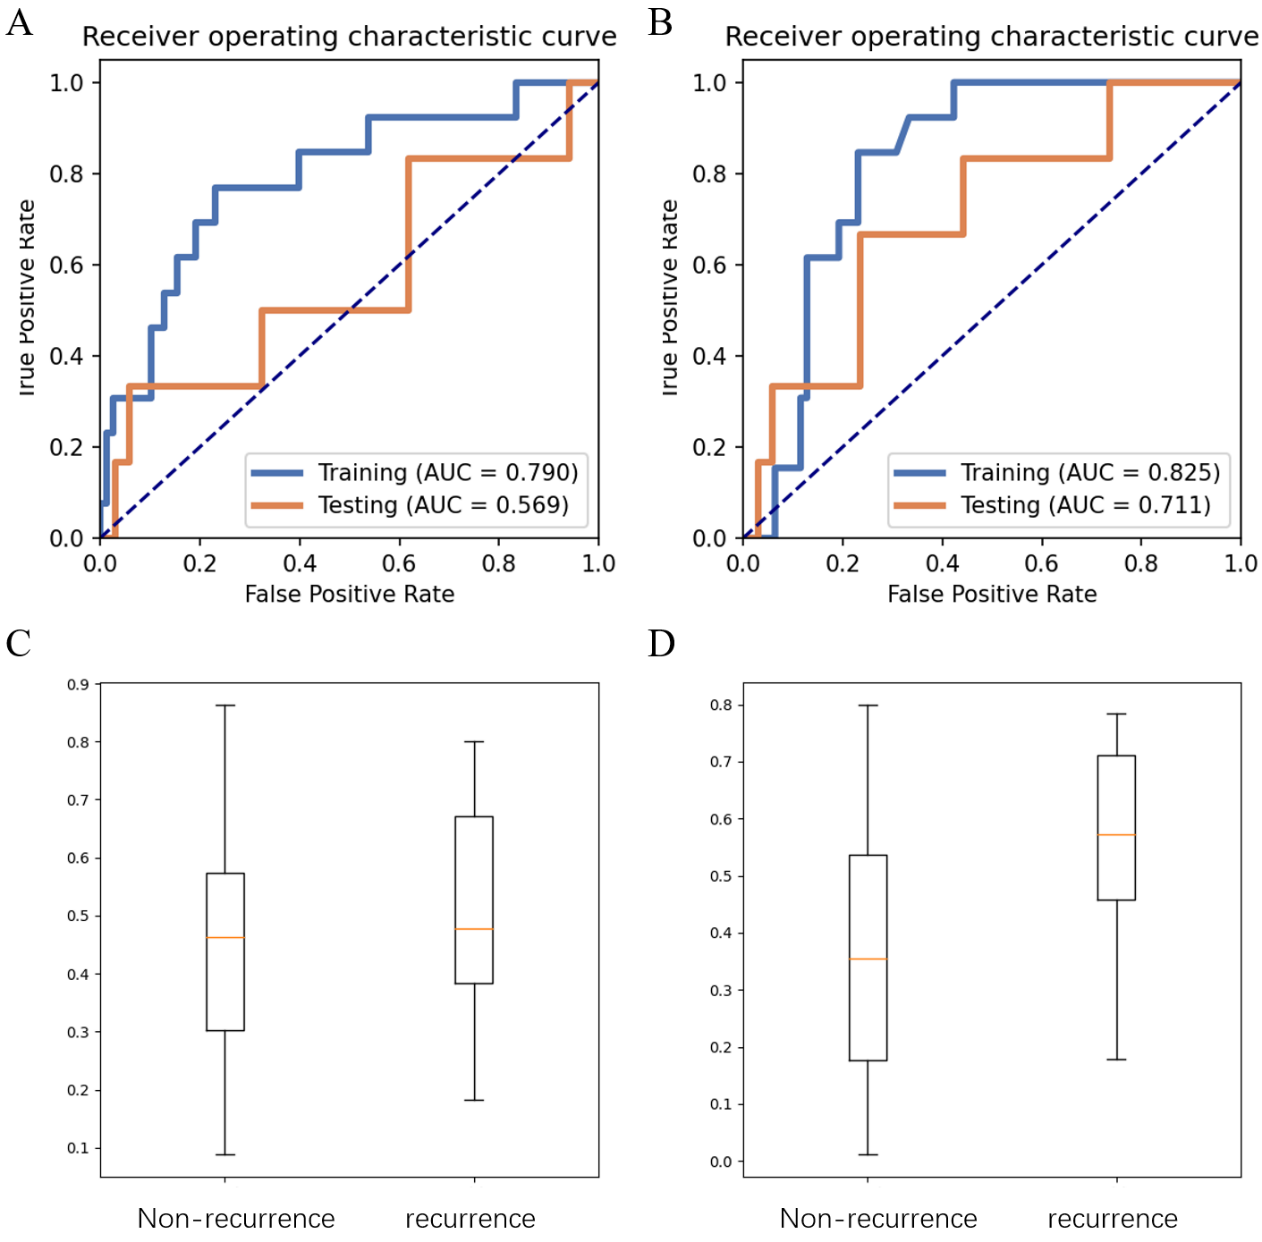
We showed the normalized T1C-FLAIR plane and the clustering of two regions in Figure 2. Then 54 features were extracted from the whole ROI to build Modellesion and 78 features were extracted from the sub-regions to build Modelhabitats. Modellesion achieved an AUC/sensitivity/specificity/PPV/NPV of 0.569/0.333/0.941/0.500/0.889, while Modelhabitats achieved an AUC/sensitivity/specificity/PPV/NPV of 0.711/0.667/0.765/0.333/0.929. The AUC of the Modelhabitats was significantly higher than that of Modellesion (p < 0.05). The probability distribution and ROC curves was shown in Figure 3.Discussion and Conclusion
In this study, we used an unsupervised clustering method on T1C and FLAIR images to split the meningioma ROI into two subregions. Interpretable features from these subregions were used to build a machine learning model, which achieved a test AUC of 0.711. R. Gillies pointed that habitat imaging could build a connection between the whole tumor and local pre-voxel analysis 8. Compared to the usual radiomics analysis, the clustering method, such as k-means and Gaussian mixture model, was successful used in tumor habitats analysis 9. In this study, we tried to split the voxels in the 2D T1C-FLAIR plane into two regions, which corresponds to the solid components of the tumor and areas of peritumoral edema. Many radiomics studies used many types of features, including shape, histogram, texture feature, and even features based on various transforms of images. However, a big number of brought about the problem of overfitting, and complex features were hard to interpret. As with many radiomics studies, the size of dataset was limited in our study, so we only extracted shape-based and histogram-related features, which are robust and easy to understand for clinical radiologists, and also alleviated the overfitting problem. The major limitation of our study was we only used a relatively small dataset from one institution. More data should be collected from different centers to further verify the proposed method. Besides, we only used T1C and FLAIR sequences, quantitative maps derived from diffusion weighted images and dynamic contrast images might provide more information on meningioma diagnosis.Acknowledgements
This project is supported by National Natural Science Foundation of China (61731009).References
1. Ostrom Q, Patil N, Cioffi G, et al. CBTRUS Statistical Report: Primary Brain and Other Central Nervous System Tumors Diagnosed in the United States in 2013-2017. Neuro-oncology. 2020;22:iv1-iv96.
2. Goldbrunner R, Minniti G, Preusser M, et al. EANO guidelines for the diagnosis and treatment of meningiomas. The Lancet Oncology. 2016;17(9):e383-91.
3. Ko CC, Lim SW, Chen TY, et al. Prediction of progression in skull base meningiomas: additional benefits of apparent diffusion coefficient value. J Neuro Oncol. 2018;138:63–71.
4. Ko CC , Zhang Y, Chen J H , et al. Pre-operative MRI Radiomics for the Prediction of Progression and Recurrence in Meningiomas. Frontiers in Neurology, 2021, 12:636235.
5. Banzato T, Causin F, Della A, et al. Accuracy of Deep Learning to Differentiate the Histopathological Grading of Meningiomas on MR Images: A Preliminary Study. Journal of Magnetic Resonance Imaging, 2019;50(4):1152-1159.
6. Yae, Won, Park, et al. Radiomics and machine learning may accurately predict the grade and histological subtype in meningiomas using conventional and diffusion tensor imaging. European radiology, 2018; 29(8):4068-4076.
7. Song Y, Zhang J. Zhang YD, et al. FeAture Explorer (FAE): A tool for developing and comparing radiomics models. PLoS One 2020;15(8):e0237587.
8. Tomaszewski MR, Gillies RJ. The Biological Meaning of Radiomic Features. Radiology 2021;298(3):505-516.
9. Jalnefjord O, Montelius M, Arvidsson J, et al. Data‐driven identification of tumor subregions based on intravoxel incoherent motion reveals association with proliferative activity. Magnetic Resonance in Medicine. 2019;82(4):1480-1490.
Figures