3740
NMR-based metabonomic fingerprinting reveals temporal and spatial heterogeneities of metabolic characterization in colorectal cancer tissue1Radiology Department, Second Affiliated Hospital of Shantou University Medical College, Shantou City, China
Synopsis
This study aimed to profile the metabolic differences of colorectal cancer tissues (CCT) in different stages and sites, as compared with their adjacent noncancerous tissues (ANT), to investigate the temporal and spatial heterogeneities of metabolic characterization. Our NMR-based metabonomics fingerprinting revealed that many of the metabolite levels were significantly altered in CCT as compared with ANT, indicating deregulations of glucose metabolism, one-carbon metabolism, glutamine metabolism, amino acid metabolism, fatty acid metabolism, TCA cycle, choline metabolism, ect. Significant metabolic differences were found in CRC tissues at different pathological stages and sites, suggesting temporal and spatial heterogeneities of metabolic characterization in CCT.
Background
Metabolic reprogramming is pivotal to sustain cancer growth and progression. Proton nuclear magnetic resonance spectroscopy (1H-NMR)-based metabolomics has been shown to be accurately capable of determining the metabolic characteristics of colorectal cancer (CRC) patients [1-2]. Recently, we have identified distinct NMR-based fecal, serum and urine metabolic signatures respectively, which were be able to discriminate early stage of CRC patients from healthy controls, highlighting the potential utility of NMR-based biofluids metabolomics fingerprinting as noninvasive predictors of earlier diagnosis in CRC patients [2-8]. However, body fluid metabolism is sensitive to many factors, such as genetic composition, food and environment. In situ targeted detection of cancer tissues is the most direct method to identify tumor related metabolic biomarkers. This study aimed to profile the metabolic differences of CRC tissues in different stages and sites, as compared with their paired adjacent noncancerous tissues, to investigate the temporal and spatial heterogeneities of metabolic characterization in CRC tissues. Such information, eye of the storm in tumor metabolism, would provide a conclusive evidence for the optimal metabolic model construction through a combination of multi-source body fluid metabolism for CRC early detection.Methods
One hundred and six CRC patients with a scheduled colonic resection joined this study, and provided colorectal cancer tissue (CCT) and adjacent noncancerous tissue (ANT, ~1 cm away from the tumor). Tissue samples were extracted with methanol/chloroform solution and the resulting supernatant was dried under vacuum for a minimum of 18 h. The lyophilized power of tissue samples was extracted with PBS/D20 buffer and a stock solution of TSP/D20 was added to each supernatant prior to analysis by 1H NMR spectroscopy. 600Mhz 1H NMR spectra of tissues were recorded by using a standard 1D Carr-Purcell-Meiboom-Gill (CPMG) pulse sequence as previously described [8]. All spectra were preprocessed and then bucketed with the equal width of 0.002ppm. The region of δ 4.4~ 5.6 was discarded to eliminate the imperfect water suppression. Each bucket was normalized to the total integral of the spectrum prior to OPLS-DA using the SIMCA-P+ program (version 14.1). Pattern recognition was applied on NMR processed data to acquire the metabolic differences of CRC tissues in different stages and different locations. Finally, significant metabolic pathways were analyzed using MetaboAnalyst software, with a pathway impact value of greater than or equal to 0.1 and –log(p) value of no less than 2.Results
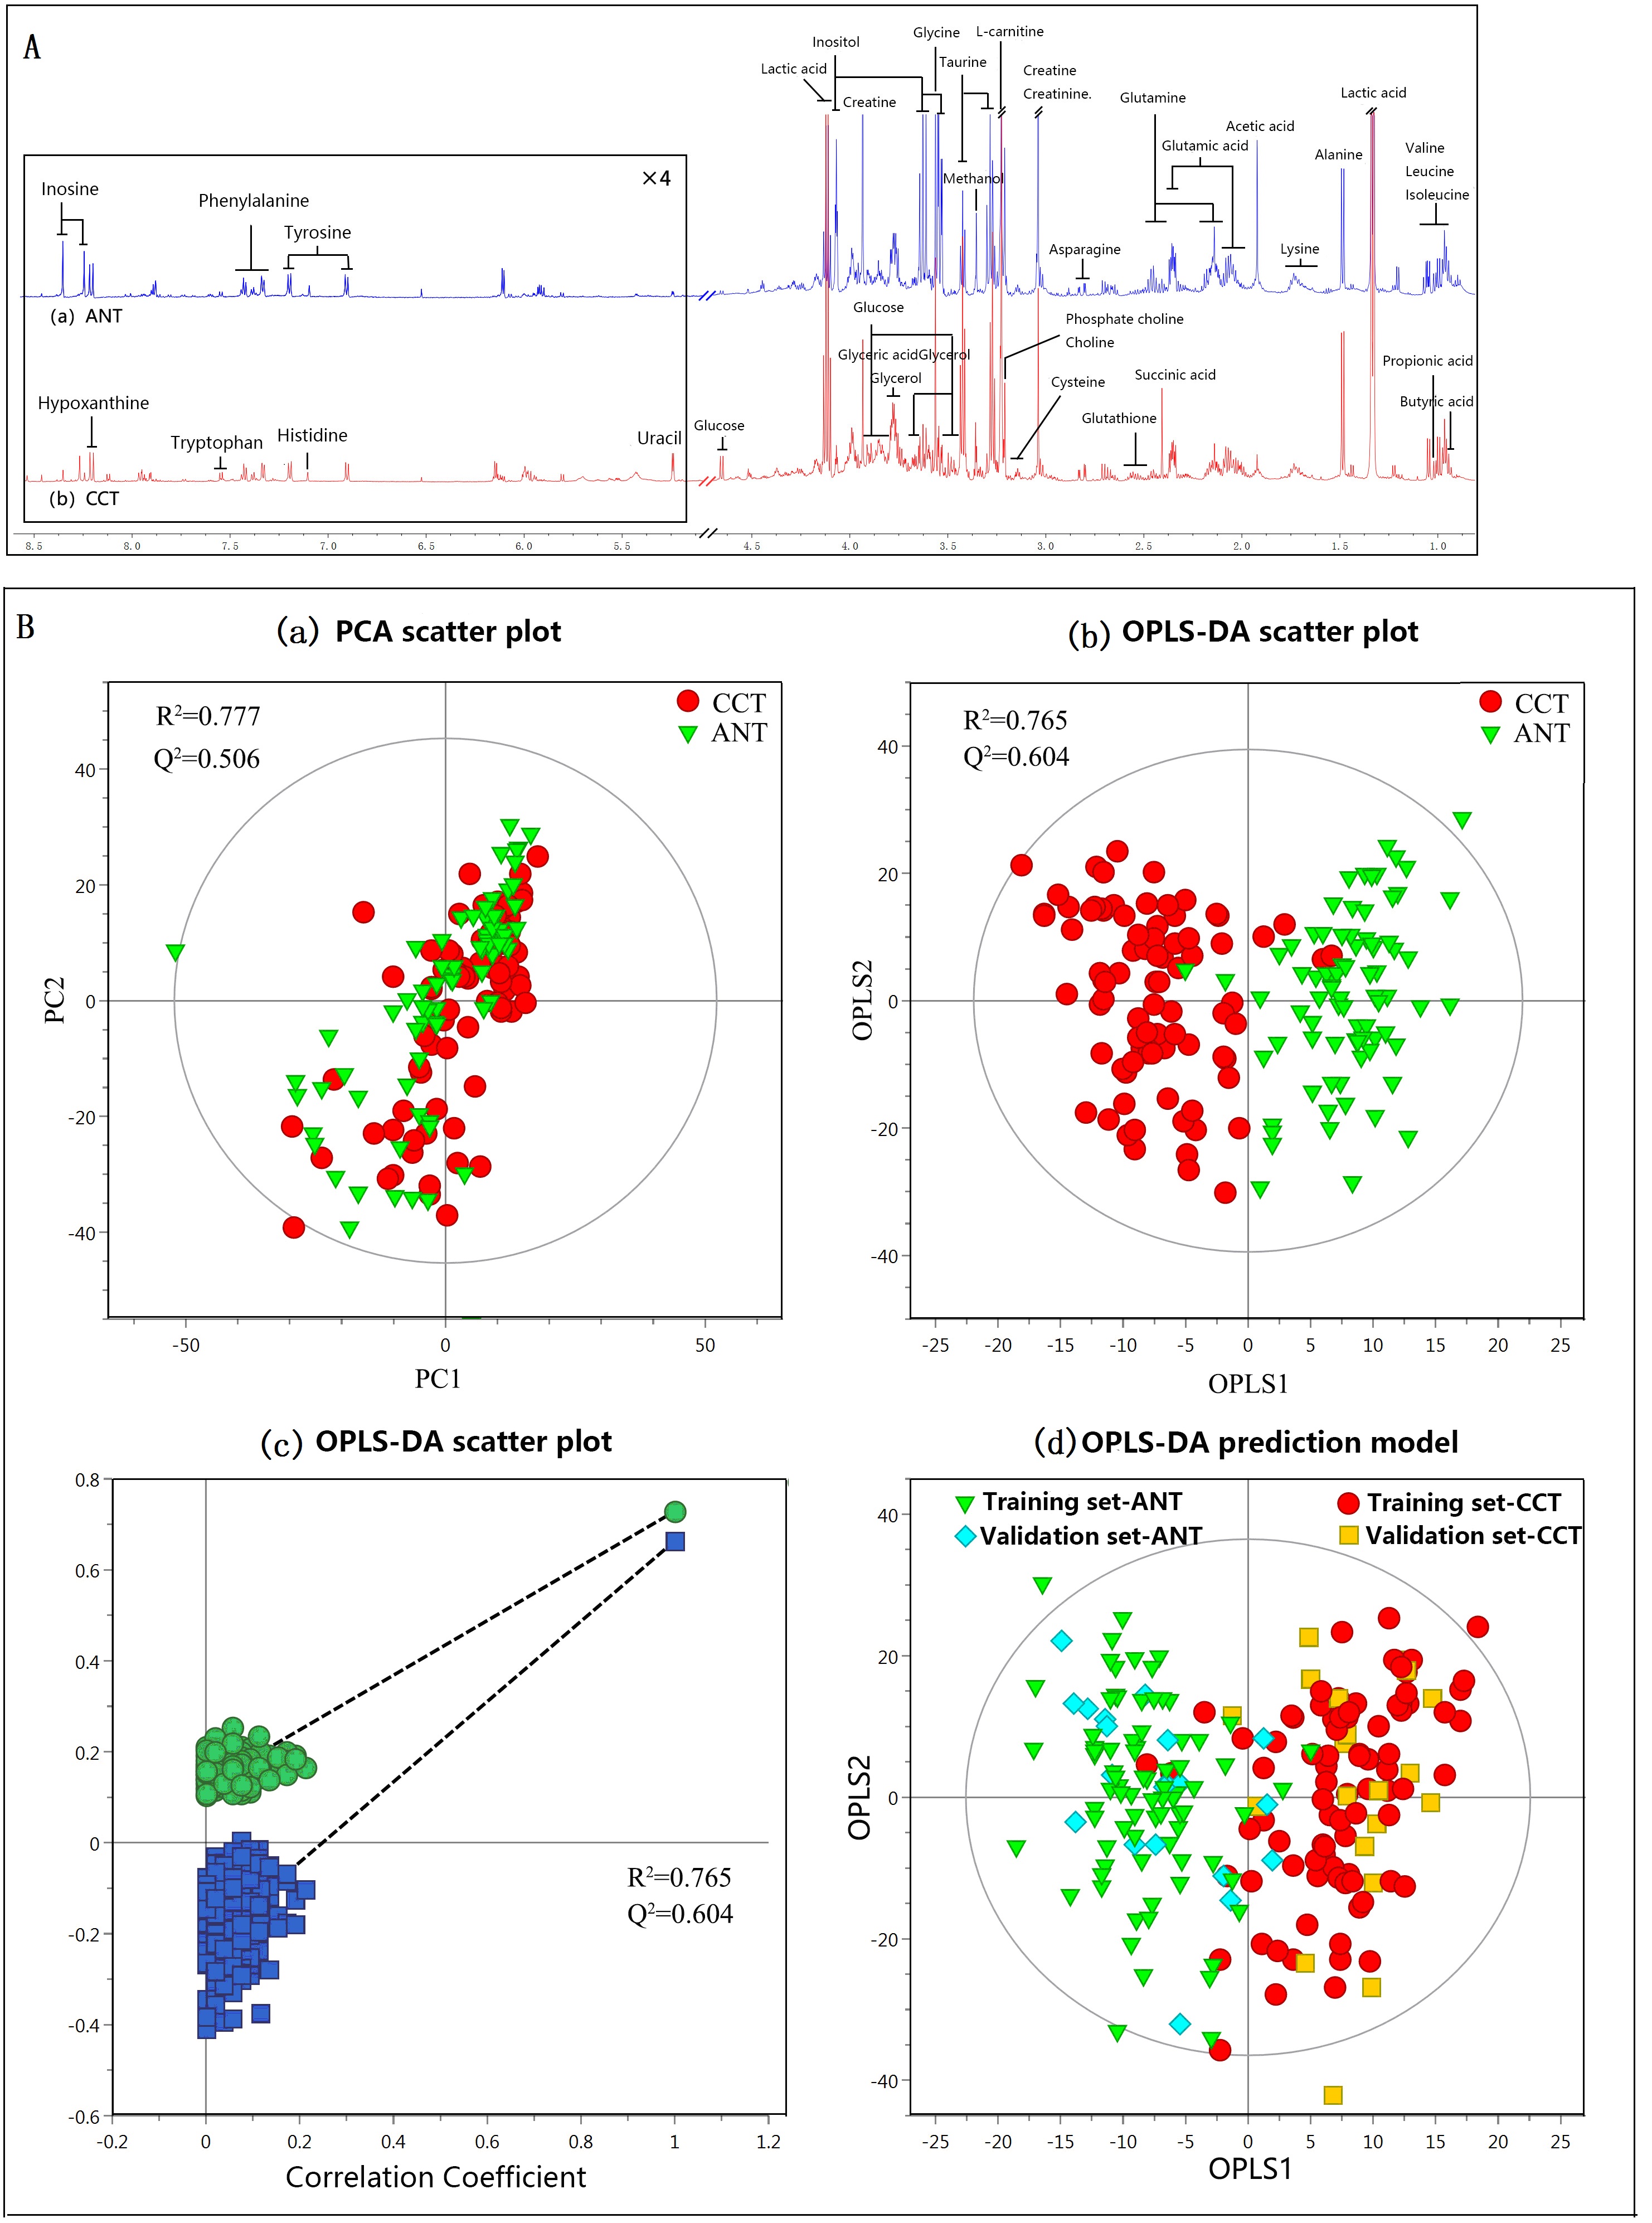
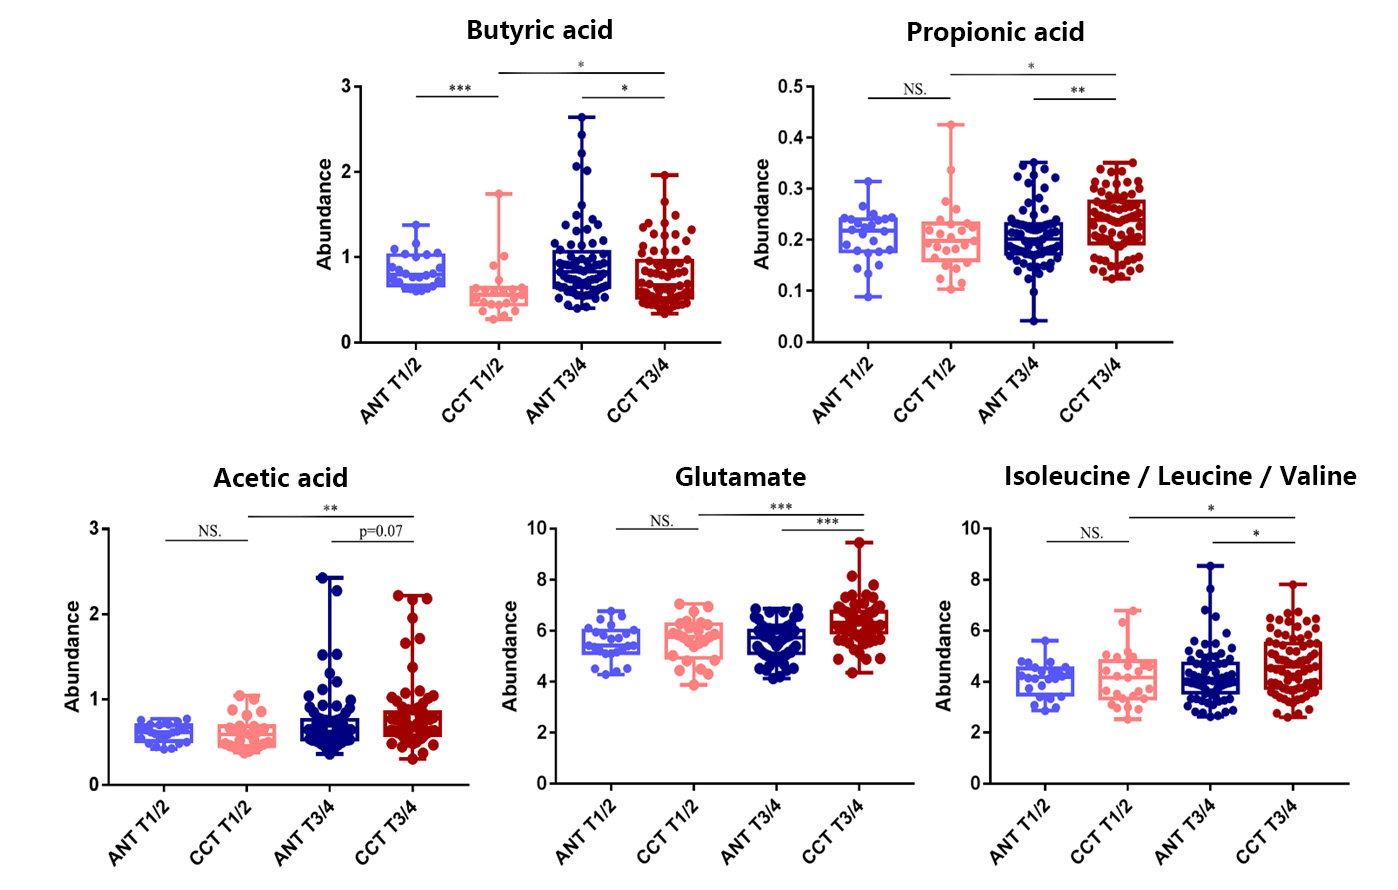
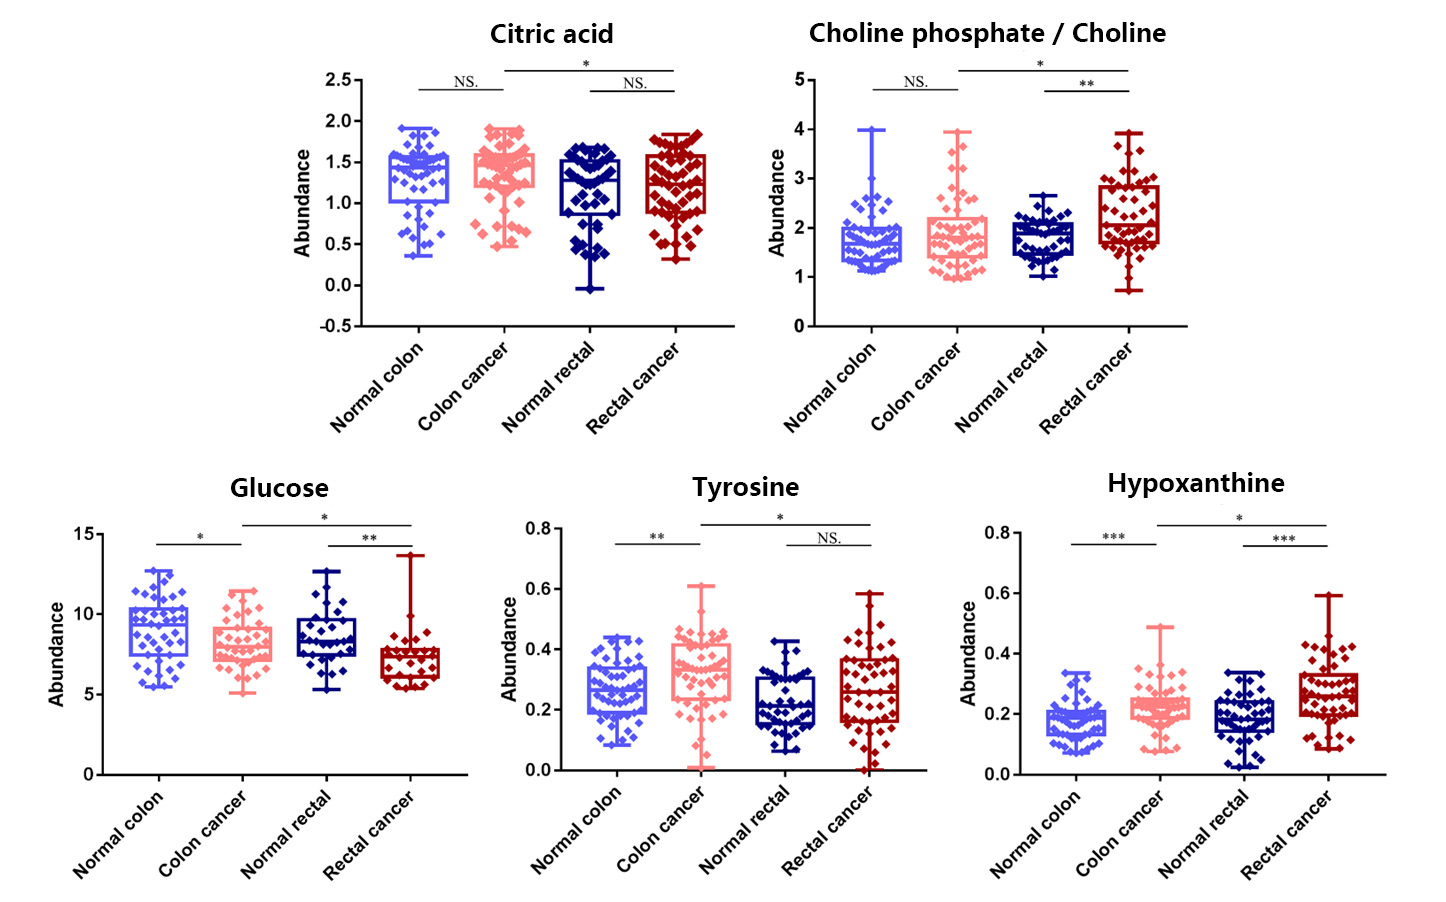
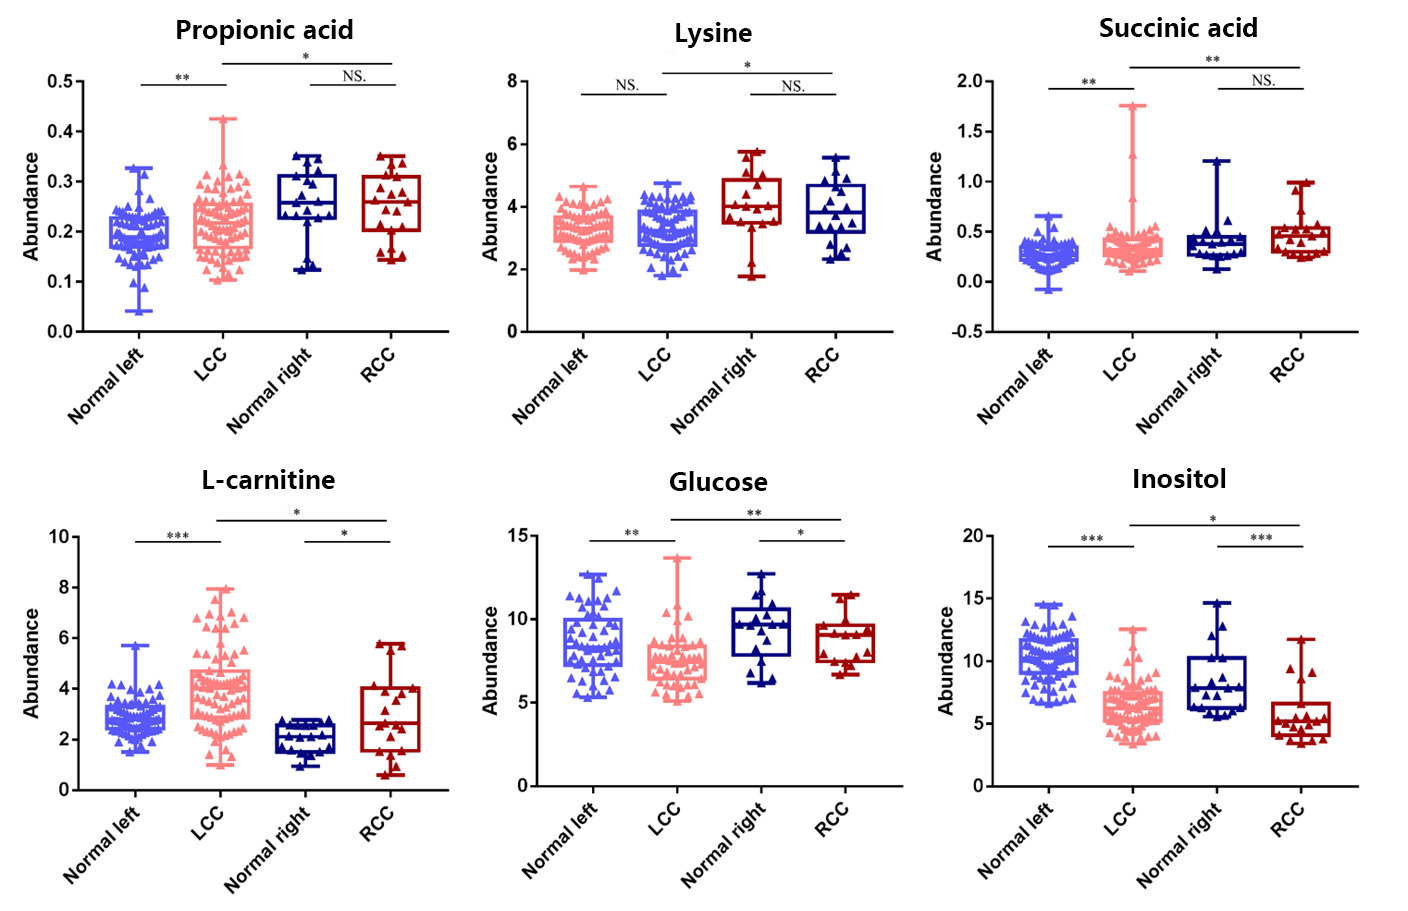
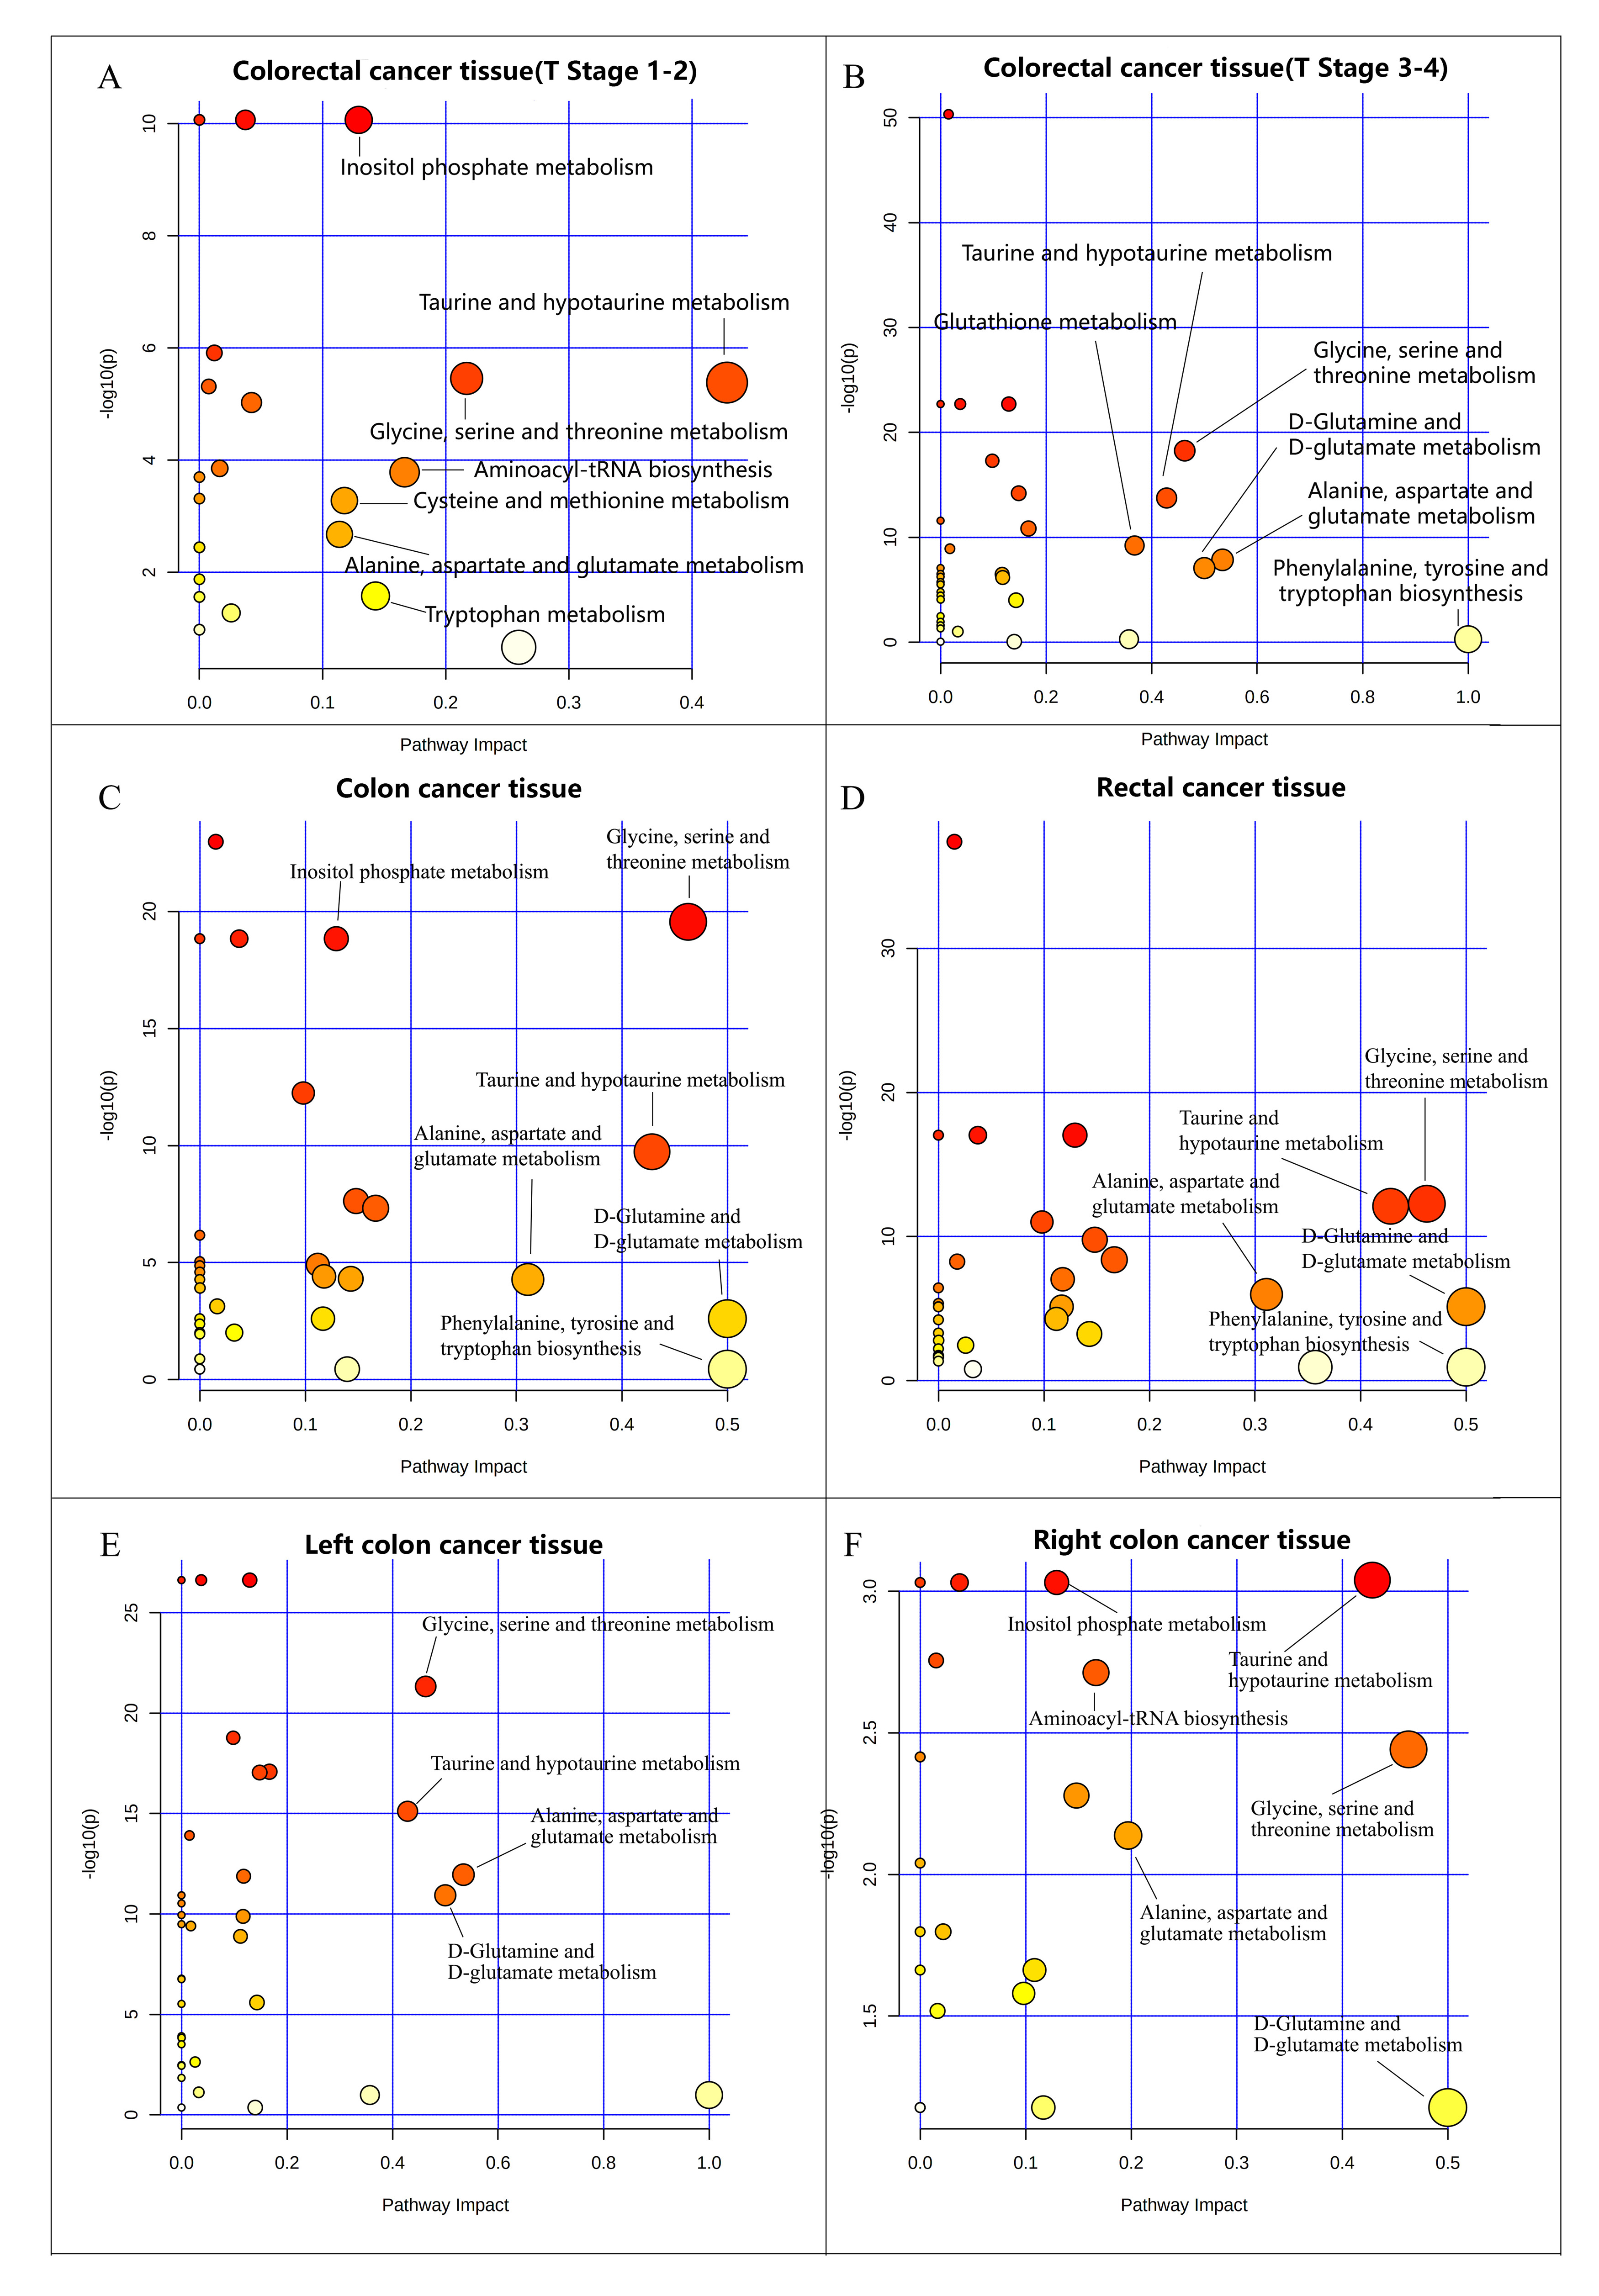
Representative 600 MHz 1H-NMR spectra of tissue specimen from colorectal cancer tissue (CCT) and corresponding adjacent noncancerous tissue (ANT) were shown in Fig 1a.Good discrimination between CCT and ANT was achieved by OPLS-DA scores plot generated from 1H NMR tissue spectra (Fig.1b). Model parameters of 200 permutation analysis indicated a good fit, with R2Y of 0.765 and Q2 of 0.604, respectively (Fig. 1c). To further assess the prediction ability of the model to unknown samples, 80% of samples were randomly selected to construct OPLS-DA model, which was then used to predict the remaining 20% of samples. As can be seen in Fig 1d, CCT of the testing set were correctly located in the region of CCT from the training set, and the same results were obtained in the testing set of ANT samples. As can be seen in Fig 2, advanced stage of CCT (T3-4) exhibited higher levels of butyrate, propionate, actate, leucine, isoleucine, valine and glutamate, compared to early stage of CCT (T1-2). Also, the differences of tissues metabolism in different locations of CRC were statistically significant. Higher amounts of citrate, glucose, tyrosine, and lower levels of choline, phosphate and hypoxanthine were observed in colon cancer tissues, as compared to those in rectal cancer tissues (Fig 3). Furthermore, the amounts of L-carnitine and inositol were significantly higher, while propionate, lysine, succinate and glucose were markedly decreased in left colon cancer tissues, compared to those in right colon tissues (Fig 4). Finally, the importance of metabolic pathway analysis showed (Figure 5) that taurine and hypotaurine metabolism was the most affected disturbed pathway in T1-2 CRC, while alanine, aspartate and glutamate metabolism was the most affected pathway in T3-4 CRC. Perturbation of glycine, serine and threonine metabolism was most strongly associated with cancer progression in both colon and rectum. Moreover, abnormal metabolism of alanine, aspartate and glutamate was found to be significant in left colon cancer tissues, while disorders of glycine, serine and threonine were evident in right colon cancer tissue.Conclusion
600MHz NMR-based metabonomics fingerprinting of CCT in this study revealed that many of the metabolite levels were significantly altered as compared with ANT, indicating deregulations of metabolic pathways, such as glucose metabolism, one-carbon metabolism, glutamine metabolism, amino acid metabolism, fatty acid metabolism, TCA cycle, choline metabolism and redox homeostasis. Significant metabolic differences were found in CRC tissues at different pathological stages and different sites, suggesting temporal and spatial heterogeneities of metabolic characterization in colorectal cancer tissues.Acknowledgements
This study was supported by grants from the National Natural Science Foundation of China (82071973, 82020108016) and Natural Science Foundation of Guangdong Province (2020A1515011022).References
1. Bezabeh T., et al, NMR Biomed, 2009, 22(6): 593-600. 2. Lin Y., et al. Oncotarget, 2016. 16 (10). 3. Y Lin, et al. ISMRM.21 (2013). 4. Y Lin, et al. ISMRM.22 (2014). 5. Y Lin, et al. ISMRM.23 (2015) 6. Y Lin, et al. ISMRM.24 (2016) 7. Y Lin, et al. ISMRM.25 (2017) 8. Y Lin, et al. Int. J. Cancer, 2019:145, 1679-1689Figures