3738
Detection of prostatic peripheral zone cancer based on quantitative analysis of 3.0T MR Diffusion Tensor Imaging1The Department of Radiology, General Hospital of Ningxia Medical University,, YinChuan, China, 2GE Healthcare, Beijing, China, 3The Department of Radiology, General Hospital of Ningxia Medical University,, Yinchuan, China
Synopsis
In this study, we aim to evaluate the diagnostic performance of diffusion tensor imaging (DTI) in detecting prostatic peripheral zone cancer and to deduce its clinical utility. The area under curve (AUC) of the receiver operating characteristic (ROC) curves was used to evaluate the diagnostic efficiency of ADC value, FA value and their combination. The diagnostic threshold values of ADC and FA were also determined. It was concluded that DTI quantitative indexes has moderately high diagnostic accuracy in detecting prostate cancer , while the ADC value had higher diagnostic efficiency than the FA value.
Introduction
Prostate cancer (PCa) is the second leading cause of death in men[1], and recently its incidence in young adult men has increased in most countries[2]. Diffusion tensor imaging (DTI) technique can derive multiple quantitative indexes, such as apparent diffusion coefficient (ADC) and fractional anisotropy (FA), which can quantitatively characterize the degree of diffusion anisotropy of water molecules and can provide valuable information in the differential diagnosis of PCa[3, 4]. In this study, we aim to evaluate the diagnostic performance of DTI in detecting prostatic peripheral zone cancer, and we conducted a comparative analysis of the tissue structure characteristics of peripheral cancerous and noncancerous regions from the perspective of radiography.Material and Methods
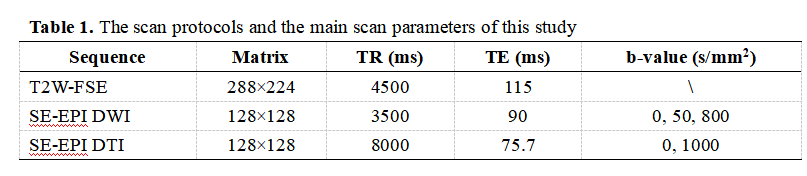
25 patients diagnosed with prostatic peripheral zone cancer (average age: 69.44±8.54y) and 40 patients diagnosed with benign prostatic hyperplasia (BPH) and / or chronic prostatitis (CP) (average age: 68.68±8.32y) were retrospectively enrolled in our study. All MR examinations were implemented on a 3.0T MR scanner (Signa Excite HD 3.0, GE Healthcare, Milwaukee, WI) equipped with a 32-channel phased-array coil. The scan protocols and the main scan parameters were listed in Table 1.The image raw data were transferred to ADW 4.3 workstation for post-processing, and the region of interest (ROI) was outlined on the T2-weighted fast spin echo (T2W-FSE) and DWI images as references. The hypointensity areas in T2W-FSE images and ADC maps which corresponding to the positive regions of the biopsy was defined as the carcinoma foci, and the ADC and FA values were measured in these foci. Statistical analysis was performed using the MedCalc software package (version 11.4.2.0). Independent Student’s t-test were implemented to compare the diffusion indexes of two groups. The performance of the using ADC value, FA value and their combination to diagnose the prostatic peripheral zone cancer respectively were evaluated by calculating the area under curve (AUC) of the receiver operating characteristic (ROC), and the diagnostic threshold values of ADC and FA were determined subsequently.Results
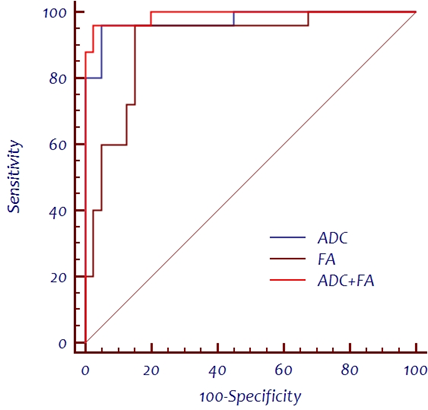
The ADC values of the cancerous and non-cancerous groups were (0.89±0.19)×10-3 mm2/s and (1.46±0.23)×10-3 mm2/s, respectively, while the FA values were 0.25±0.05 and 0.17±0.04 (Figure 1). There was significant difference in both ADC and FA values between two groups (t values were 10.414 and -7.789, respectively, P < 0.05). ROC curve analysis showed that ADC values, FA values and their combination had high diagnostic performance in detecting prostatic peripheral zone cancer, with AUC values of 0.974, 0.907 and 0.990, respectively, as was shown in Figure 2. In pairwise comparison, there was no statistically significant difference between the performance of the ADC values and the FA values, or between the performance of the ADC values and their combination (z values were 1.498 and 1.312, respectively, P > 0.05). In comparison, the performance of FA values was significantly different from that of their combination (z = 2.151, P < 0.05). ADC values had a sensitivity of 96.0% and a specificity of 95.0%, its threshold value diagnostic was 1.135×10⁻³ mm2/s. FA values had a sensitivity of 96.0% and a specificity of 85.0% and its threshold value was 0.196.Discussion and Conclusion
Our study demonstrated that both the ADC and FA values showed high accuracy in the diagnosis of prostatic peripheral zone cancer, and there is no statistically significant difference between them. The combination of these two diffusion indexes had a higher diagnostic accuracy than using them respectively. Tamada et al[5] found that the mean ADC value of the prostatic peripheral zone cancer and the normal peripheral zone was (1.02±0.25)×10-3 mm2/s and (1.80±0.27)×10-3 mm2/s, respectively (P<0.01), which was consistent with our results. Gürses B et al[4] claimed that the FA values of PCa were higher than that of prostatitis and normal prostate tissue, which further supports our results.In conclusion, DTI quantitative indexes (ADC and FA values) may be potential in the differential diagnosis of prostatic peripheral zone cancer.Acknowledgements
We appreciate the assistance of The Department of Radiology,The General Hospital of Ning Xia Medical University during the preparation of this manuscript.We thank all of the participants of this study in our team.References
1. Wang N, Liu S, Yang L. Interpretation of the 2018 global cancer statistics report[J]. Journal of Multidisciplinary Cancer Management, 2019, 5(01): 87-97.
2. Culp M B B, Soerjomataram I, Efstathiou J A, et al. Recent global patterns in prostate cancer incidence and mortality rates[J]. European urology, 2020, 77(1): 38-52.
3. Esen M, Onur M R, Akpolat N, et al. Utility of ADC measurement on diffusion-weighted MRI in differentiation of prostate cancer, normal prostate and prostatitis[J]. Quantitative imaging in medicine and surgery, 2013, 3(4): 210.
4. Gürses B, Tasdelen N, Yencilek F, et al. Diagnostic utility of DTI in prostate cancer[J]. European journal of radiology, 2011, 79(2): 172-176.
5. Tamada T, Sone T, Jo Y, et al. Apparent diffusion coefficient values in peripheral and transition zones of the prostate: comparison between normal and malignant prostatic tissues and correlation with histologic grade[J]. Journal of Magnetic Resonance Imaging: An Official Journal of the International Society for Magnetic Resonance in Medicine, 2008, 28(3): 720-726.
Figures