3734
Quantitative T2 mapping in early prediction of treatment response to chemoradiation for patients with local advanced rectal cancer1Affiliated Hospital of Jiangnan University, Wuxi, China, 2MR Research, GE Healthcare, Nanjing, China, 3GE Healthcare, Nanjing, China
Synopsis
This study aimed to investigate the feasibility of T2 mapping in predicting the response to chemoradiation (CRT) for patients with local advanced rectal cancer (LARC). Thirty-five LARC patients were measured with T2 mapping before-, during- and after-CRT. Resultant T2 values during- and after-CRT, and the T2 decrease ratio of before- to during-CRT were correlated significantly with tumor regression grade. Compared to poor responders, good responders showed lower T2 during- and after-CRT and higher T2 decrease ratio of before- to during-CRT. Therefore, quantitative T2 mapping may be useful for predicting the response to CRT for LARC patients.
Introduction
Chemoradiotherapy (CRT) effect is crucial in local advanced rectal cancer (LARC) management1. Certain amount of patients not only fails to benefit from CRT, but also develops toxicity and tumor progression during treatment. Recently, no reliable predictor has been identified to distinguish responders from non-responders at early period of CRT.T2 mapping, as a quantitative MRI measuring T2 relaxation time of tissues, has been widely used in evaluation of cartilage and musculature diseases2 and myocardium3. With these applications, we assumed that T2 mapping may also have clinical potential for assessing the response to CRT in LARC. However, no such study has explored this.
Therefore, this study aimed to investigate the clinical potential of quantitative T2 mapping in early prediction of pathological response to CRT for LARC patients.
Materials and Methods
Patients:35 patients (19 men, 16 women; mean age: 64 years, range from 31 to 81 years), pathologically diagnosed with rectal adenocarcinoma between January 2018 and April 2021, were recruited in this study. Each patient received a dose cycle of CapeOx (oxaliplatin [130 mg/m2, day 1] plus capecitabine (825 mg/m2, days 1–14, once every 3 weeks) before radiotherapy. The subsequent course consisted of a total radiation dose of 50 Gy (delivered in 25 daily fractions of 2 Gy, five fractions per week) and capecitabine lasting for 5 weeks. The pathological tumor regression grade (TRG) was classified according to Mandard et al.4. Patients with pathological complete or near-complete response (tumor regression grade, TRG 1–2) were classified as good responders (GR), while all others (TRG 3–5) were classified as non-good responders (non-GR).
MRI experiment:
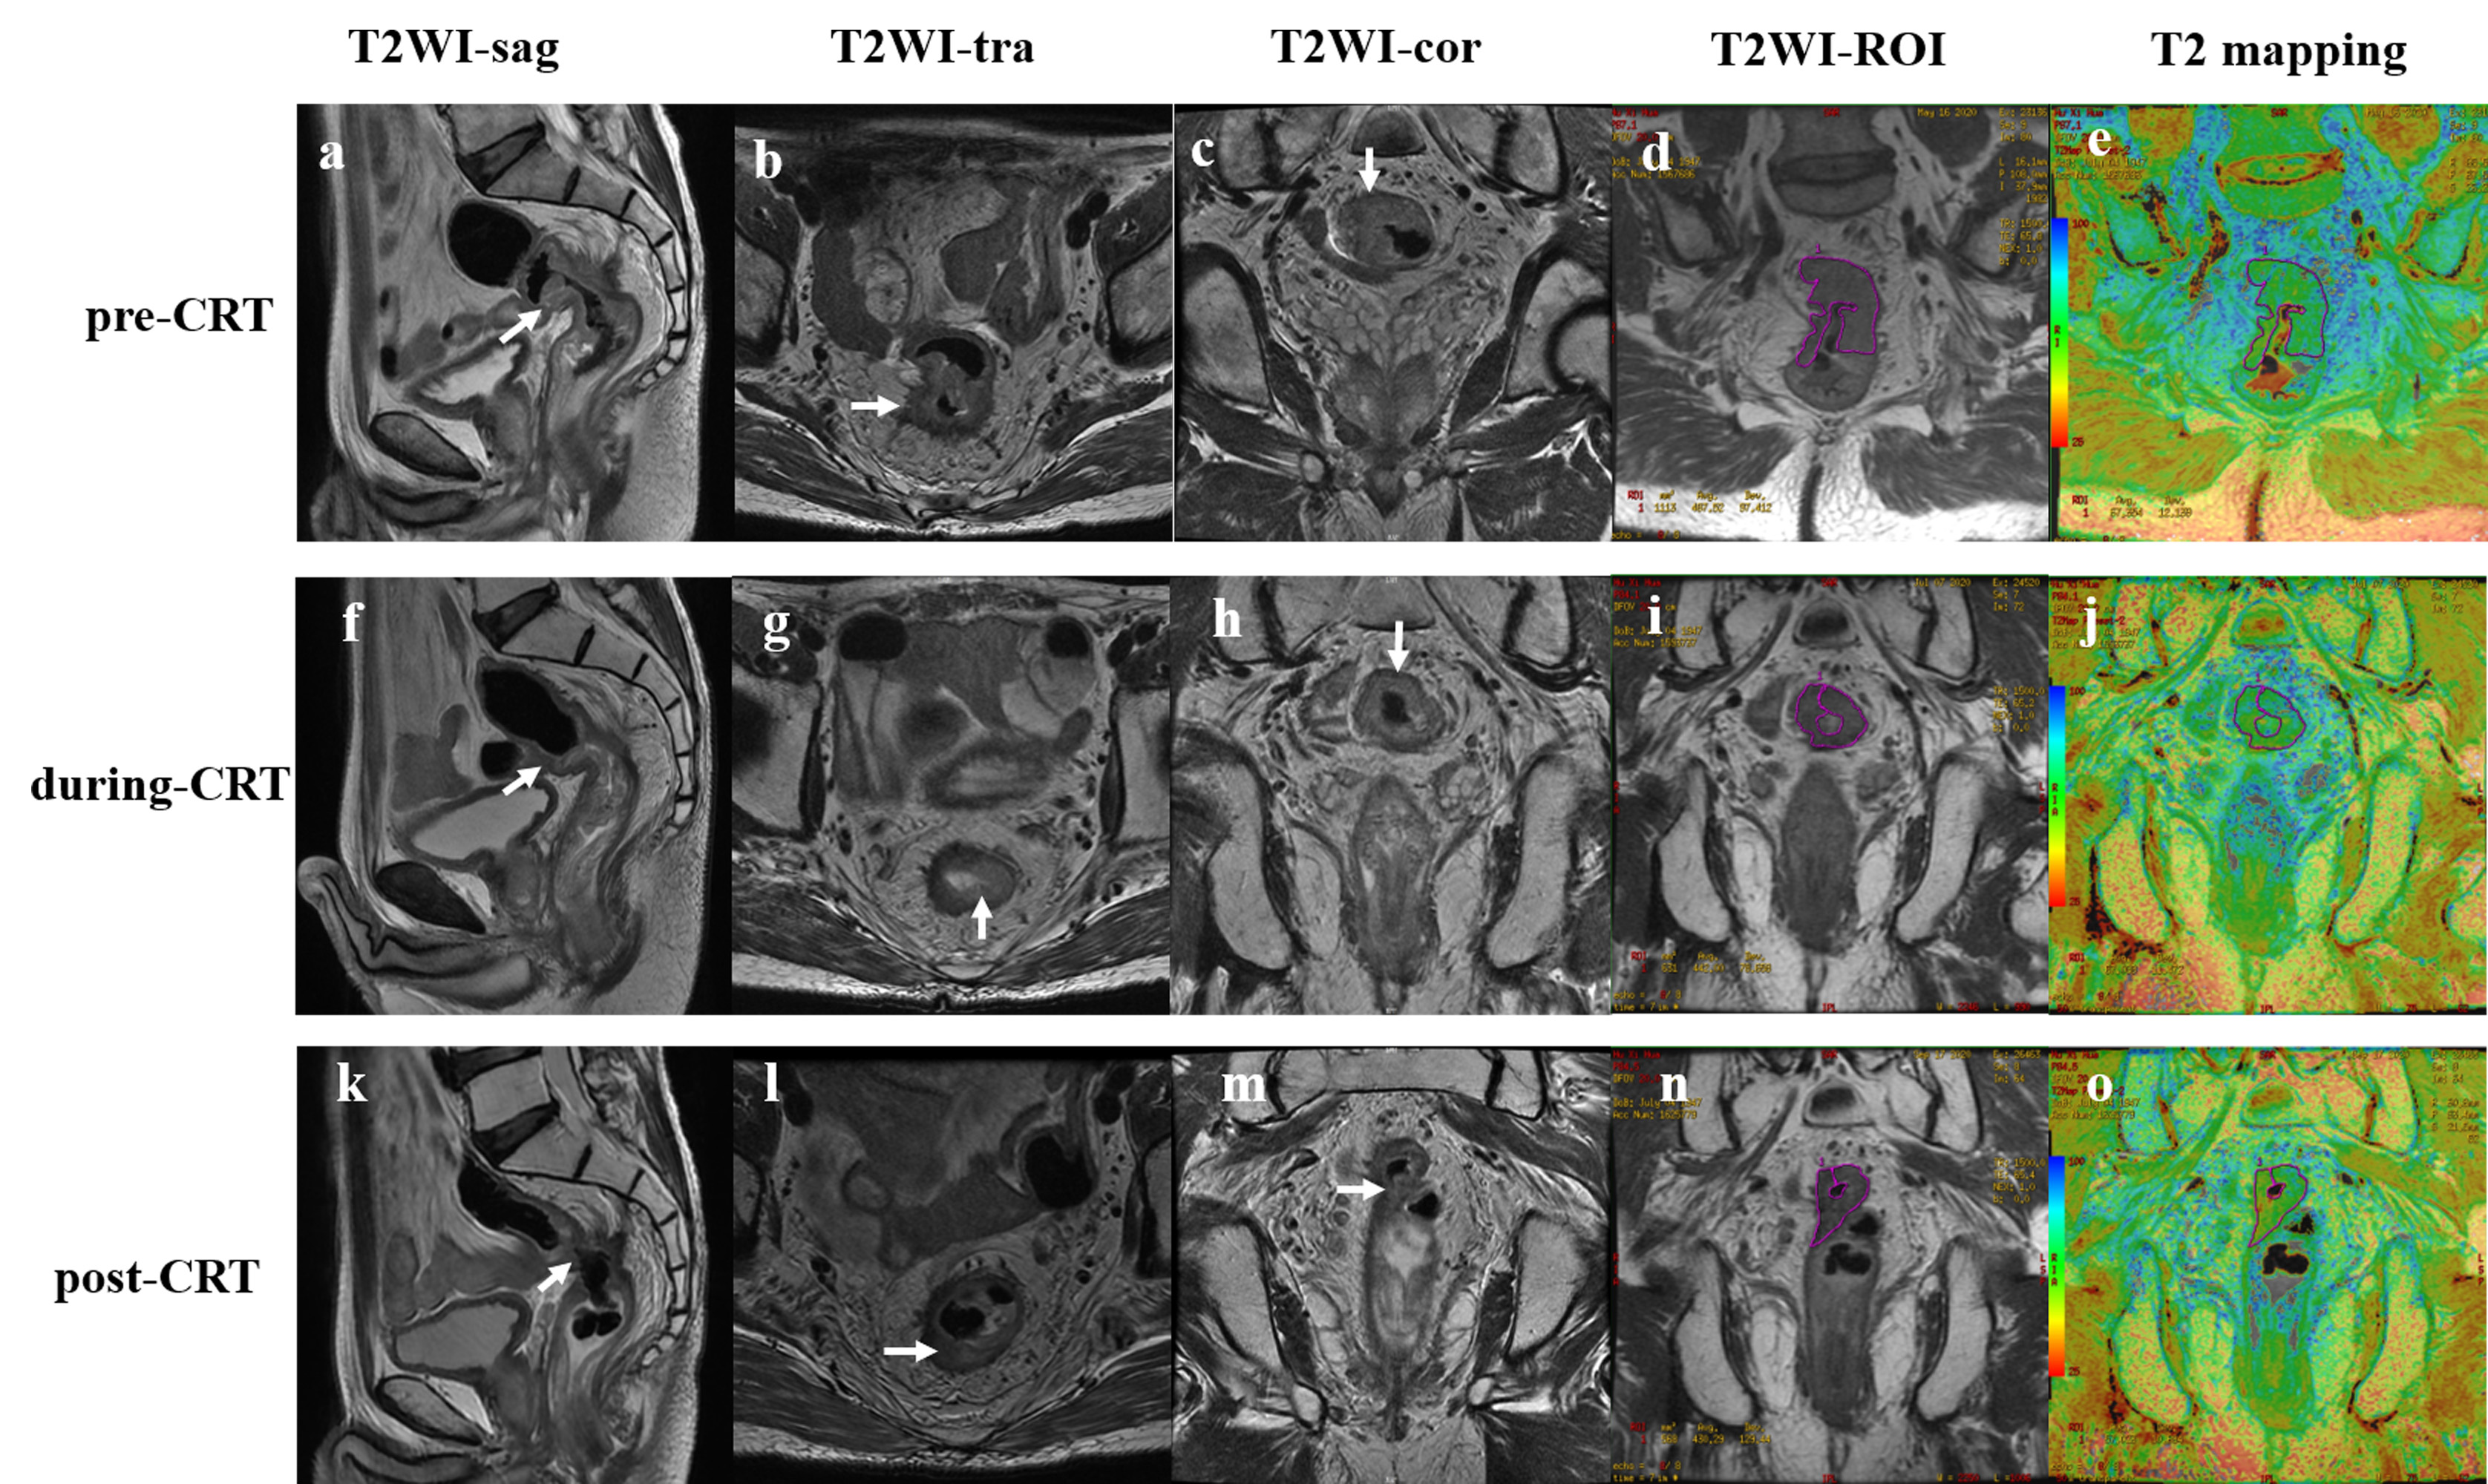
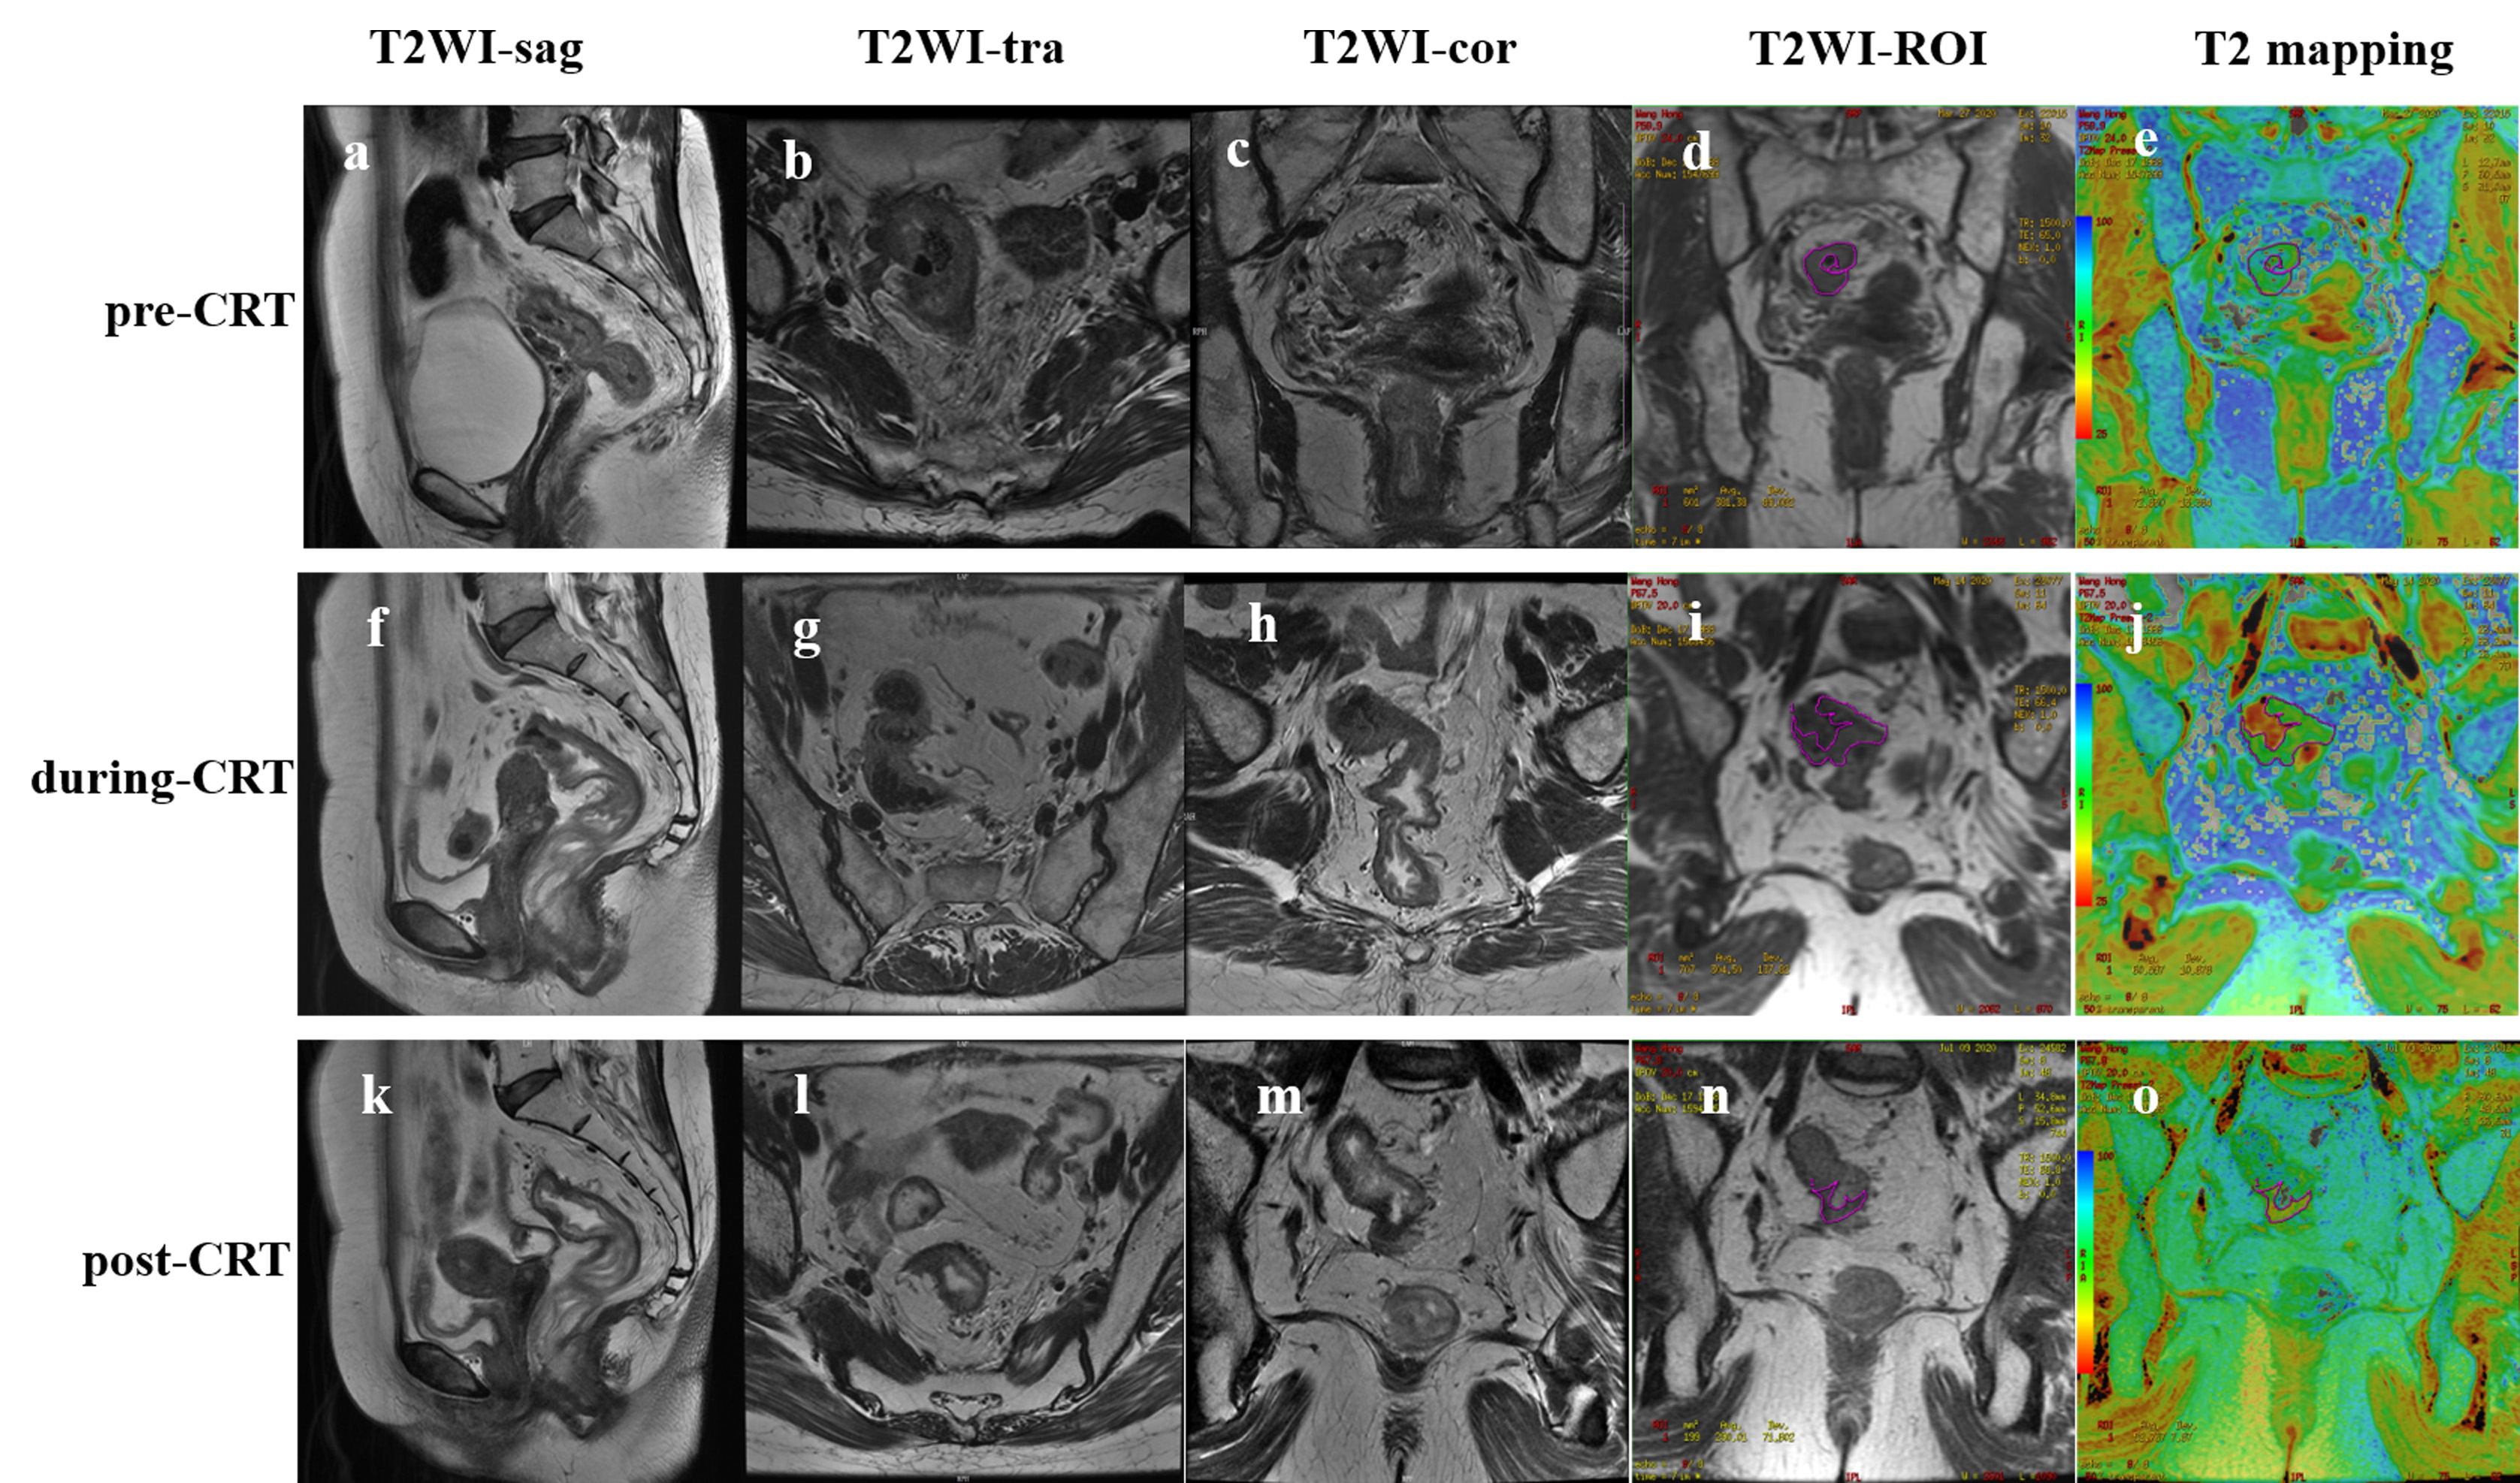
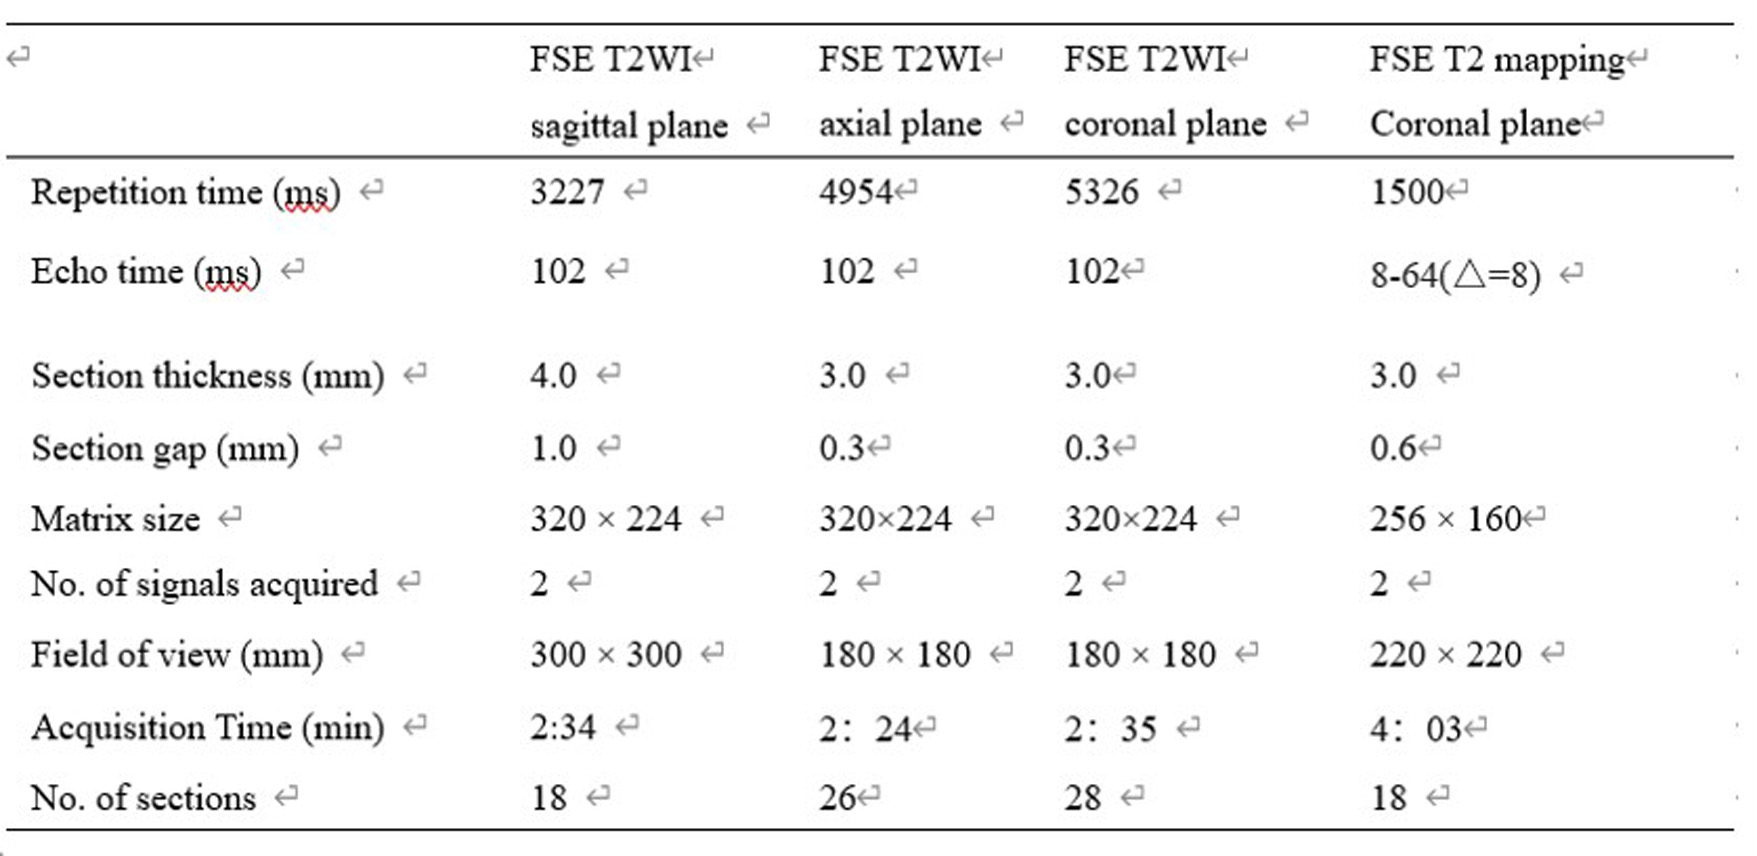
MRI experiments were performed for each patient at pre-CRT, at the end of CRT (during-CRT), and post-CRT on an 3.0-Tesla MR system (750w; GE Healthcare, USA) with a 16-channel phased-array body coil employed. High-resolution T2-weighted images at axial, sagittal, and coronal views, as well as coronal T2 mapping were measured. Scan parameters were shown in Table 1.
Data analysis:
T2 mapping was fitted with mono-exponential model in vendor-provided software on GE advanced workstation 4.6.
The region of interest (ROI) of the entire tumor was drawn along the tumor border on each tumor slice based on T2W images, and drawn freehand on FSE images at TE of 65ms, along the border of tumor on each slice.
A senior and a junior radiologist who were blinded to the study design and diagnoses, performed the measurements. Average T2 values over two measurements were recorded to avoid the measurement bias. The junior radiologist repeated the measurements 2 weeks later. In addition, the T2 decrease ratio (ΔT2 during) of before- (T2pre) to during-CRT (T2during) was also calculated using the equation defined as: ΔT2 during= (T2pre-T2during)×100%/T2 pre.
All statistic analyses were performed in SPSS version 22.0 or MedCalc Statistical Software version 18.2. Intra- and inter-observer correlations for T2 values were analyzed by estimating the intraclass correlation coefficients (ICCs). Mann-Whitney U test was used to test the difference of T2 at different time points relative to CRT or ΔT2 during between GR and non-GR. Histopathological correlations were analyzed using the Spearman’s correlation test. The area under the receiving operating characteristic curves (AUC) was used to separately evaluate the diagnostic efficacy of T2 mapping at different time points relative to CRT or ΔT2 during in differentiating GR group from non-GR group. DeLong test was further used to compare the differences among these AUCs. P<0.05 was considered statistic significance.
Results
Of 35 patients, 16 (46%) and 19 (54%) were diagnosed as GRs and non-GRs. Using ICC analysis, excellent intra- and inter-observer agreement was obtained for T2 measurements at different time points to CRT (all ICCs >0.85) between radiologists.GR group showed significantly lower T2 than non-GRs during (P=0.003) and after CRT (P<0.001), which were significantly correlated with TRG (r2=0.869, p<0.001). In addition, the T2 decrease ratio of before- to during- CRT (ΔT2 during) was significantly higher in GR group than non-GR group (P<0.001, Fig.1&2).
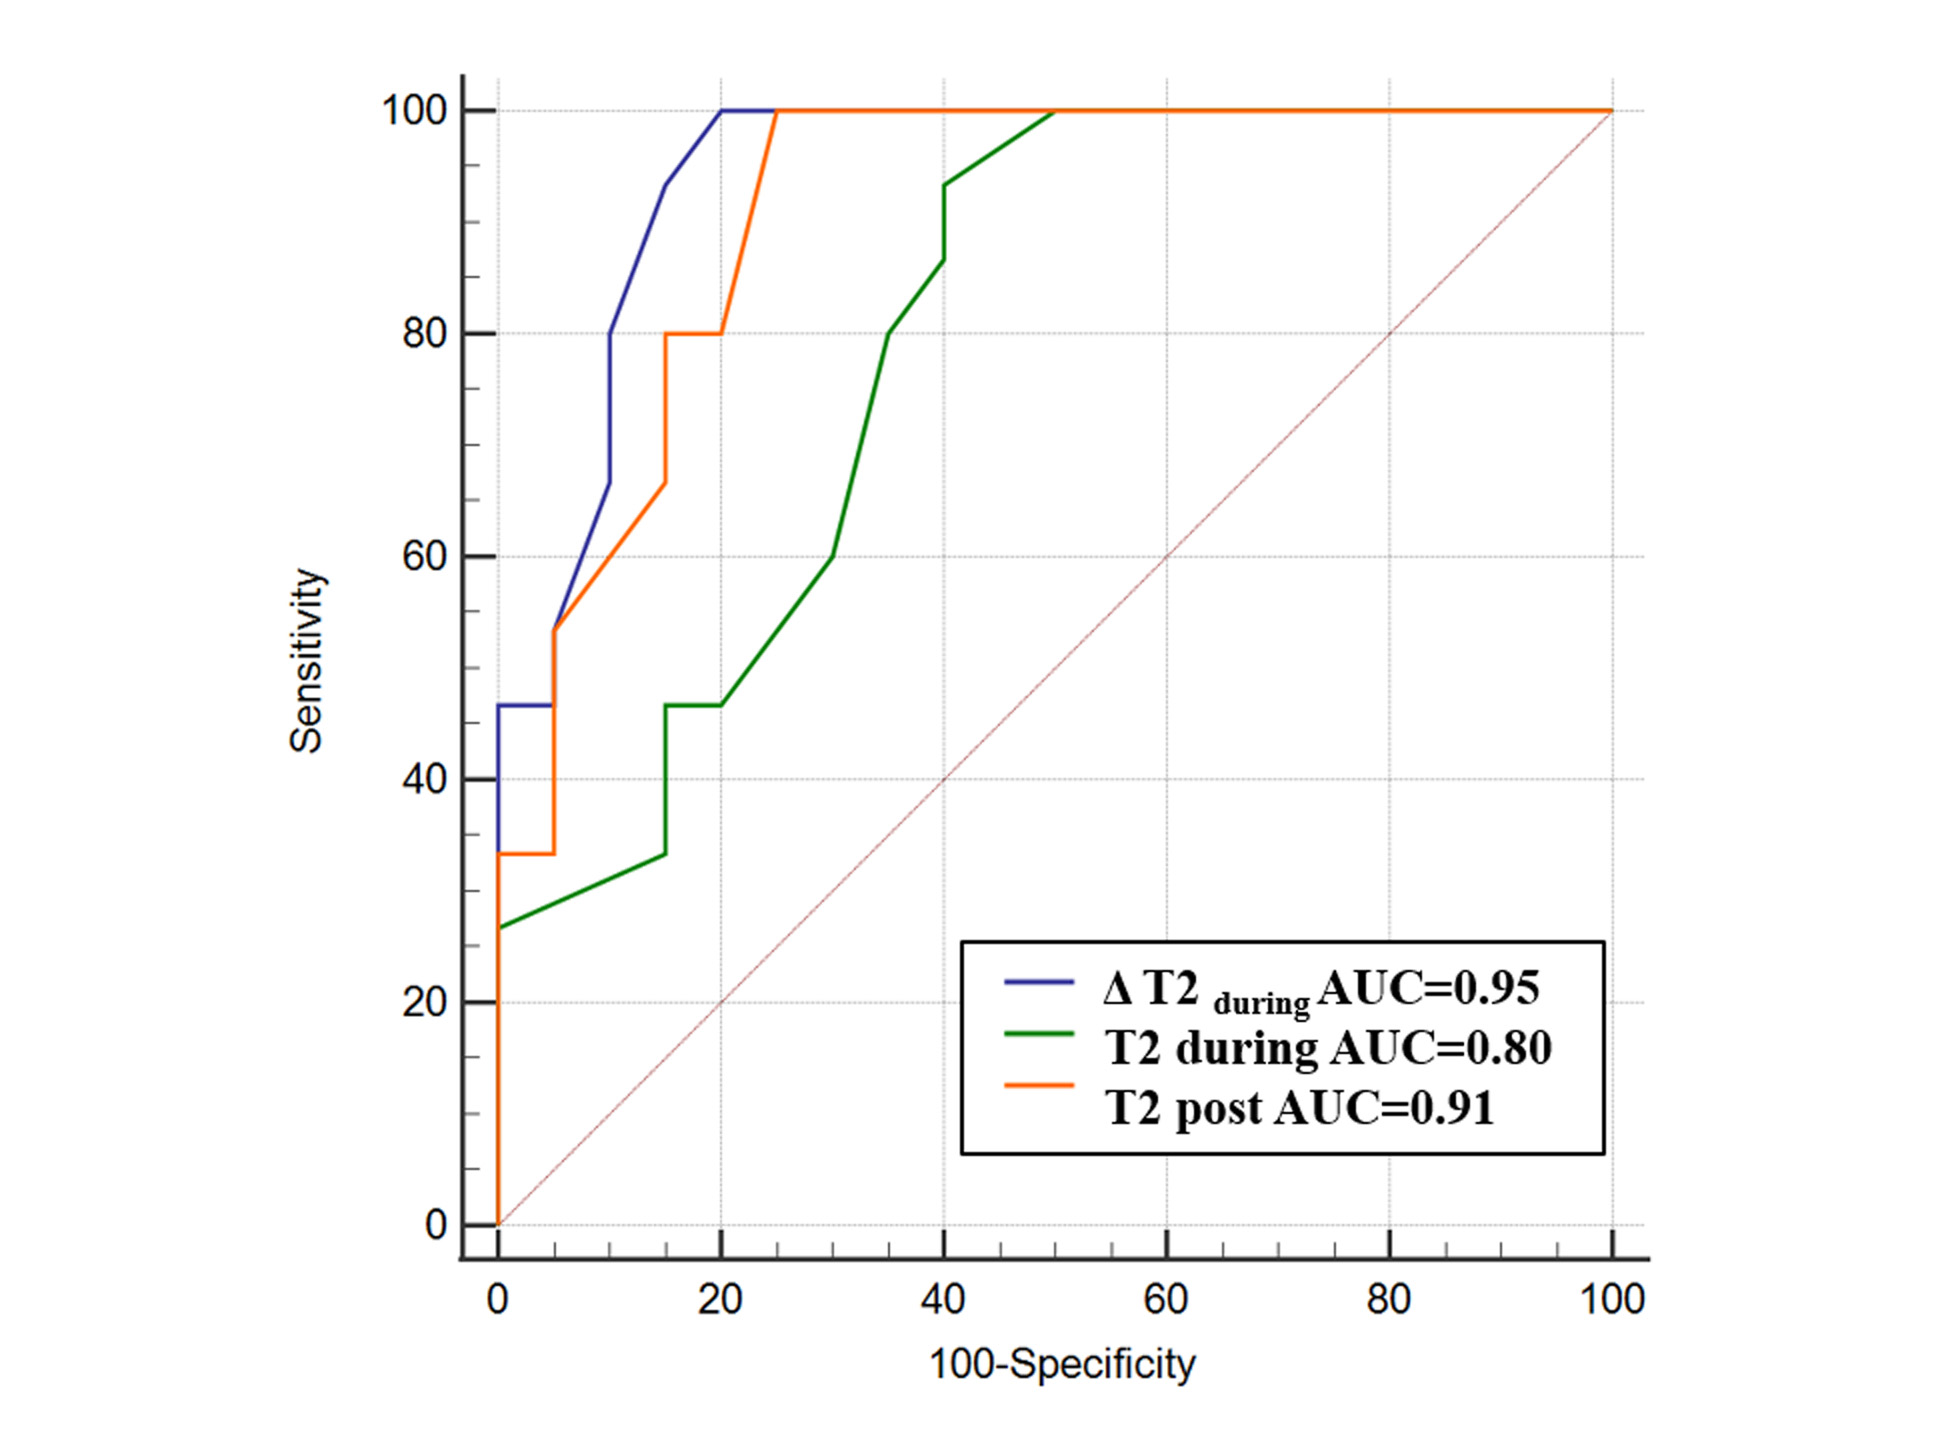
Using ROC analysis, compared with T2 mapping at different time points relative to CRT, ΔT2during showed the most robust efficacy in distinguishing GRs from non-GRs with highest AUC of 0.95 (Fig. 3).
Discussion and conclusion
This study for the first time investigated the clinical value of T2 mapping in predicting treatment response to CRT for LARC patients. Significantly different T2 values were found in GR from non-GR group and high correlation relationship was revealed between T2 and pathologic TRG. Additionally, ΔT2during was significantly higher in GR group than non-GR group and provided the most robust diagnostic efficacy in distinguishing GRs from non-GRs. This finding indicates that ΔT2during, calculated using T2 before- and during- CRT, is able to evaluate the CRT response at an early time point, rather than waiting until the end of CRT, alleviating physical burden for patients with no good response.In conclusion, quantitative T2 mapping may be an effective method in predicting the response to CRT for LARC patients.
Acknowledgements
We thank Shao-feng Duan for help with the statistical analysis of the data in this paper. We thank Shu-dong Hu, Yu-tian Zhao and Bo-jian Fei for their contributions to patient treatment data collection. All authors had access to the study data, and reviewed and approved the final manuscript.
References
[1] Salem ME, Hartley M, Unger K, et al. Neoadjuvant combined-modality therapy for locally advanced rectal cancer and its future direction. Oncology (Williston Park). 2016;30(6):546-62.
[2] Wang F, Zhang H, Wu C, et al. Quantitative T2 mapping accelerated by GRAPPATINI for evaluation of muscles in patients with myositis. Br J Radiol. 2019; 92(1102):20190109.
[3] Huang L, Ran L, Zhao P, et al. MRI native T1 and T2 mapping of myocardial segments in hypertrophic cardiomyopathy: tissue remodeling manifested prior to structure changes. Br J Radiol, 2019; 92(1104):20190634.
[4] Mandard AM, Dalibard F, Mandard JC, et al. Pathologic assessment of tumor regression after preoperative chemoradiotherapy of esophageal carcinoma: clinicopathologic correlations. Cancer.1994; 73(11):2680-2686.
Figures