3732
Research on the Application of Diagnosis and Invasion Assessment of Transition Zone Prostate Cancer by Relaxation Maps From Synthetic MRI1Radiology, The Department of Radiology, General Hospital of Ningxia Medical University, Yinchuan, China, 2GE Healthcare, MR Research China, Beijing, Beijing, China
Synopsis
In this retrospective study, we aim to investigate the application value of quantitative relaxation time obtained from synthetic MRI in the diagnosis and assessment of aggressiveness of transition zone prostate cancer. It was concluded that quantitative relaxation T1 and T2 values of synthetic MRI are useful parameters for discriminate TZ PCa from BPH, and T1 value demonstrated the similar diagnostic performance as ADC value. Gleason staging could be preliminarily assessed by T2 value of SyMRI in patients who cannot be punctured.
Introduction
In clinical practice, the quantitative analysis of apparent diffusion coefficien (ADC) value has been widely used, and a large number of studies have confirmed that diffusion weighted imaging (DWI) and ADC value play an important role in the diagnosis and invasion assessment of prostate cancer. Considering that T2 weighted imaging (T2WI) has excellent spatial resolution and tissue contrast [1], T2WI is also recommended as the main sequence for observing TZ lesions in PI-RADS V2.0 and V2.1[2]. Recently proposed synthetic MRI using the magnetic resonance image compilation (MAGiC) with a multiecho and multidelay acquisition method can simultaneously quantify tissues’ intrinsic magnetic properties and investigate all of the measures in a practically acceptable scan time. [3]. Multiple quantitative relaxation values, including T1, T2 and proton density (PD), obtained by SyMRI have been reported to correlate with a variety of histopathological changes [4]. However, few studies investigated the differential diagnosis performance of SyMRI between TZ prostate cancer (PCa) and benign prostatic hyperplasia (BPH) as well as the efficacy compared to DWI. Therefore, the present study was designed to investigate the application value of quantitative relaxation time obtained from synthetic MRI in the diagnosis and assessment of aggressiveness of transition zone prostate cancer.Material and Methods
Our Institutional Review Board approved the protocol and written informed consent was obtained from each patient. 68 subjects who underwent routine prostate magnetic resonance imaging (MRI) and magnetic resonance image compilation ( MAGIC) sequence imaging were retrospectively analyzed. Among all 68 subjects, 33 were classified into the case group with pathologically confirmed 35 TZ cancer lesions (two subjects had multifocal prostate cancer). In the control group, 35 subjects were proved by follow-up and partial pathology to be benign prostatic hyperplasia(BPH). All MR examinations were performed with a 3.0T MR scanner (SIGNA™ Architect; GE Healthcare, Milwaukee, USA) equipped with a 32-channel cardiac phased-array coil.The MAGIC parameters were as follows: TR=4000ms, TE=19.3ms, FOV=38cm×38cm, slice thickness/gap=4/1mm,NEX=1, and scanning time = 4.32mins. Axial (AX) DWI parameters: FOV=26cm×26cm, TELinimum, TR=5369ms, slice thickness/gap=3/1mm, NEX=10, b value = 1000 s/mm2. Quantitative measurements, including T1, T2, and PD maps, of transition zone prostate cancer case group and normal control group were generated from the raw data produced by the MAGiC imaging sequence using a vendor-provided program (MAGiC, v. 100.1.1). Post processing of DWI images were performed on vendor provided advanced workstation (AW4.7, GE Healthcare) to generate apparent diffusion coefficien (ADC). Independent sample t-test, Mann–Whitney U-test, and receiver operating characteristic curve analysis(ROC) were performed for statistical analysis, in which P<0.05 were considered statistically significant.Results
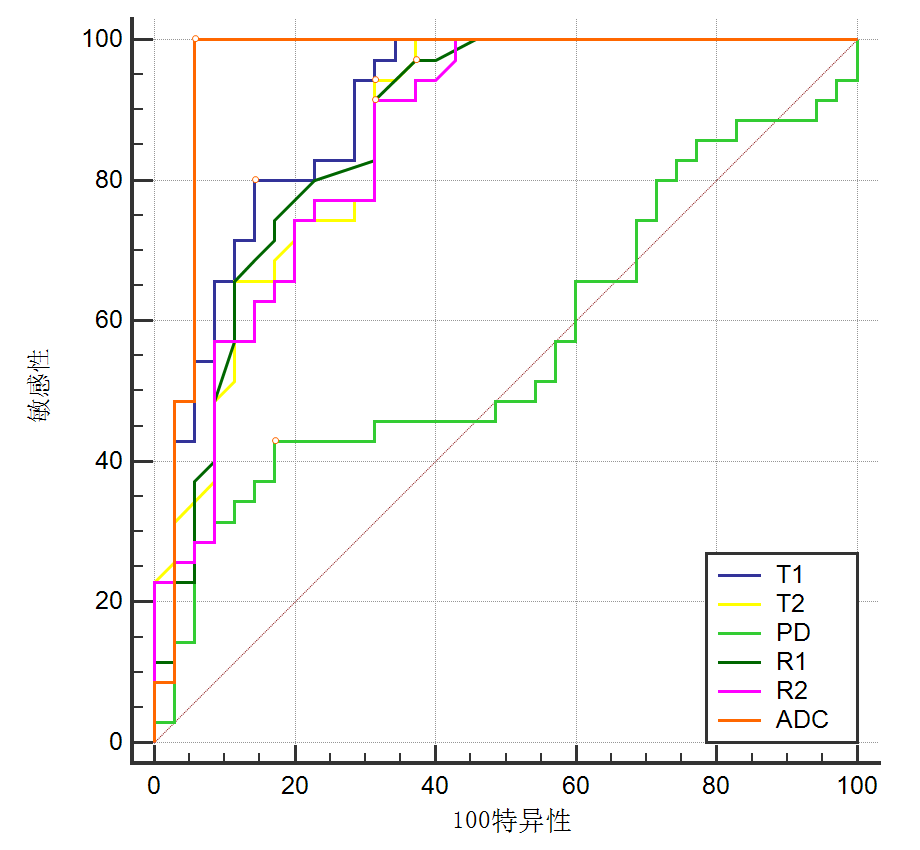
The T1 (1081.66±100.81)ms and T2 (77.12±6.73)ms of the prostate transitional zone cancer group were lower than those in BPH group T1 (1340.76±195.91)ms and T2 (94.21±15.15)ms,(Z=-5.77, P<0.01 and Z=-5.28, P<0.01 respectively). PD was not statistically significant(Z=-0.981, P>0.05, Table 1 and Figure 1) between 2 groups. The area under the curve (AUC) of T1 value was similar with the apparent diffusion coefficient (ADC) value in discriminating TZ PCa from BPH (0.901 and 0.959, P = 0.124, Table 2 and Figure 2). ADC value、T2 value all were negatively correlated with Gleason score (r = -0.728 and r =-0.639 , all P < 0.01, Table 3).Discussion and Conclusion
Our study demonstrated that quantitative relaxation T1 and T2 values of SyMRI are useful parameters can discriminate transition zone Prostate Cancer from BPH , and T1 value demonstrated the similar diagnostic performance as ADC value. No significant differences were observed between AUC of T1 and AUC of ADC (0.901 and 0.959, P =0.124), nor between AUC of T1 and AUC of T2 (0.901 and 0.867, P = 0.396), and ADC value demonstrated the better diagnostic performance than T2 value (0.959 and 0.867, P=0.036). Our results show that the T1 and T2 values of the prostate transitional zone cancer were significantly lower than those in benign prostatic hyperplasia(BPH), in agreement with some published results [1,5,6]. However, some researchers have proposed that there is no significant difference in T2 values between TZ prostate cancer and BPH [7]. We speculate the different results of transitional zone cancer may be due to the fact that imaging manifestations of stromal hyperplasia and TZ prostate cancer are similar on T2WI. In our study, we found T1 value demonstrated the similar diagnostic performance as ADC value. Also, invasion assessment of prostate cancer in our study shows that, T2 and ADC values were inverse correlated with the Gleason score, which is consistent with the results of some previous studies [8,9],and have studies reported the diverse results about the correlation between the ADC value and Gleason score[10]. Besides the small sample size, another major limitations of our study is that the pathological results of this study are mostly obtained by puncture biopsy. The ROI region and the pathologic area could be spatially mismatched, which is an objective systemic error that cannot be completely avoided. In conclusion, quantitative relaxation T1 and T2 values derived from synthetic MRI can discriminate transition zone PCa from BPH, and Gleason staging could be preliminarily assessed by T2 value of SyMRI in patients who cannot be punctured.Acknowledgements
This work was supported by grants from Key Research and Development Program of Ningxia(2019BEG03033) and Natural Science Foundation Program of Ningxia (2020AAC03156).
References
[1] Lee, CH. Quantitative T2-mapping using MRI for detection of prostate malignancy: a systematic review of the literature. Acta Radiol2019; 60(9): 1181-1189.
[2] Turkbey B, Rosenkrantz AB, Haider MA, et al. Prostate Imaging Reporting and Data System Version 2.1: 2019 Update of Prostate Imaging Reporting and Data System Version 2. Eur Urol2019; 76(3): 340-351.
[3] Goncalves FG, Serai SD, Zuccoli G. Synthetic Brain MRI: Review of Current Concepts and Future Directions. Top Magn Reson Imaging2018; 27(6): 387-393.
[4] Schmidbauer VU, Dovjak GO, Yildirim MS, et al. Mapping Human Fetal Brain Maturation In Vivo Using Quantitative MRI. AJNR Am J Neuroradiol2021.
[5] van Houdt PJ, Agarwal HK, van Buuren LD, et al. Performance of a fast and high-resolution multi-echo spin-echo sequence for prostate T2 mapping across multiple systems. Magn Reson Med2018; 79(3): 1586-1594.
[6] Panda A, Obmann VC, Lo WC, et al. MR Fingerprinting and ADC Mapping for Characterization of Lesions in the Transition Zone of the Prostate Gland. Radiology2019; 292(3): 685-694.
[7] Cui Y, Han S, Liu M, et al. Diagnosis and Grading of Prostate Cancer by Relaxation Maps From Synthetic MRI. J Magn Reson Imaging2020; 52(2): 552-564.
[8] Mai J, Abubrig M, Lehmann T, et al. T2 Mapping in Prostate Cancer. Invest Radiol2019; 54(3): 146-152.
[9] Chatterjee A, Devaraj A, Mathew M, et al. Performance of T2 Maps in the Detection of Prostate Cancer. Acad Radiol2019; 26(1): 15-21.
[10] Surov A, Meyer HJ, Wienke A. Correlations between apparent diffusion coeffificient and Gleason score in prostate cancer: A systematic review. Eur Urol Oncol2020; 3(4):489-497.
Figures
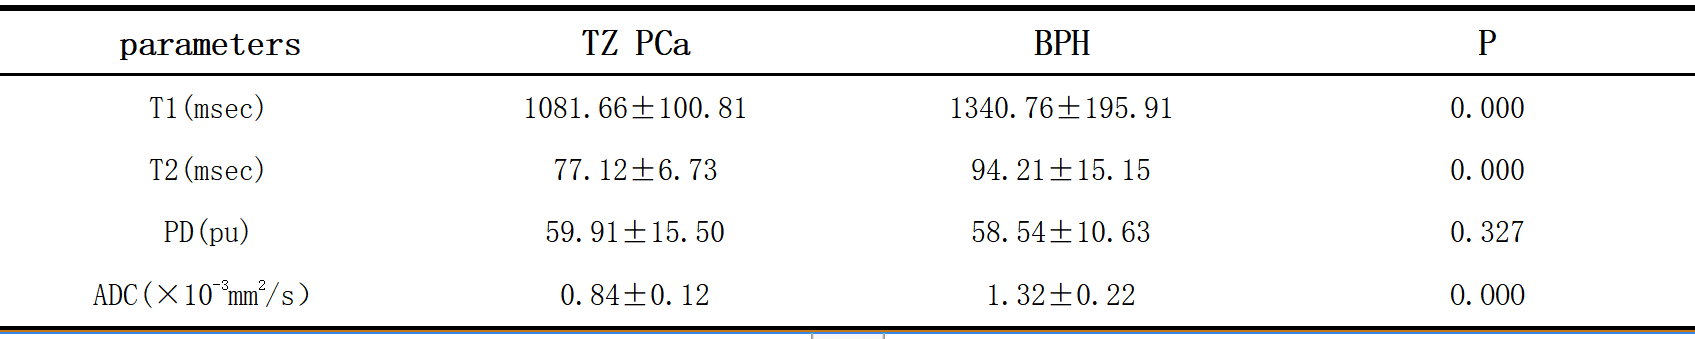
Table 1
Results of T1,T2,PD, and ADC Values of TZ PCa and BPH
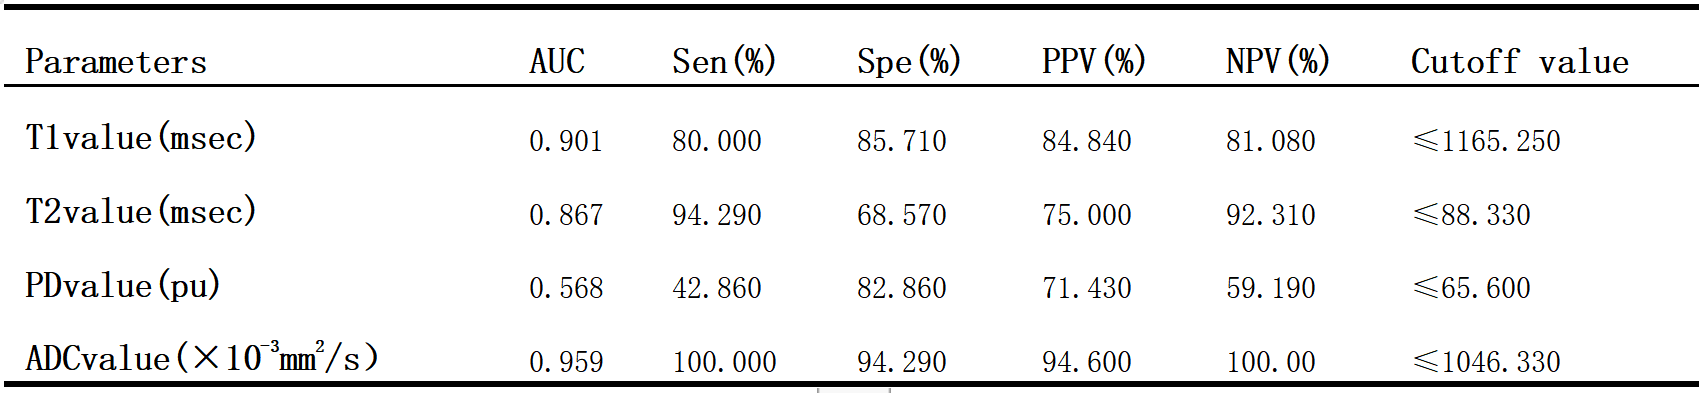
Table 2
ROC Analysis Results of T1, T2, PD and ADC Values in TZ PCa From BPH
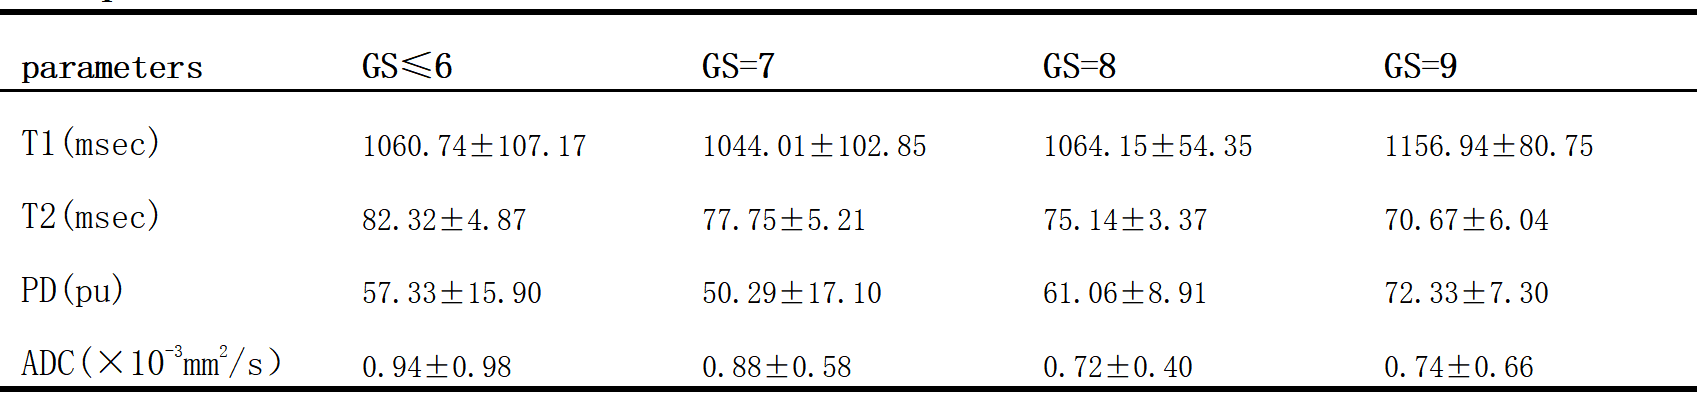
Table 3
Comparison of T1, T2, PD, and ADC Values in TZ PCa with Different Gleason scores
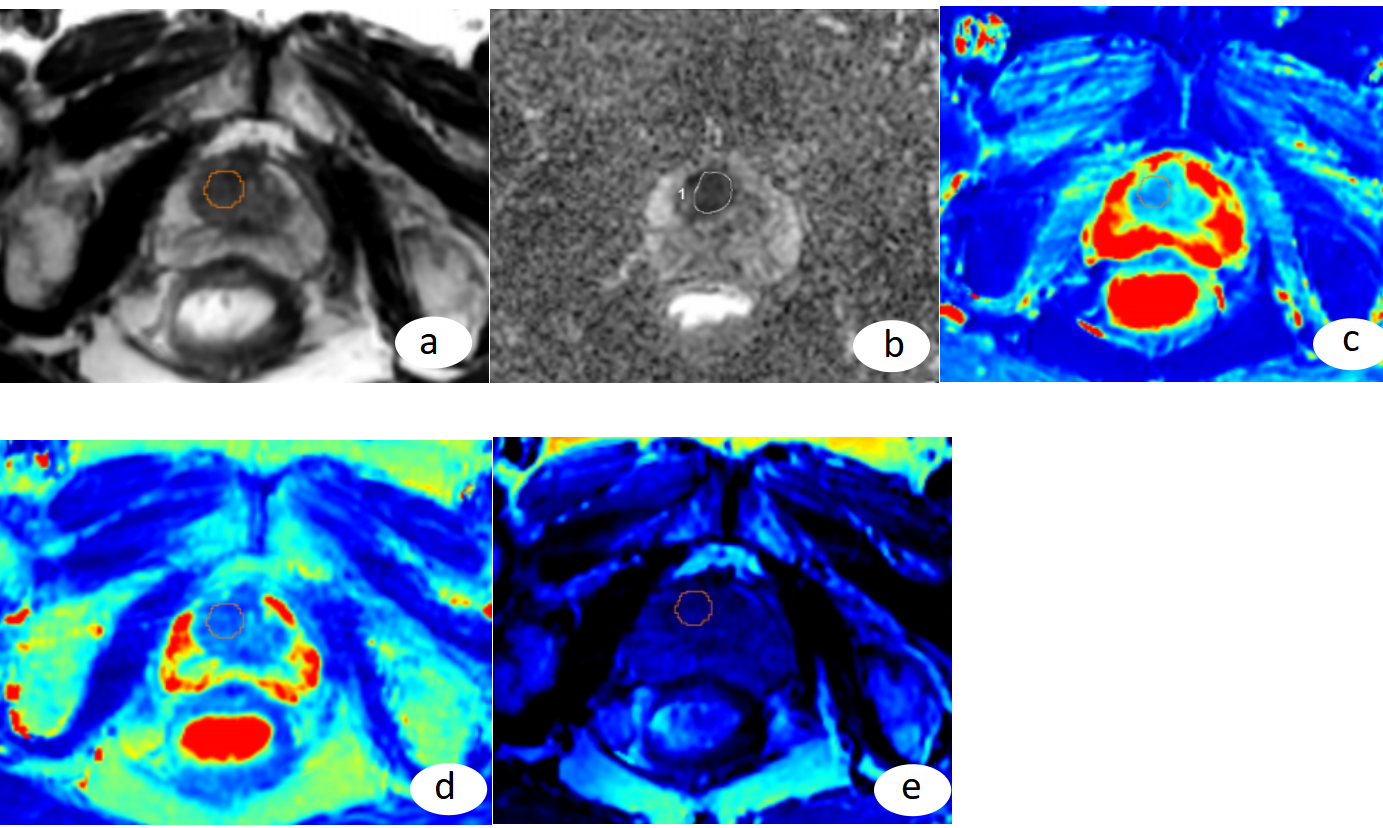
Figure 1: Representative images from a 73-year-old PCa patient with serum PSA value of 18.54 ng/mL. Axial T2-weighted(a) shows the PCa lesion is located in the right TZ with Gleason score of 3+3=6. Axial apparent diffusion coefficient map (b) revealing a focal area of obvious hypointense lesion, T1mapping (c), T2 mapping (d) and PD mapping (e).
PCa: prostate cancer; TZ: transitional zone; PD: proton density.