3730
Regional brain ADC value changes in fetuses with complex congenital heart diseases in the second and early third trimesters1Shandong Provincial Hospital Affiliated to Shandong University, Jinan, China, 2Ultrasound, Shandong Provincial Hospital Affiliated to Shandong First Medical University, Jinan, China, 3Siemens Healthineers Ltd, Beijing, China, 4Shandong Provincial Hospital Affiliated to Shandong First Medical University, Jinan, China, Jinan, China
Synopsis
We measured apparent diffusion coefficient (ADC) values in the brains of 64 normal fetuses at 20-40 gestational weeks and 23 fetuses with complex CHD during second and early third trimesters. We also compared ADC values between the fetuses with CHD and the 27 gestational age-matched normal controls using covariance analyses. Our results showed normal variations in ADC values for fetal brains during maturation in utero. Moreover, the ADC values in the CHD group were not significantly different than the GA-matched normal fetuses, indicating that myelin development was not delayed in the CHD fetuses during the second and early third trimesters.
Introduction
Brain injury has been detected in neonates at early stages and has been associated with complex congenital heart diseases (CHD) before corrective surgery1–4. Case reports showed that apparent diffusion coefficient (ADC) values in the periarterial write matter and thalamus were higher in fetuses with CHD during the late third trimesters5. However, the published studies only included small sample size, and we did not know the brain ADC changes in fetuses with CHD during the early stage in utero5. This study aimed to explore the ADC values changes of different cerebral territories in fetuses with complex CHD during the second and early third trimesters.Materials and Methods
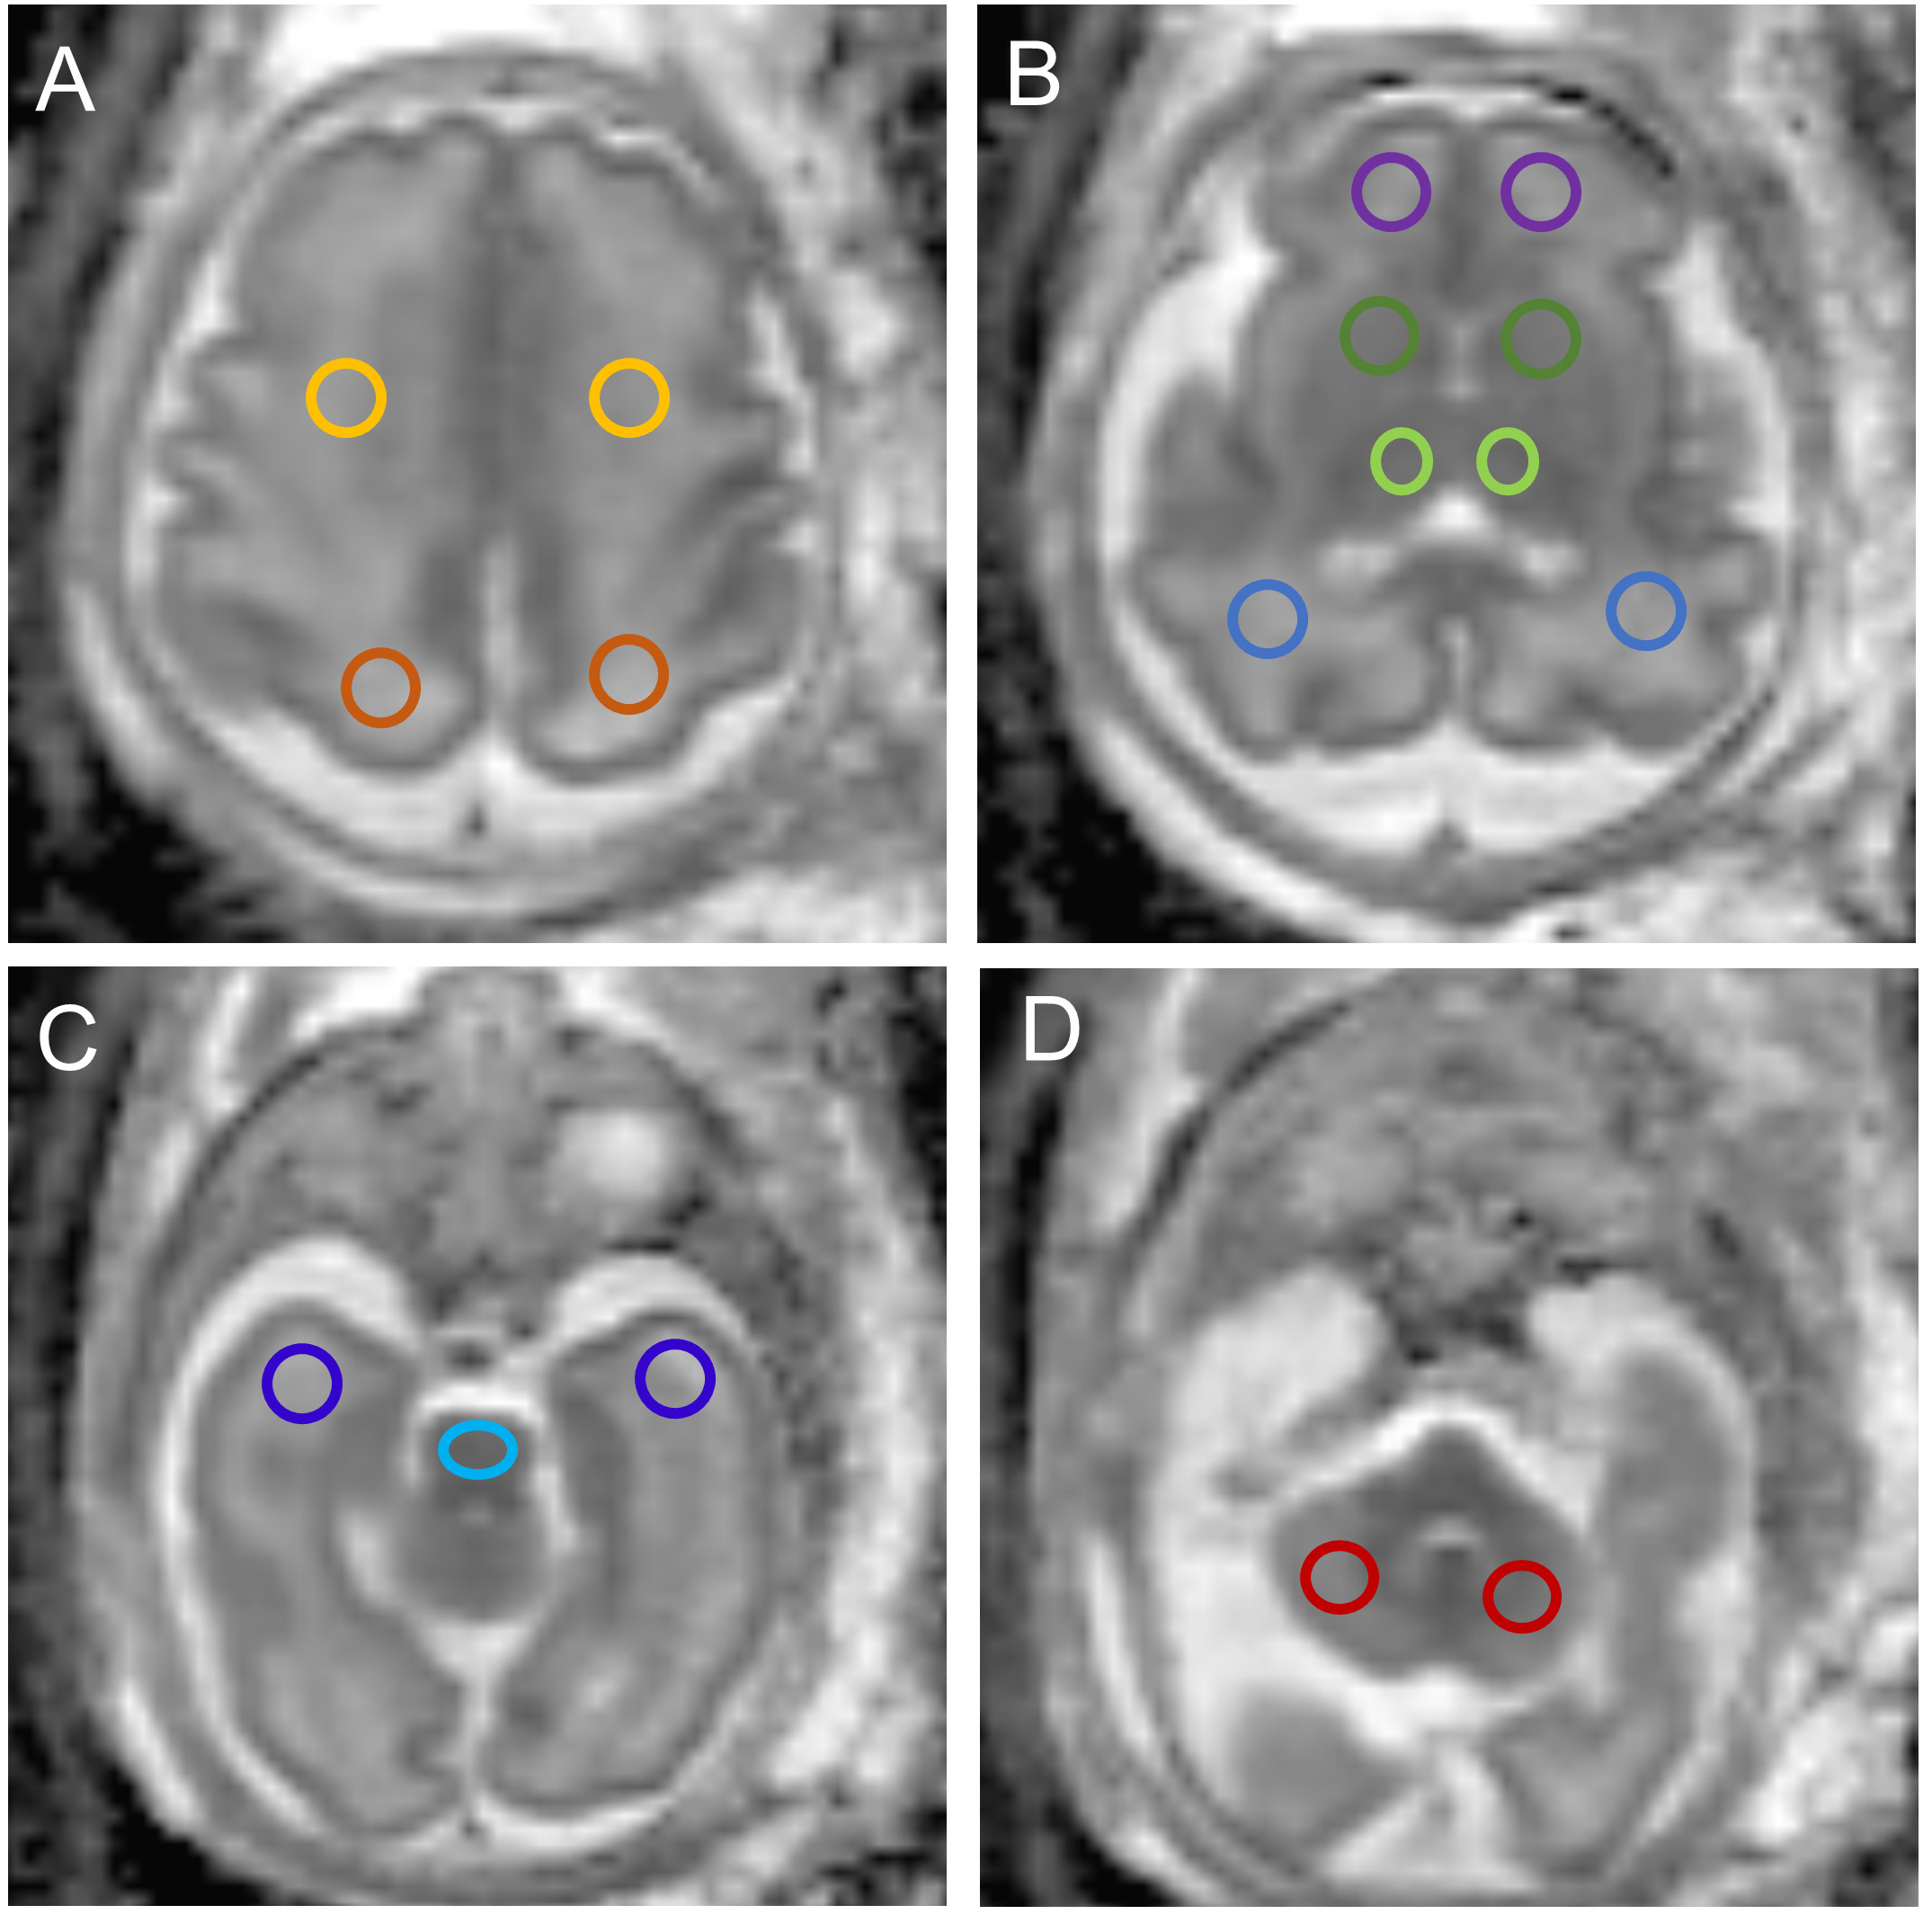
In this prospective study, from May 2020 through October 2021, pregnant women with single fetuses with complex CHD between 20 and 31 weeks of pregnancy and normal healthy fetuses were enrolled. All the subjects underwent MRI of the brain prenatally on a 3T MR scanner (MAGNETOM Skyra, Siemens Healthcare, Erlangen, Germany) with an 18-channel body coil. Diffusion-weighted imaging (DWI) was performed using a single-shot echo-planar imaging (ss-EPI) sequence with two b values (b=0 and 1,000 s/mm2) in three diffusion directions. The other parameters were: repetition time (TR)= 4900 ms; echo time (TE) = 87 ms; field of view (FOV) = 260×260 mm2; slice thickness = 4 mm without slice gap; matrix = 150×150; voxel size =1.7 ×1.7×4.0 mm3, parallel acceleration factor = 2; and acquisition time = 2 mins12s. Parametric ADC maps were generated inline after data acquisition. Regions of interest (ROIs) were drawn on ADC maps in the frontal white matter (FWM), temporal white matter (TWM), parietal white matter (PWM), occipital white matter (OWM), cerebellar hemisphere (CH), the central area of the centrum semiovale, basal ganglia region (BGR), thalamus (TH), and Pons (Figure 1). ROIs were drawn manually and varied in shape and size depending on the brain region and the size of the fetal brain. The linear regression and the polynomial quadratic nonlinear analyses were used to evaluate the correlation between gestational ages (GAs) and ADC values in the various brain regions. The ADC values in the various brain regions were also compared between the CHD and gestational age-matched normal controls using analysis of covariance. A P < 0.05 indicated a significant difference. Statistical analysis was performed using GraphPad software.Results
Characteristics of the CohortsTwenty-three pregnant women with fetuses diagnosed with complex CHD and 64 pregnant women with normal healthy fetuses were enrolled. In addition, we selected 27 gestational age-matched normal controls to compare the ADC values with the CHD fetuses using covariance analyses. There was no significant difference in the GA between the CHD (GA: 26.81 ±2.17 weeks) and normal (GA: 27.32±1.87 weeks) GA-matched healthy groups (p=0.38). The CHD structural lesions included congenitally corrected transposition of the great arteries (CTGA) (6/23, 26.1%), hypoplastic left heart syndrome (HLHS) (4/23, 17.4%), critical aortic stenosis (4/23, 17.4%), tetralogy of Fallot (TOF) (5/23, 21.7%), severe pulmonary stenosis or atresia (1/23, 4.3%), single cardiac ventricle (2/23, 8.7%), and total anomalous pulmonary venous drainage (TAPVD) (1/23, 4.3%).
Relationship between ADC values and GAs in the normal group
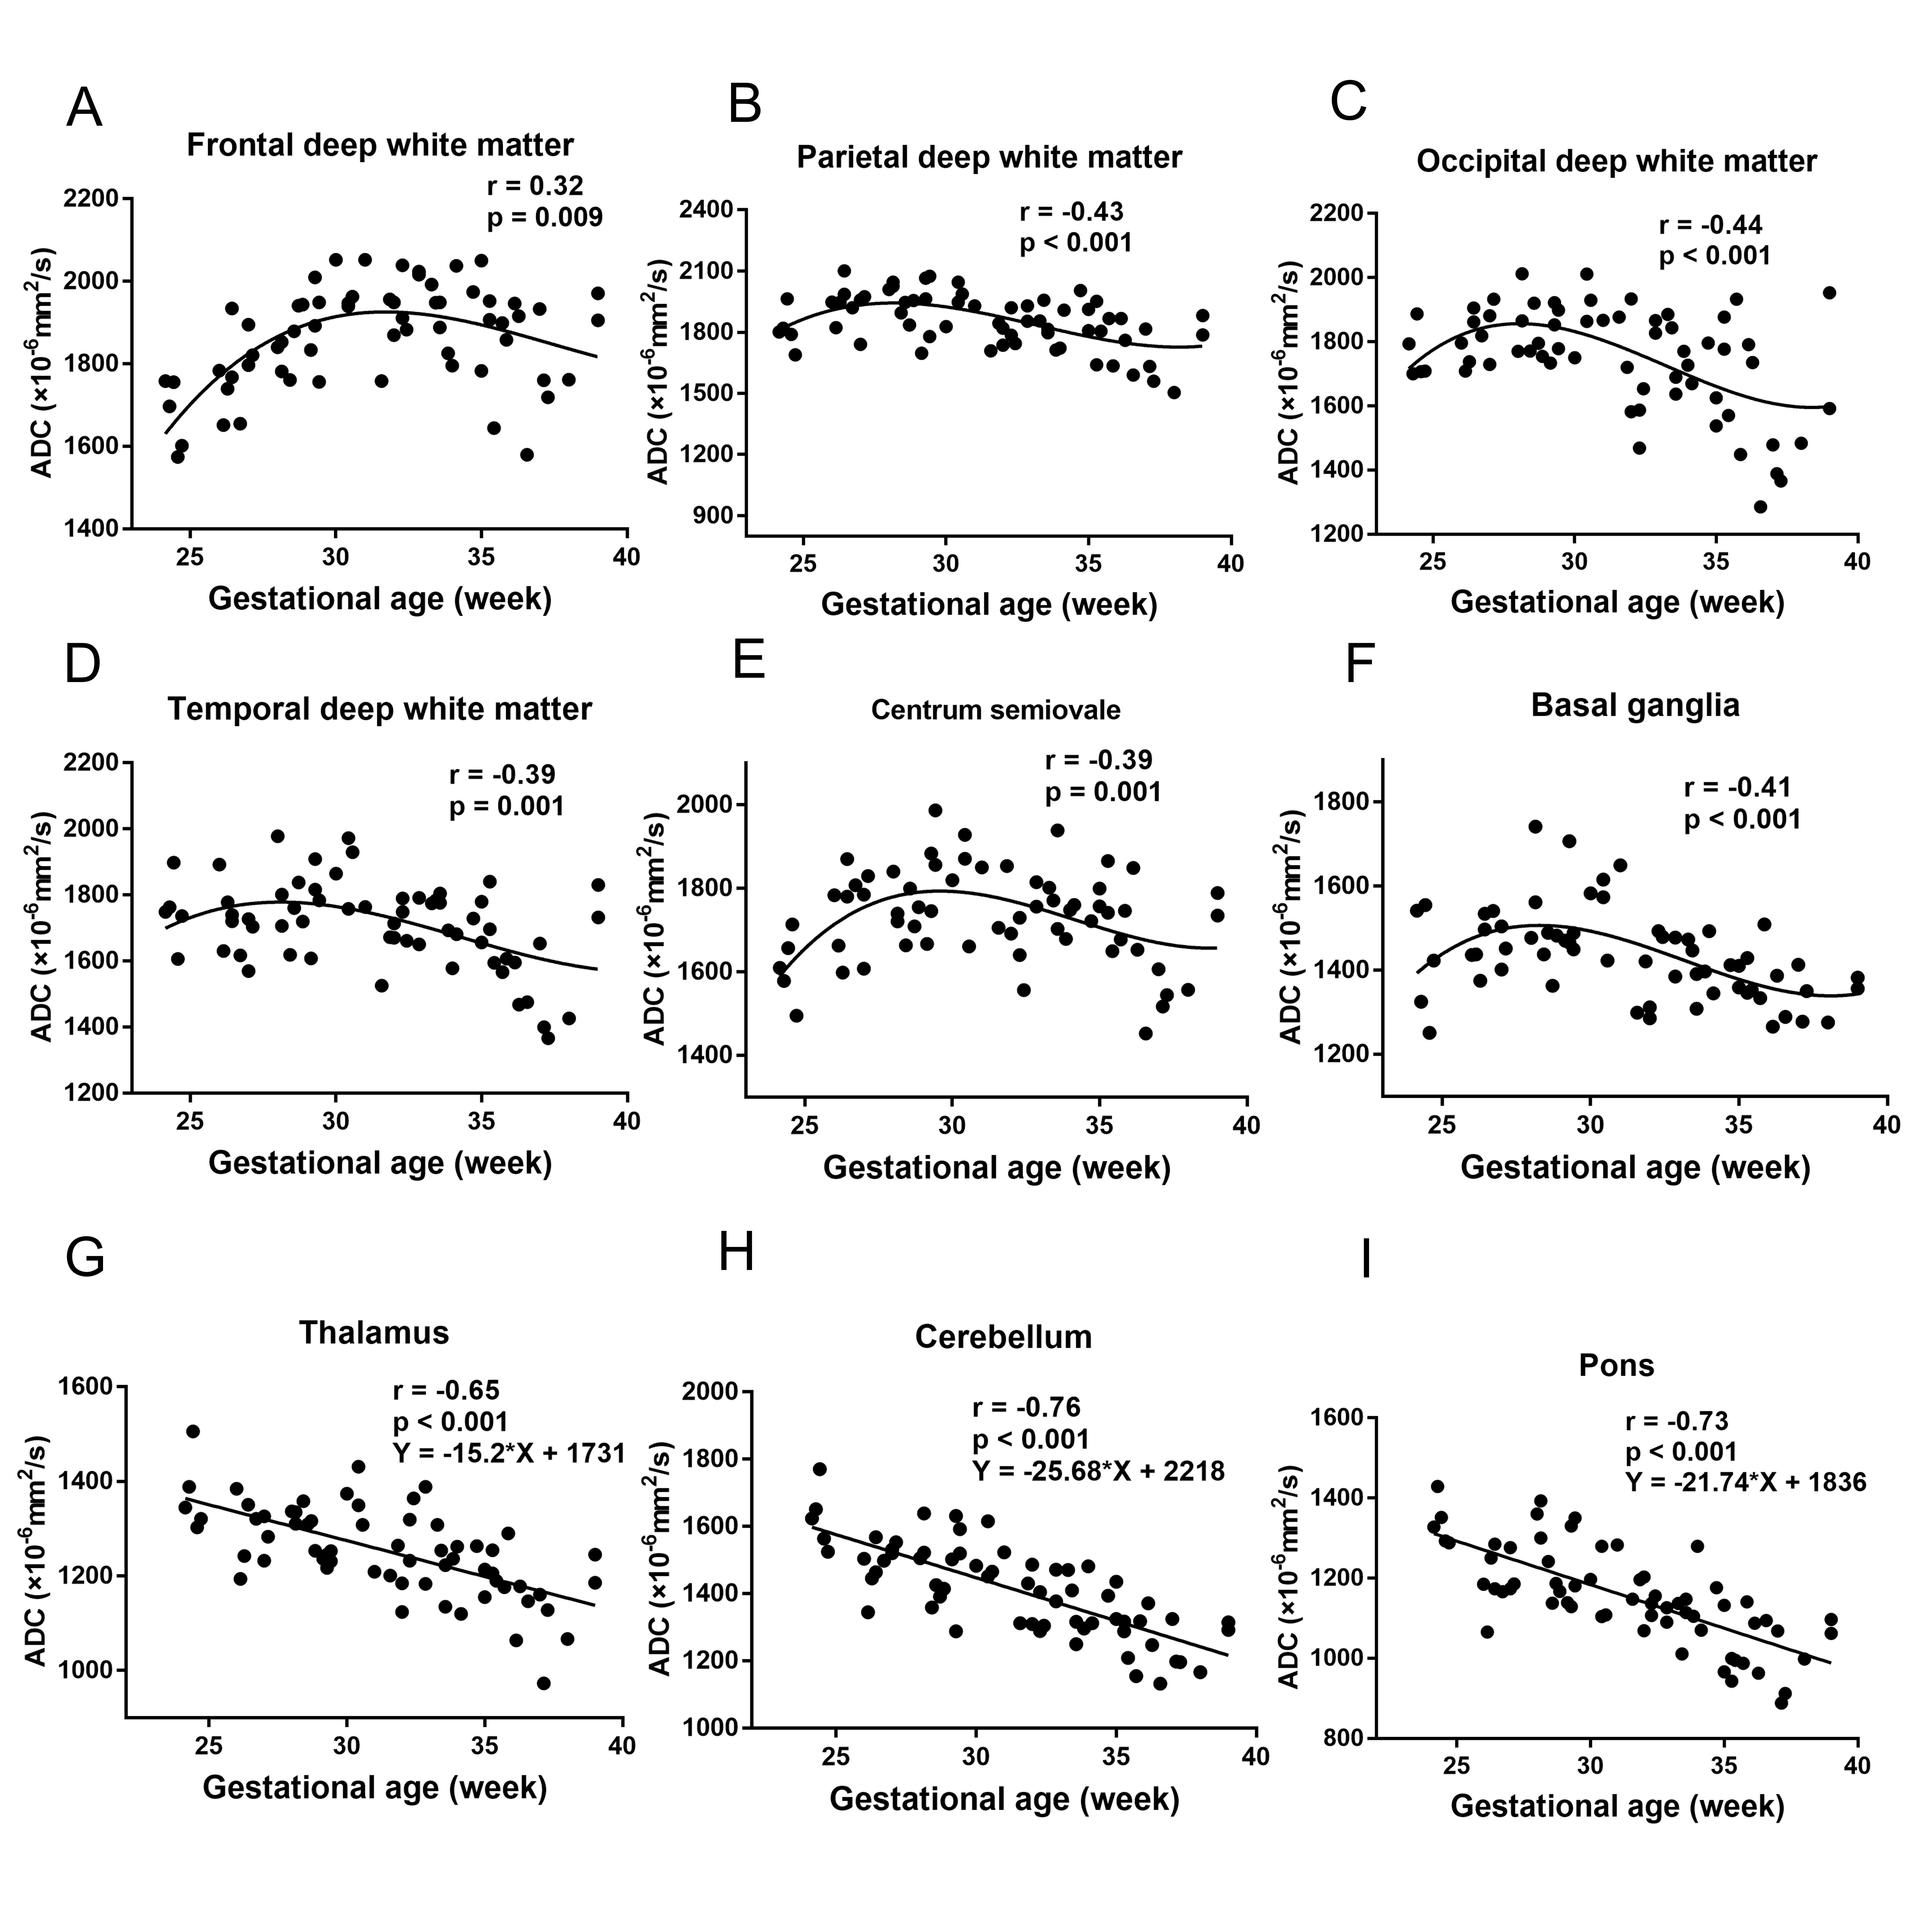
Figure 2 shows the relationship between ADC values and GAs in the normal group (GA:20-40 weeks) with the corresponding fitting curve. A significant negative linear correlation was found in the CH, pons, and TH (all p<0.05). A significant quadratic polynomial correlation was found in FWM, TWM, PWM, OWM, BGR, and centrum semiovale (all p<0.05).
Relationship between ADC values and GAs in the CHD and normal GA-matched groups
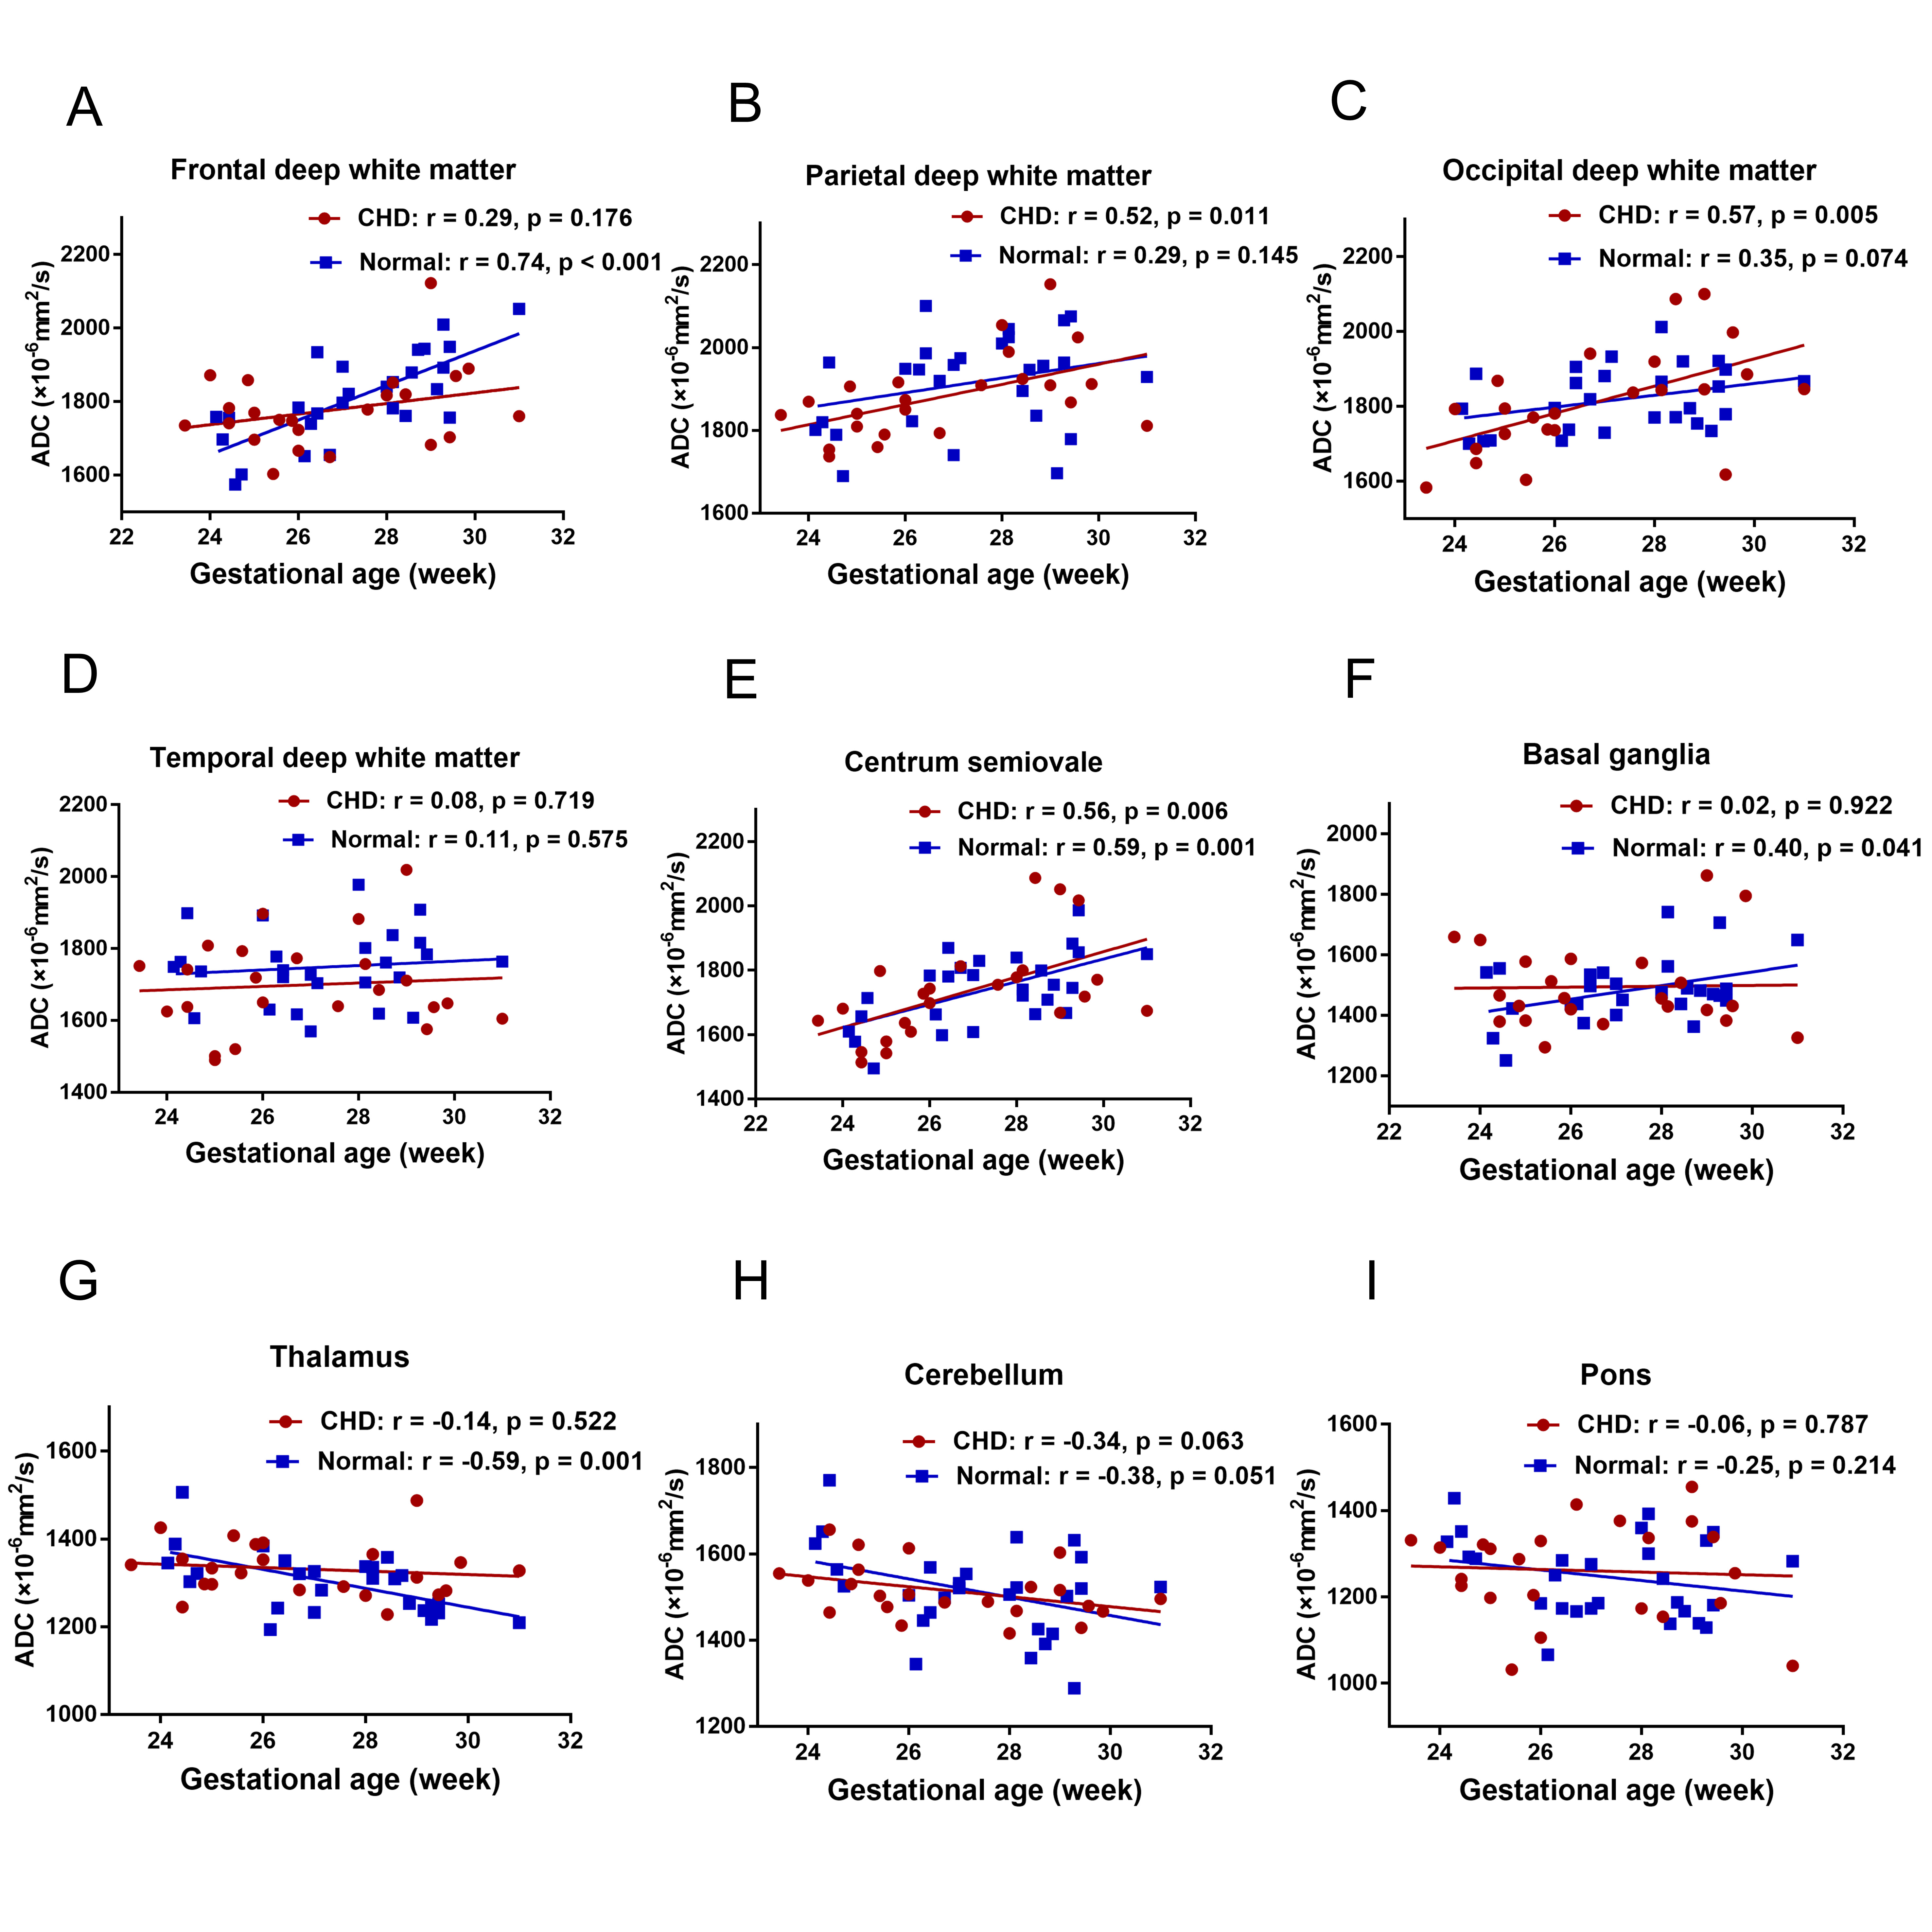
Figure 3 shows the relationship between ADC values and GAs in the CHD and GA-matched normal groups with the corresponding fitting curves. In the GA-matched normal group, the ADC values of the FWM, centrum semiovale, and BGR were increased significantly across GAs (p= 0.001, 0.001, and 0.041, respectively), and the ADC values of the TH were decreased significantly across GAs (p=0.001). However, in the CHD group, the ADC values of the PWM, OWM, and the centrum semiovale were increased significantly across GAs (p= 0.011, 0.005, and 0.006, respectively).
Comparisons of the ADC values in the various brain regions
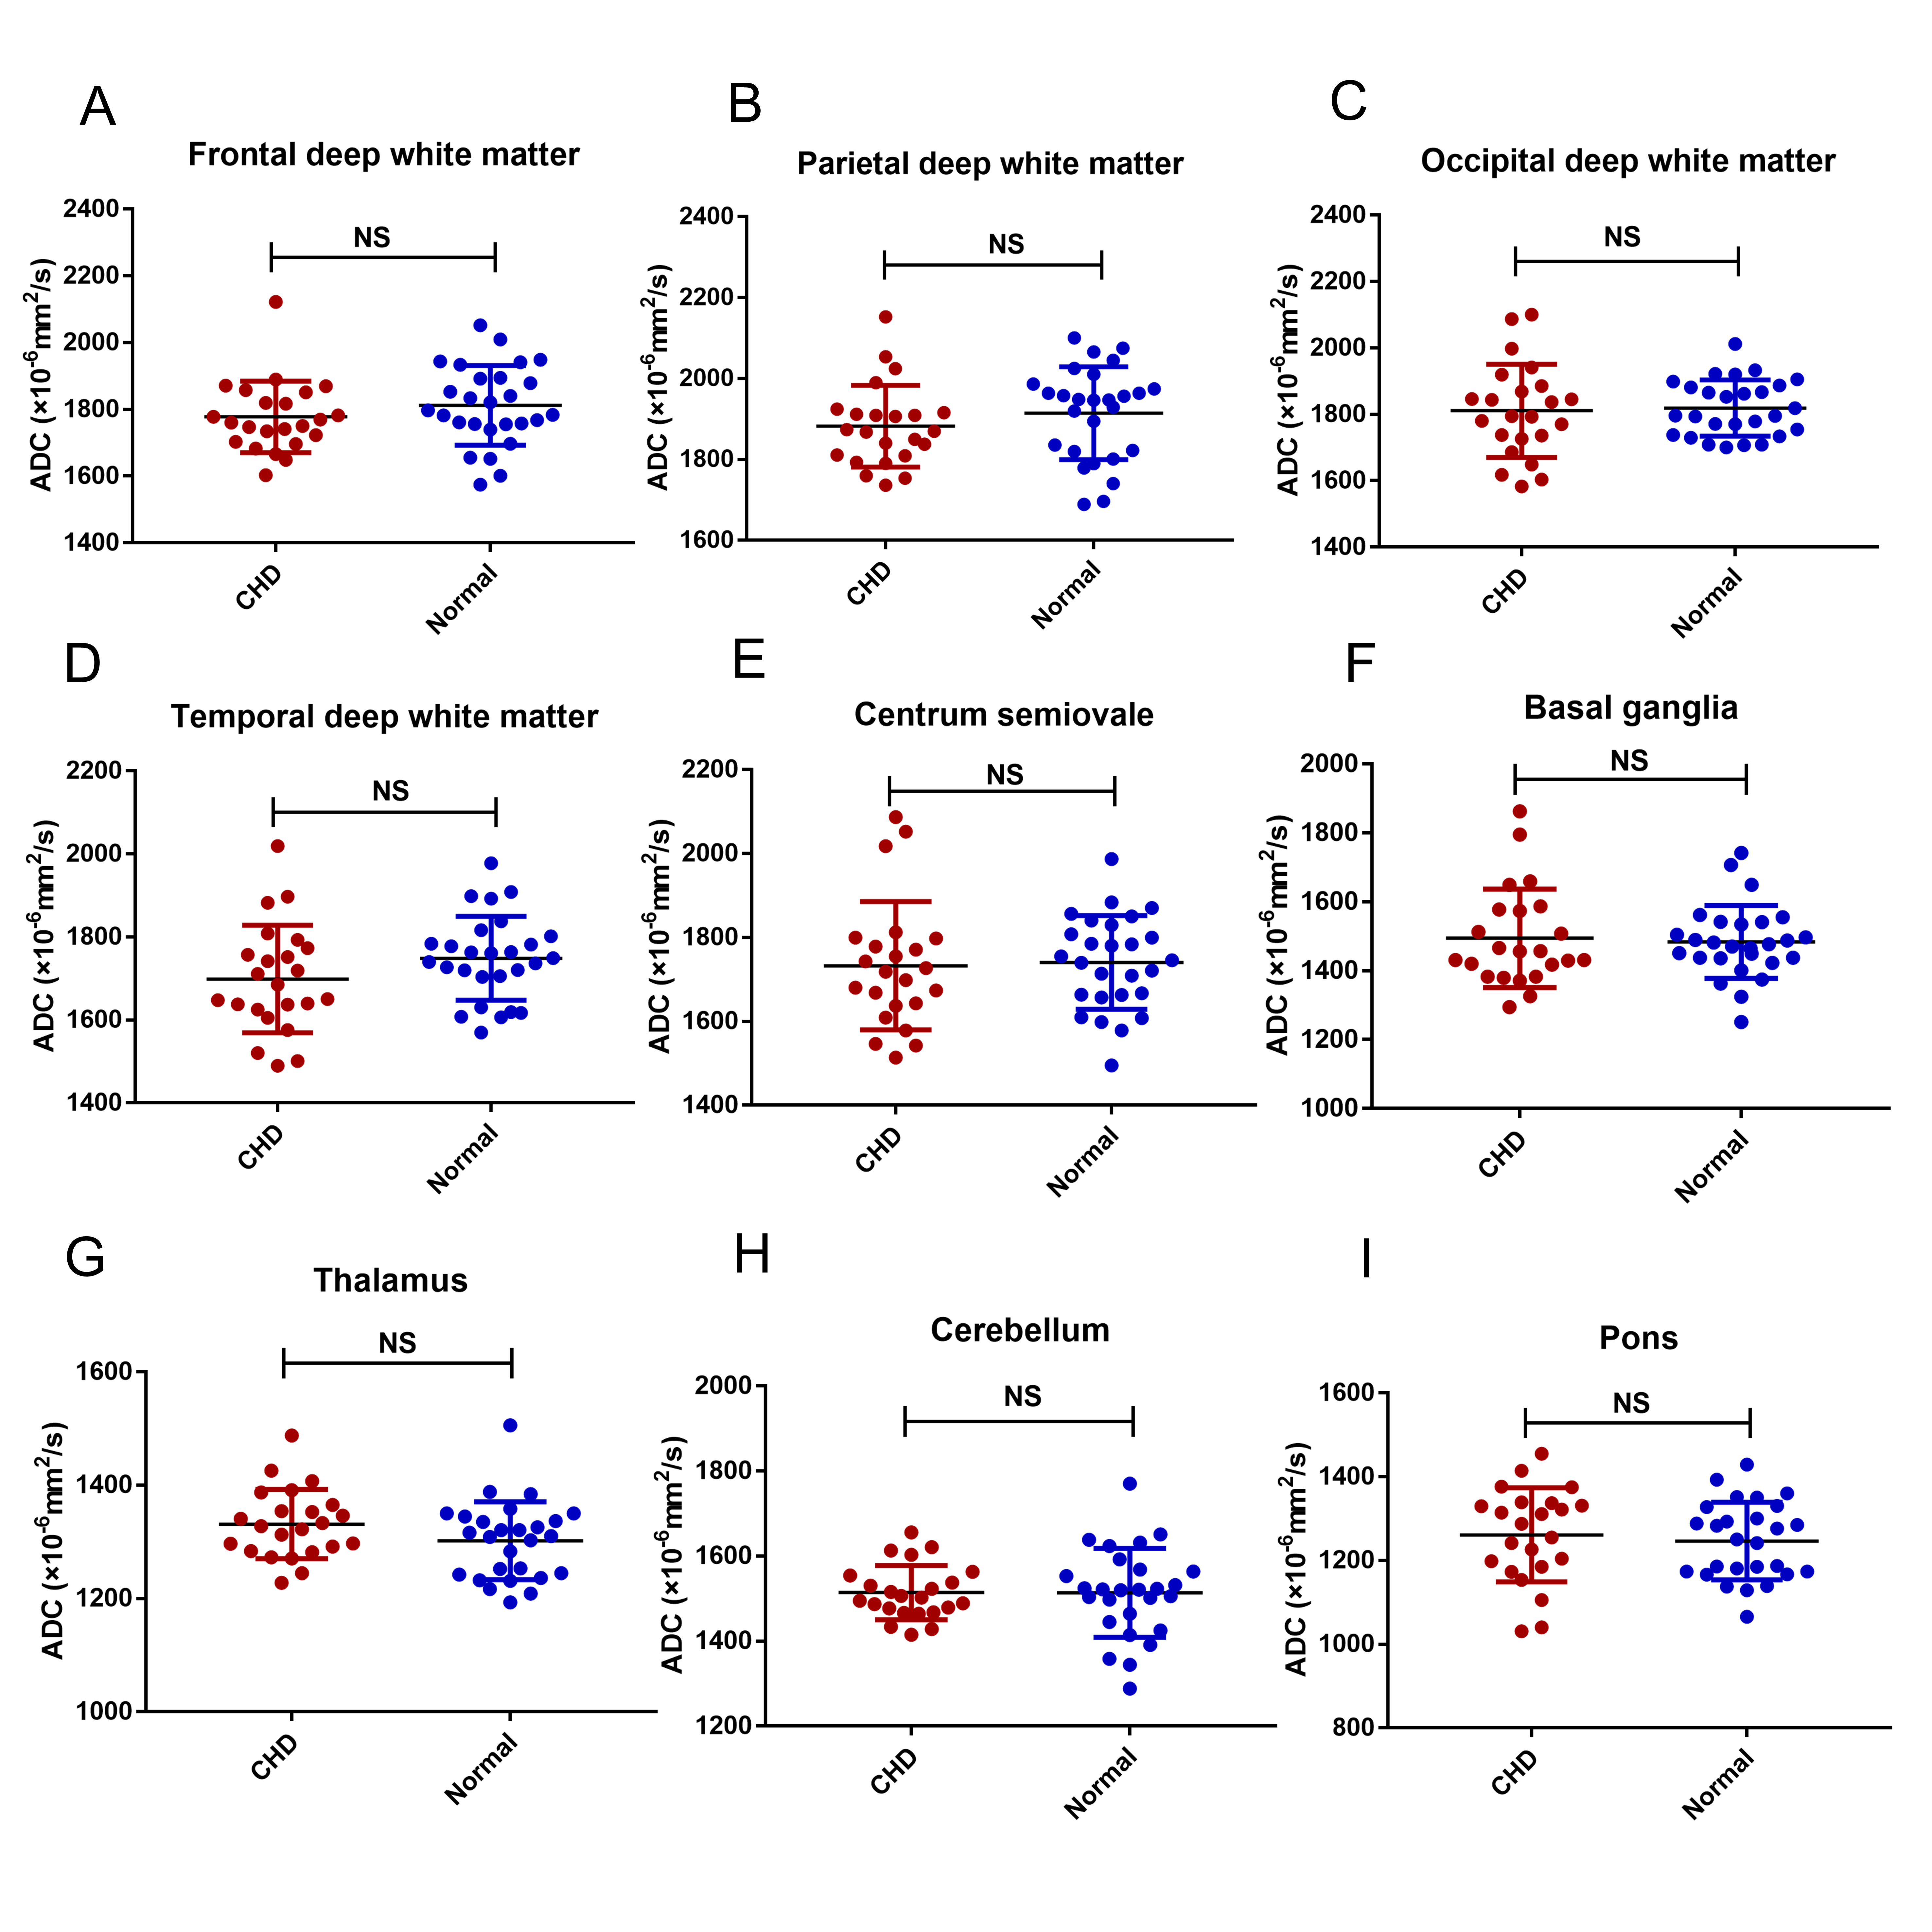
Figure 4 shows a comparison of the ADC values in the CHD and GA-matched normal groups. The ADC values in the FWM, TWM, PWM, OWM, CH, centrum semiovale, BGR, TH, and pons showed no significant differences (all p>0.05).
Discussion and Conclusion
Our results show that the ADC values in the normal group are in line with previous studies6–9. Moreover, this in-vivo study suggests the ADC values in fetuses with complex CHD showed no significant difference with the GA-matched normal fetuses during the second and early third trimesters, indicating that myelin development might not be delayed in CHD fetuses during the second and early third trimesters.Acknowledgements
This work was supported by the National Natural Science Foundation of China [81671668] and the Natural Science Foundation of Shandong Province [ZR201911150560].References
1. Association between Subcortical Morphology and Cerebral White Matter Energy Metabolism in Neonates with Congenital Heart Disease. Sci. Rep. 13 (2018).
2. Makropoulos, A. et al. Automatic Whole Brain MRI Segmentation of the Developing Neonatal Brain. IEEE Trans. Med. Imaging 33, 1818–1831 (2014).
3. Claessens, N. H. P. et al. Brain and CSF Volumes in Fetuses and Neonates with Antenatal Diagnosis of Critical Congenital Heart Disease: A Longitudinal MRI Study. Am. J. Neuroradiol. 40, 885–891 (2019).
4. Brossard-Racine, M. et al. Brain Injury in Neonates with Complex Congenital Heart Disease: What Is the Predictive Value of MRI in the Fetal Period? Am. J. Neuroradiol. 37, 1338–1346 (2016).
5. Berman, J. I. et al. Diffusion-Weighted Imaging in Fetuses with Severe Congenital Heart Defects. Am. J. Neuroradiol. 32, E21–E22 (2011).
6. Righini, A. et al. Apparent Diffusion Coefficient Determination in Normal Fetal Brain: A Prenatal MR Imaging Study. 6 (2003).
7. Schneider, J. F. et al. Diffusion-weighted imaging in normal fetal brain maturation. Eur. Radiol. 17, 2422–2429 (2007).
8. Schneider, M. M. et al. Normative Apparent Diffusion Coefficient Values in the Developing Fetal Brain. Am. J. Neuroradiol. 30, 1799–1803 (2009).
9. Girard, N., Raybaud, C. & Poncet, M. In Vivo MR Study of Brain Maturation in Normal Fetuses. 15 (1995).
Figures