3729
Hemodynamics, brain volume and cortical development in fetuses with complex congenital heart disease1Radiology, Shandong Provincial Hospital Affiliated to Shandong University, Jinan, China, 2Key Laboratory for Biomedical Engineering of Ministry of Education, Department of Biomedical Engineering, College of Biomedical Engineering & Instrument Science, Zhejiang University, Hangzhou, China, 3Shandong Provincial Hospital Affiliated to Shandong First Medical University, Jinan, China, 4Siemens Healthineers Ltd, Beijing, China
Synopsis
Fetuses with complex congenital heart disease (CHD, n=23) and healthy gestational age-matched controls (n=25) were investigated. Hemodynamics were assessed by Doppler examinations. Fetal brain MR images were segmented to get global and regional morphological measurements. Results showed that fetuses with CHD have abnormally higher umbilical artery pulsation index and smaller global and regional brain volumes as early as 20-30 weeks; however, thickness, mean curvature, and sulcal depth of different brain lobes showed no statistical difference from the healthy controls. These results add to growing evidence of antenatal brain abnormalities of the CHD fetuses during the second and early third trimesters.
Introduction
Neonatal brain MRI studies have demonstrated evidence that brain development is delayed in congenital heart disease (CHD) before corrective surgery1–3, including smaller brain volumes in mixed CHD types in the third trimester4. Impaired frontal lobe growth has also recently been shown in fetuses with CHD5. However, little is known about the hemodynamics changes, the timing of altered brain volume, and the different brain regions’ cortical development in these patients. The purpose of this study was to investigate early changes (20-30 weeks) of the hemodynamics, brain volume and different brain regions’ cortical development in fetuses with complex CHD.Materials and Methods
In this prospective study, pregnant women with singleton pregnancies with complex CHD between 20 and 30 weeks gestation (n=23) and healthy gestational age (GA)-matched controls (n=25) were enrolled. The Doppler examinations were performed on GE voluson E8 system. A specialized and experienced sonographer measured umbilical artery pulsation index (UA-PI), and the middle cerebral artery pulsation index (MCA-PI). The cerebroplacental ratio (CPR) was calculated as a ratio between MCA-PI and UA-PI. Fetal brain MR images were acquired on a 3T MR scanner (MAGNETOM Skyra, Siemens Healthcare, Erlangen, Germany) with an 18-channel body coil. Free-breathing T2-weighted half-Fourier single-shot turbo spin echo (T2-HASTE) images were obtained in orthogonal axial, coronal, sagittal planes. The parameters were: repetition/echo time TR/TE= 800/97 ms; slice thickness = 4 mm with no slice gap; voxel size = 1.1×1.1×4.0 mm3 ; and acquisition time = 16s.Figure 1 shows the overview of our pipeline of data processing. The preprocessing, including brain extraction, signal inhomogeneity correction, slice-to-volume registration, super-resolution reconstruction was performed using the NiftyMIC6, and the multiple orthogonal 2D stacks were reconstructed into high-resolution of 0.8×0.8×0.8 mm3 3D volume by NiftyMIC. The high-resolution 3D-reconstructed fetal brains were then segmented into cortical grey matter(cGM), cerebellum, lateral ventricle, and lobe regions using atlas-based segmentation with the unbiased symmetric diffeomorphic deformable registration(SyN) algorithm7. The CRL atlas8 was chosen as the reference. Segmentations were manually refined by the experts, and total brain volume (TBV), parenchyma volume (PV), cerebellar volume (CBV), lateral ventricles volume (LVV), cGM volume (cGMV), external cerebrospinal fluid spaces volume (eCSFV) and brainstem volume (BV) were computed. The cortical white matter surface and pial surface were reconstructed by dHCP-structural-pipeline9, which was modified to adapt to our fetal data (originally defined for neonates). Vertex-wise cortical indicators, including the thickness, mean curvature, and sulcal depth were computed during the reconstruction of cortical surfaces 9. And then we mapped the regional segmentation results in volume space to the surface space using workbench command (https://humanconnectome.org/software/workbench-command). Each vertex-wise indicator of different lobe regions was calculated respectively.
The association between volumes across GA was assessed with a linear regression model between CHD and normal fetuses. Comparisons of the brain volume, sulcal depth, cortical thickness, and curvature were conducted using analysis of covariance. False-discovery rates (FDR, α=0.05) correction was used for multiple testing. The PV, cGMV, CBV, BV were correlated with the UA-PI and CPR.
Results
There was no significant difference in GA between the CHD and Normal group (25.52 ±1.74 weeks, 26.05±2.16 weeks, respectively, p=0.37). The UA-PI in the CHD group was significantly higher than that in the normal group (1.08±0.13, 0.97±0.14, respectively, p=0.024). The MCA-PI and the CPR showed no significant difference between the two groups (p=0.149, 0.340, respectively). The TBV, PV, CBV, LVV, eCSFV, cGMV all showed an upward tendency and statistically significant trend across GA (Figure 2). Besides, the TBV, PV, cGMV, CBV, BSV in the CHD group were all smaller than that in the normal group (all p<0.05) after the FDR correction. However, the LVV and eCSFV showed no difference between the two groups (both p>0.05) (Table 1).Table 2 presents the cerebral cortex change in the frontal lobe, parietal lobe, temporal lobe, insula, occipital lobe, cingulate, and gyrus parahippocampalis. The surface area of the cortical plate in CHD fetuses was lower than in normal fetuses across GAs (p=0.02) but showed no statistical significance after FDR correction (p=0.44). The sulcal depth, cortical thickness, and curvature values of all the brain lobes showed no difference between the two groups (all p>0.05).
Figure 3 shows the changes of the PV, cGMV, CBV, BSV across the UA-PI and CPR in fetuses with CHD versus controls. Significant negative correlations were found between PV, cGMV, CBV, BSV and UA-PI in the normal group ( all p <0.001), but not in the CHD group (all p >0.05). Significant positive correlations were found between PV, cGMV, CBV, BSV and CPR in the normal group (p =0.01,0.001, <0.001, 0.01, respectively), but not in the CHD group (all p >0.05).
Discussion and Conclusion
This study demonstrates that fetuses with complex CHD have abnormally higher UA-PI, smaller brain volumes (TBV, PV, CBV, LVV, CSF, cGMV) as early as 20-30 weeks. However, the thickness, mean curvature, and sulcal depth at different brain lobes in the CHD group showed no statistical difference from the normal group. In addition, the changes of UA-PI and CPR in the CHD group may be a marker of impaired fetal growth velocity. Combining these findings, this study suggests that UA-PI and fetal MR imaging can be used as an early biomarker to estimate brain development in critical CHD.Acknowledgements
This
work was supported by the National Natural Science Foundation of China
[81671668] and the Natural Science Foundation of Shandong Province
[ZR201911150560].
References
1. Association between Subcortical Morphology and Cerebral White Matter Energy Metabolism in Neonates with Congenital Heart Disease. SCIeNtIfIC REPOrtS 13 (2018).
2. Claessens, N. H. P. et al. Brain and CSF Volumes in Fetuses and Neonates with Antenatal Diagnosis of Critical Congenital Heart Disease: A Longitudinal MRI Study. AJNR Am JNeuroradiol 40, 885–891 (2019).
3. Nagaraj, U. D. et al. Impaired Global and Regional Cerebral Perfusion in Newborns with Complex Congenital Heart Disease. The Journal of Pediatrics 167, 1018–1024 (2015).
4. Sun, L. et al. Reduced Fetal Cerebral Oxygen Consumption Is Associated With Smaller Brain Size in Fetuses With Congenital Heart Disease. Circulation 131, 1313–1323 (2015).
5. Paladini, D. et al. Frontal lobe growth is impaired in fetuses with congenital heart disease. Ultrasound Obstet Gynecol uog.22127 (2020) doi:10.1002/uog.22127.
6. Ebner, M. et al. An automated framework for localization, segmentation and super-resolution reconstruction of fetal brain MRI. NeuroImage 206, 116324 (2020).
7. Avants, B., Epstein, C., Grossman, M. & Gee, J. Symmetric diffeomorphic image registration with cross-correlation: Evaluating automated labeling of elderly and neurodegenerative brain. Medical Image Analysis 12, 26–41 (2008).
8. Gholipour, A. et al. A normative spatiotemporal MRI atlas of the fetal brain for automatic segmentation and analysis of early brain growth. Sci Rep 7, 476 (2017).
9. Makropoulos, A. et al. The developing human connectome project: A minimal processing pipeline for neonatal cortical surface reconstruction. NeuroImage 173, 88–112 (2018).
Figures
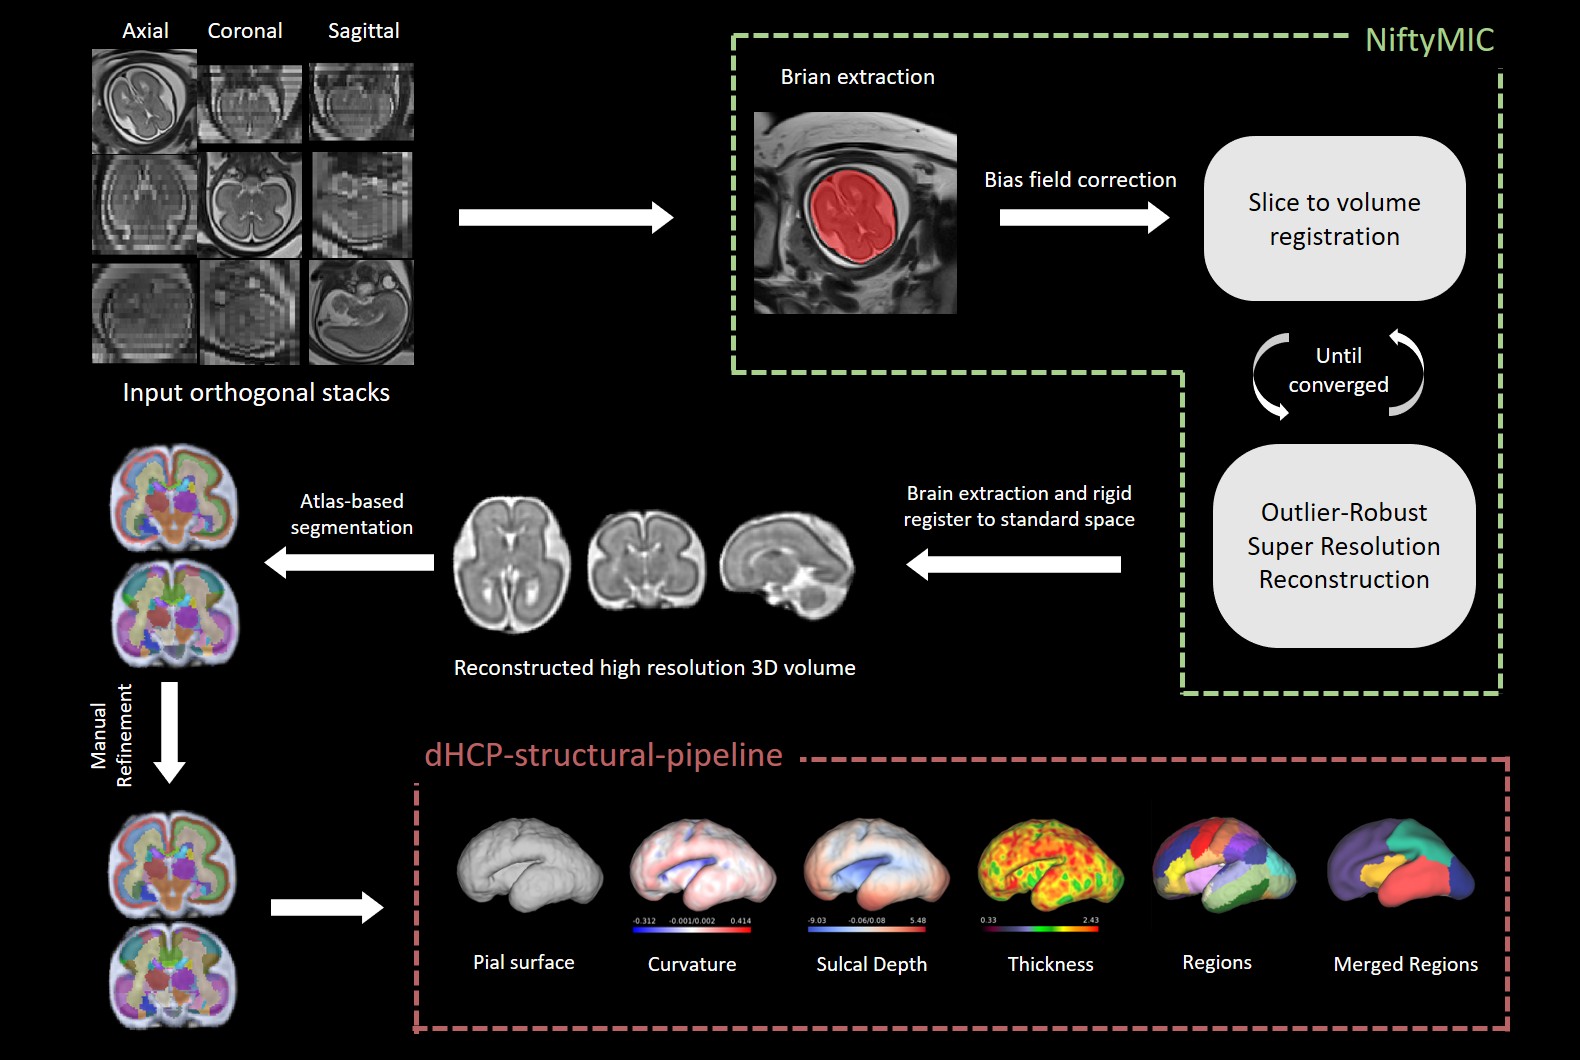
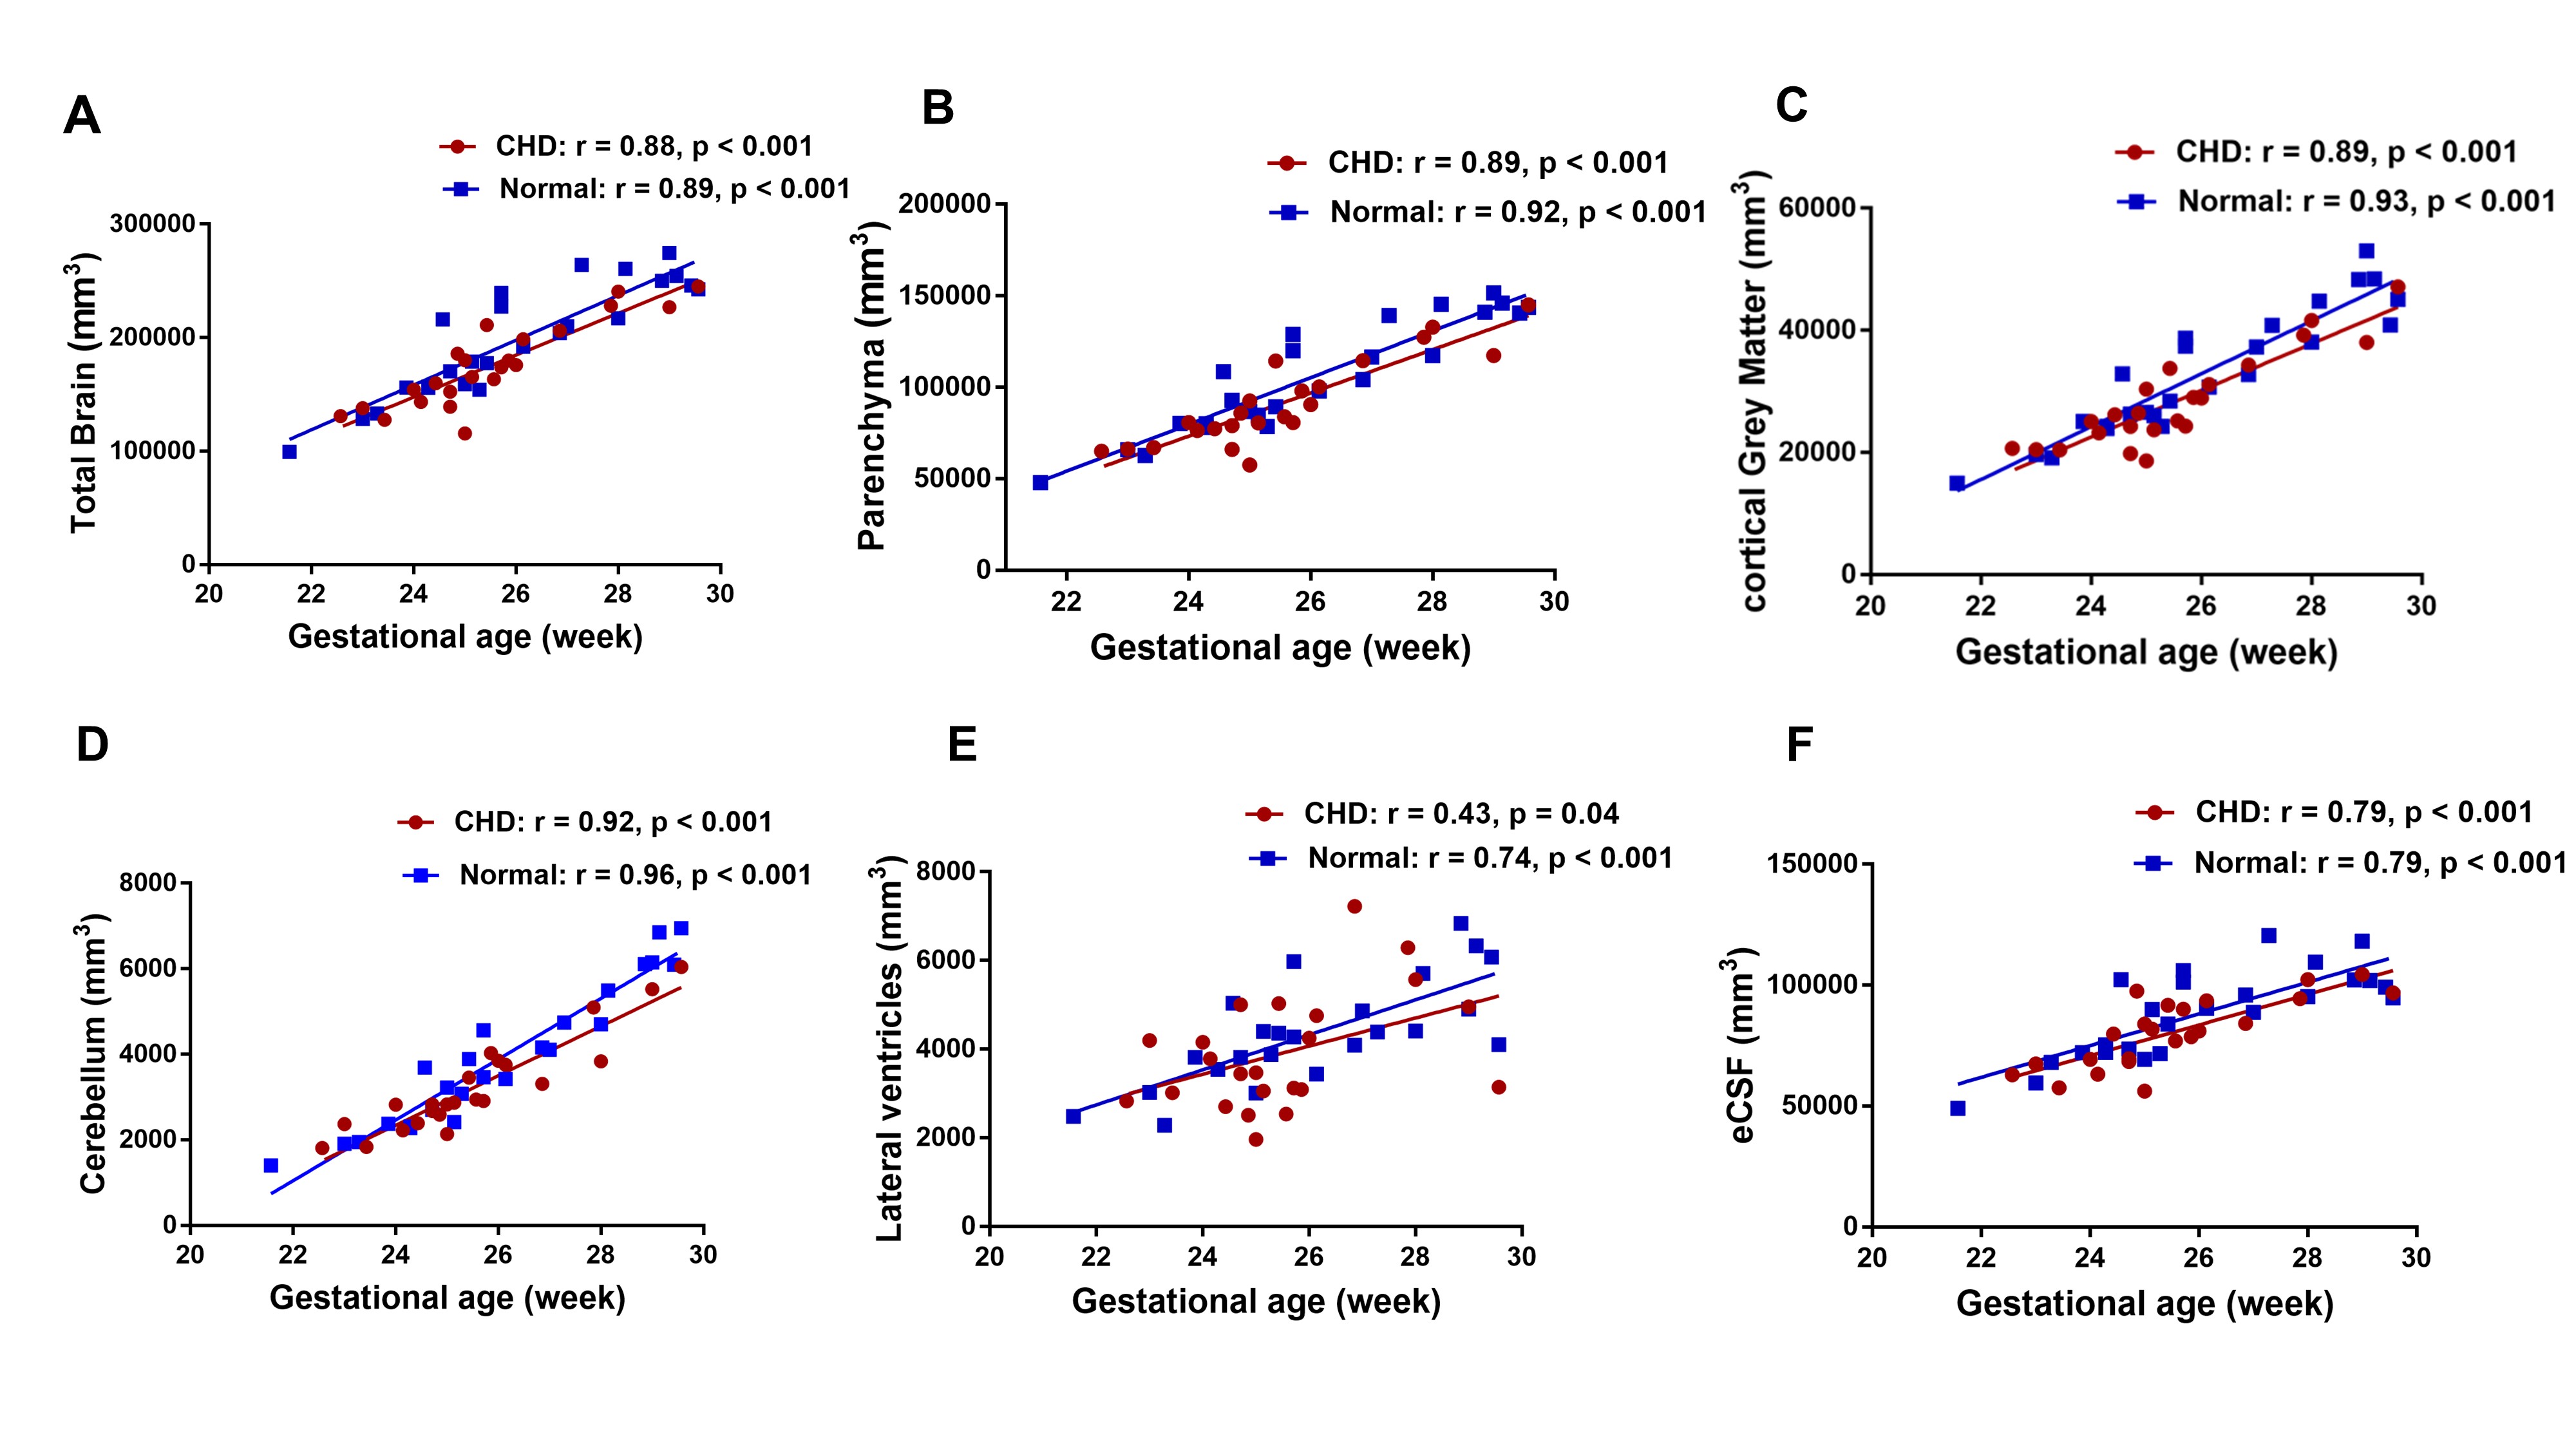
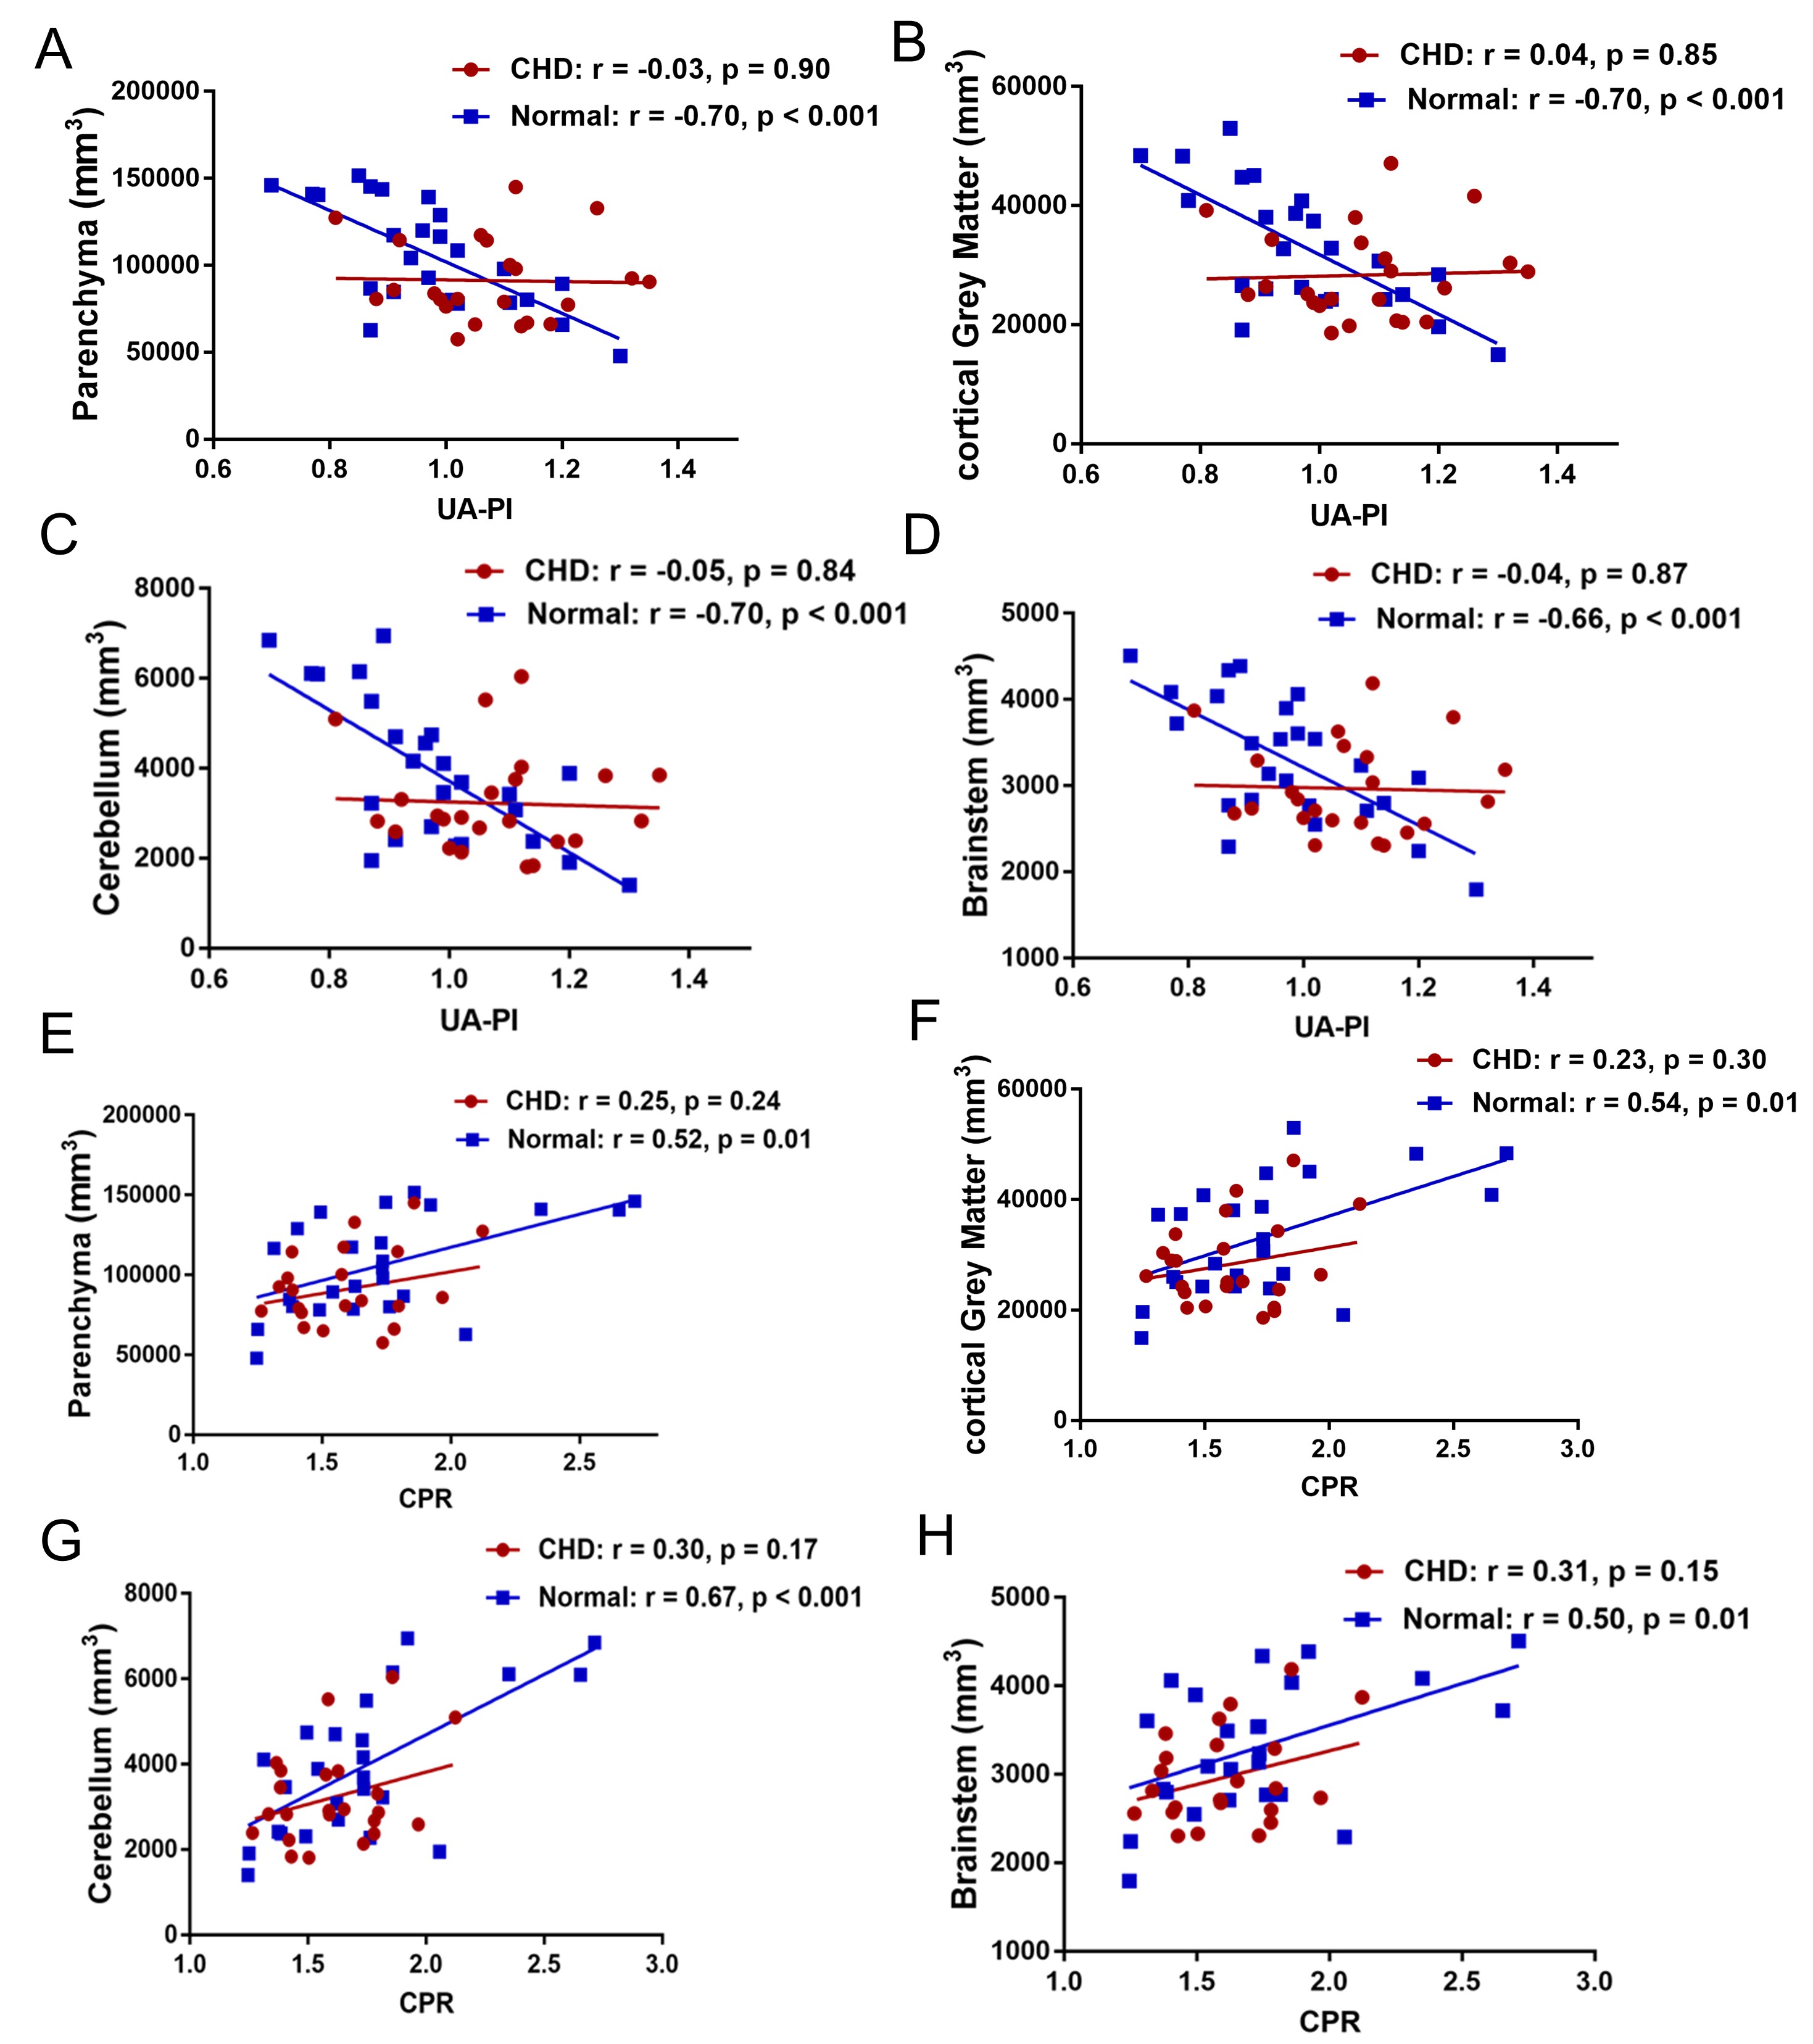
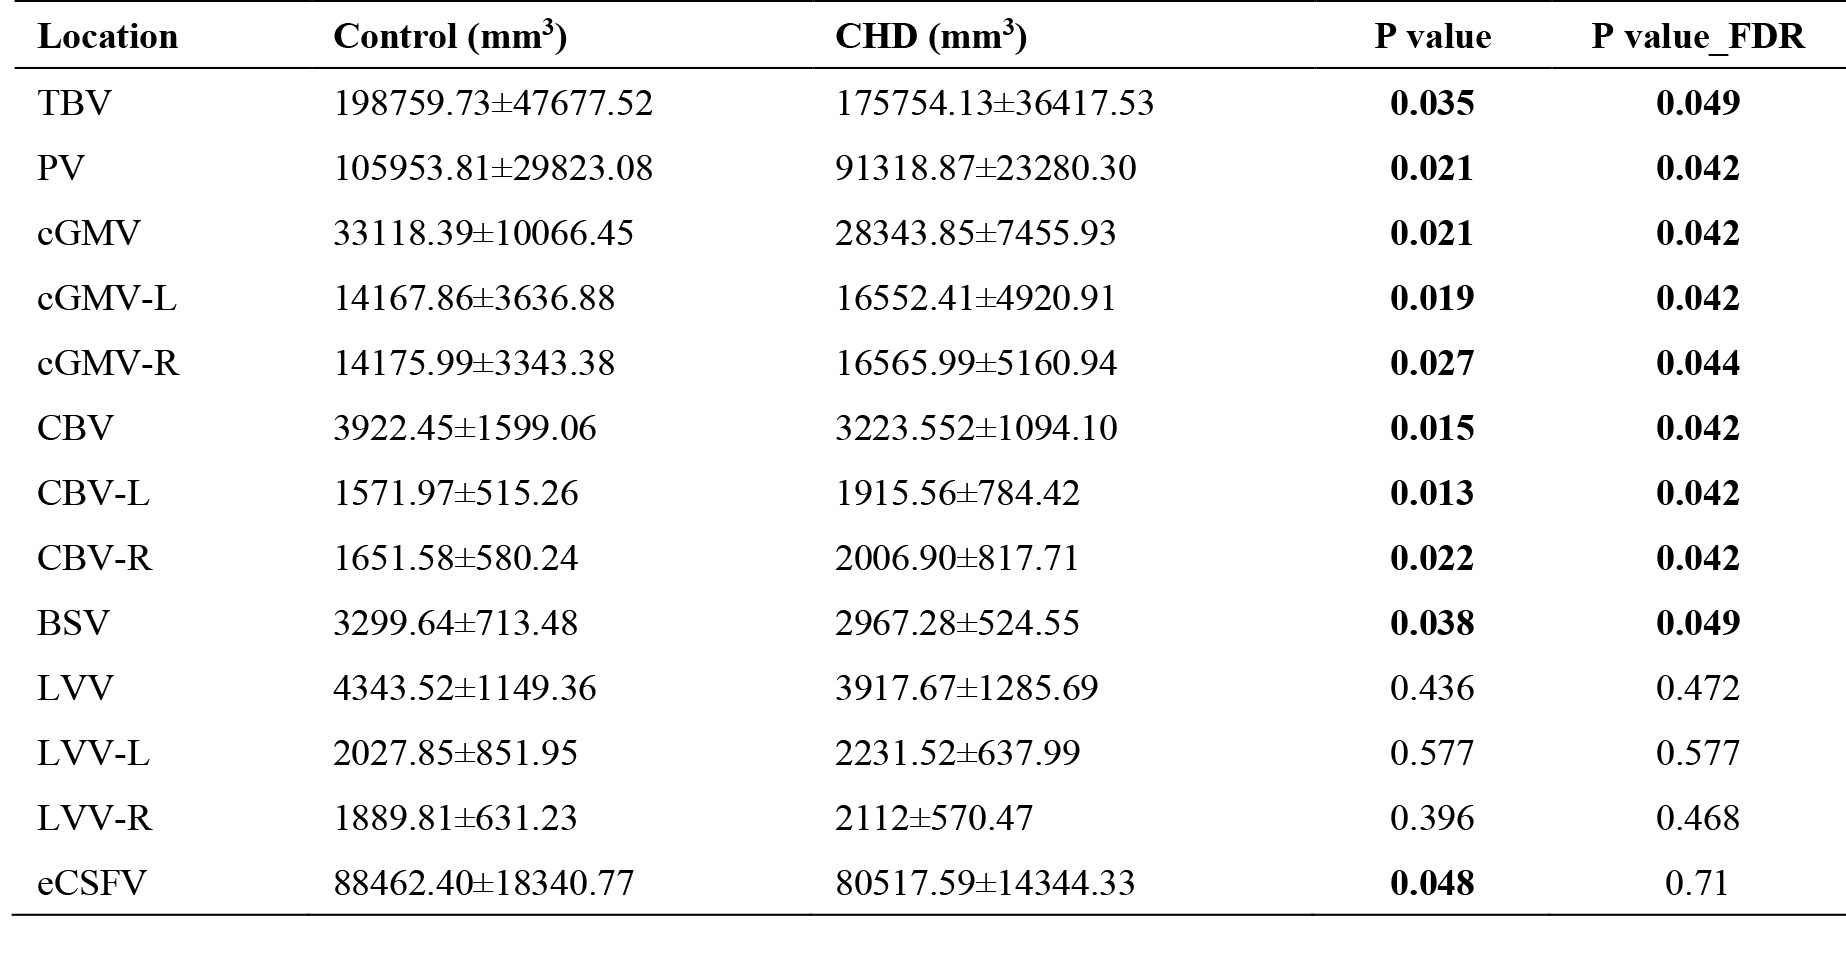
Table 1 Statistical comparisons of TBV, PV, CBV, LVV, cGMV, eCSFV, and BSV within the control group (n = 25) and within the CHD group (n = 23).
TBV: Total brain volume, PV: parenchyma volume, CBV: cerebellar volume, LVV: lateral ventricles volume, cGMV: cortical gray matter volume, eCSFV: external cerebrospinal fluid spaces volume, BSV: brainstem volume. Data are presented as mean ± SD, ∗P < 0.05, ∗∗FDR p < 0.05.
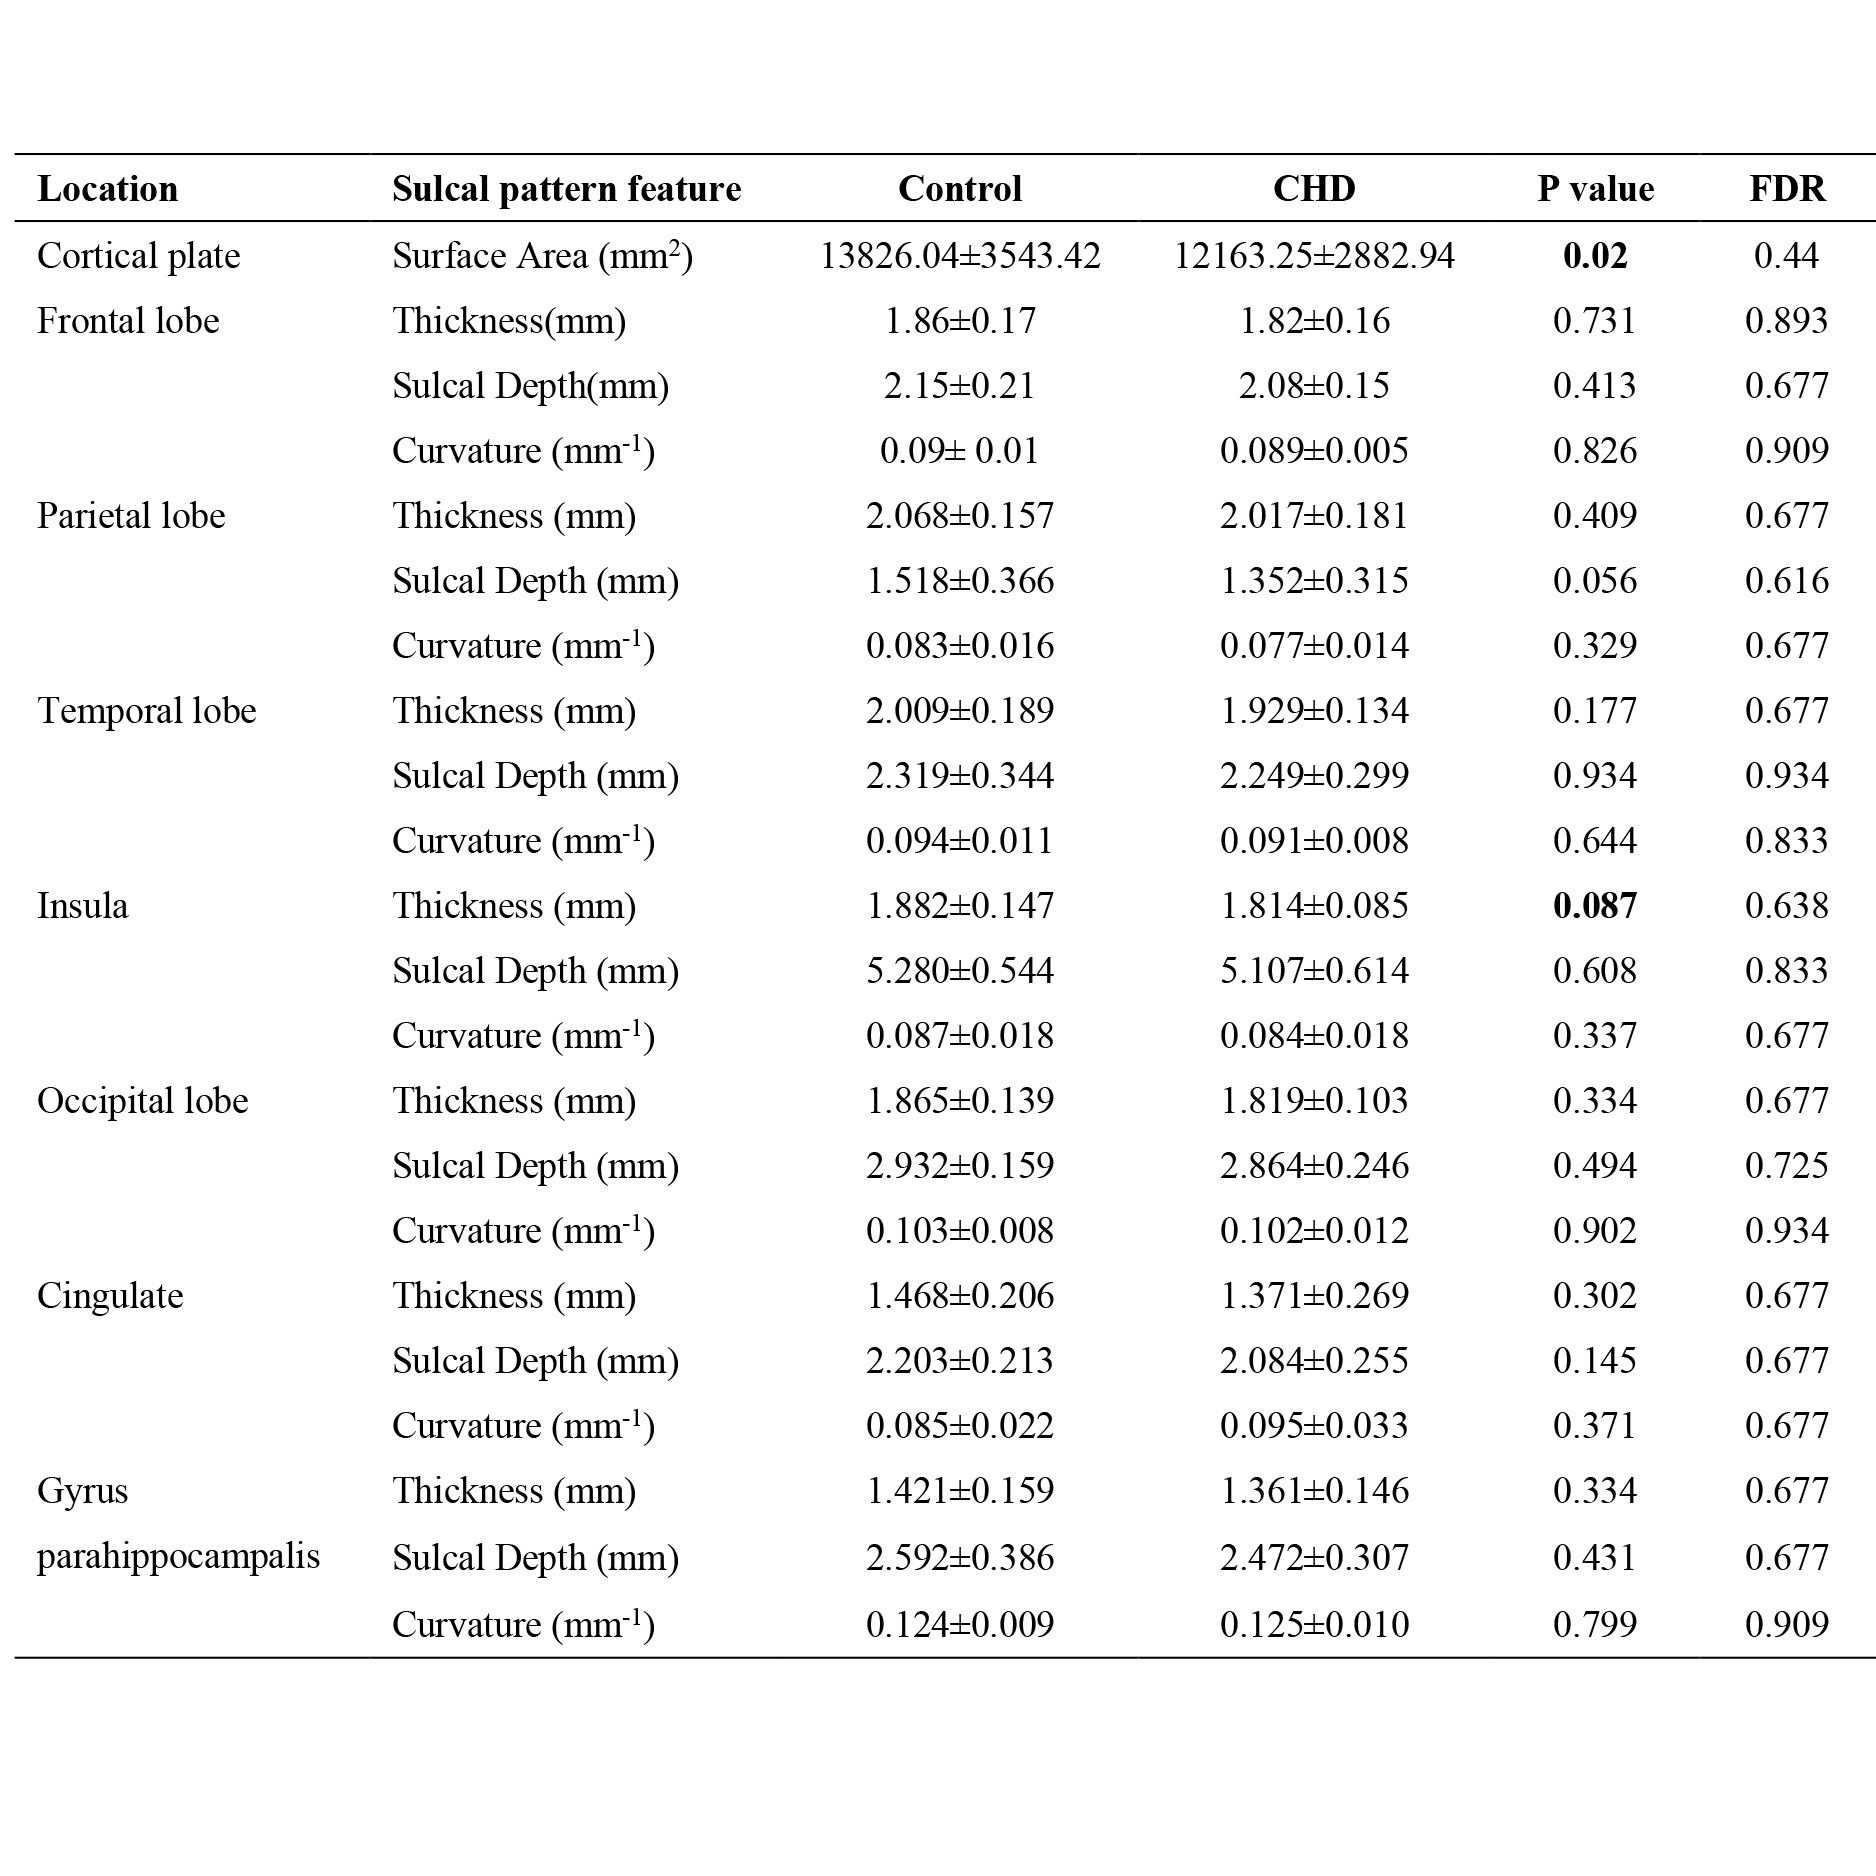
Table 2 Statistical comparisons of the sulcal pattern similarity among the control group (n = 25) and CHD (n = 23) group.
Data are presented as mean ± SD, ∗P < 0.05, ∗∗FDR p < 0.05.