3728
Whole-brain oxygen metabolism in adults with sickle-cell disease using susceptometry and T2-based method1Department of Electrical Engineering, National Sun Yat-sen University, Kaohsiung, Taiwan, 2Department of Radiology, University of Pennsylvania, Philadelphia, PA, United States
Synopsis
SvO2 and CMRO2 in patients with sickle cell anemia (SCA) were evaluated by MR susceptibility-based oximetry and compared with that derived from T2-based methods. The results show that (1) SvO2 trends lower and OEF tends to be higher in T2-based methods, (2) there is high correlation of CMRO2 between SBO and HbS model, (3) CMRO2 derived from SBO indicates tCBF was elevated to maintain oxygen delivery and oxygen metabolism in the brain given that CMRO2 is comparable with the healthy subjects reported previously. The preliminary results demonstrate the feasibility of OEF and CMRO2 estimation via SBO in subjects with SCA.
INTRODUCTION
Sickle cell anemia (SCA) is an inherited disorder characterized by a genetic mutation leading to the formation of abnormal hemoglobin, hemoglobin S (HbS). As a consequence, hematocrit decreases (i.e. fewer blood cells) and thus cerebral blood flow rate (CBF) is elevated to maintain oxygen delivery and meet the oxygen metabolism in the brain 1. Oxygen extraction fraction (OEF) can be derived from the measurement of global venous oxygen saturation (SvO2), and has been considered as a more sensitive indicator for cerebral ischemia and strokes in SCA 2. T2-relaxation under spin tagging (TRUST) based methods have been widely employed for assessment of cerebral oxygen extraction and metabolism 3. On the other hand, susceptibility-based oximetry (SBO), as a great alternative for SvO2 estimation without any empirical calibration involved, has showed good agreement with measures from TRUST in young healthy subject 4. In this study, the SBO-based approach, referred to as OxFlow, was performed to simultaneously measure CBF and SvO2. We investigated the measures of SvO2, OEF and cerebral metabolic rate of oxygen (CMRO2) in SCA patients by OxFlow and compared with those derived from T2-based method.METHODS
Ten subjects with SCA (mean age 29.2 years, height 1.7 m, weight 73.4 kg) were enrolled. A two-slice interleaved OxFlow sequence (Fig. 1) was employed to simultaneously quantify cerebral venous oxygen saturation (SvO2) in the superior sagittal sinus along with whole-brain cerebral blood flow rate (tCBF) by phase-contrast velocimetry in the internal carotid and vertebral arteries. SaO2 was obtained by pulse oximeter and CMRO2 was derived from the three measured parameters using Fick’s principle, CMRO2=CaO2 ·tCBF·OEF, where CaO2 is arterial O2 content, representing the amount of oxygen that a unit volume of artery carries, along with tCBF, yielding oxygen delivery rate (DO2).Imaging was performed at 3.0T (Siemens Prismafit) using a 64-channel head coil. Imaging parameters for OxFlow protocol were: 1x1x5 mm3 voxel size, flip angle of 25°, TR/TE1/ΔTE=35/5/7.04 ms in the head level for SvO2, and 0.85x0.85x5 mm3 voxel size, flip angle of 20°, TR=35/7.22 ms, VENC=60cm/sec in the neck level for CBF. MPRAGE images used for calculation of brain volume were segmented into grey and white matter using SPM12. CBF was then normalized to 100g of brain tissue, termed as tCBF. Scan parameters of TRUST were: 3.6x3.6x10 mm3 voxel size, flip angle of 25°, TR/TE=3000/7.47 ms for EPI readout, TI=1200ms beween blood tagging and imaging, effective TEs = 0, 40, 80, and 160 with 𝜏180= 10 ms for T2 measurement. T2 was subsequently converted to SvO2 based on bovine calibration 5 and HSb calibration 6, the latter with A=70.0 s-1 and B=5.75 s-1 via the equation of R2=A·(1-SvO2)2+B (2) in this study.
Bland and Altman analysis and Spearman’s correlation were computed for comparison between SBO and HbS-based model. ANOVA was performed to determine significance of differences of SvO2 dependent parameters among SBO, HbS and bovine models. A P-value < 0.05 was considered as the criterion for statistical significance.
RESULTS
Table 1 lists the SvO2 independent physiologic parameters. The CaO2 is comparable with the previous results in SCA and lower than the healthy subjects 7. Total CBF is greater relative to the control reported in a literature using the basic OxFlow sequence 8. SBO shows higher value of SvO2 as compared to the estimation via bovine model (P<0.01) and HbS model (P>0.05, Fig. 2A). The trend of lower SvO2 in patients with SCA in bovine model relative to SBO is consistent with the report in healthy subjects 4. Figure 2B demonstrates good correlation in OEF between SBO and HbS model although the mean value was lower via SBO (P>0.05). There is a substantial increase in CMRO2 estimation via HbS model (P>0.05, Fig. 2C and Table 2) and bovine model (P<0.01, Table 2), yielding suspicious high CMRO2 especially in bovine model. On the other hand, extremely high correlation in CMRO2 was evident between SBO and HbS (𝜌=0.84, P<0.005, Fig. 2D), indicating the feasibility of SBO in evaluation of cerebral oxygen metabolism in SCA study. SBO shows smaller OEF, implying lower likelihood of stroke in SCA patients in this study. CMRO2 via SBO is comparable with the healthy subjects reported previously 9, which indicates that autoregulation of tCBF was sufficient to compensate oxygen delivery and maintain the cerebral metabolism for patients in this study. All the SvO2 dependent physiologic parameters are summarized in Table 2.CONCLUSIONS
The purpose of the present study was to evaluate SvO2 in subjects with SCA via susceptibility-based oximetry (SBO). The OxFlow sequence conducted in this study enables simultaneous acquisition of PC-MRI and phase difference map for tCBF and SvO2 estimation, respectively. Besides the bias caused by empirical T2 calibrations, additional errors from pairwise subtraction of images may be carried into T2-based SvO2 estimation due to body motion. In contrast, one acquisition for both tCBF and SvO2 is especially favorable for clinical studies as higher compliance of subjects can be expected. In conclusion, the results indicated SBO can be an excellent alternative for OEF and CMRO2 estimation, in well agreement with studies assessing the physiologic parameters in patients with SCA. Collection of age-matched healthy subjects is needed for further investigation.Acknowledgements
No acknowledgement found.References
1. Bush, A.M., et al., Determinants of resting cerebral blood flow in sickle cell disease. Am J Hematol, 2016. 91(9): p. 912-7.
2. Fields, M.E., et al., Regional oxygen extraction predicts border zone vulnerability to stroke in sickle cell disease. Neurology, 2018. 90(13): p. e1134-e1142.
3. Lu, H. and Y. Ge, Quantitative evaluation of oxygenation in venous vessels using T2-Relaxation-Under-Spin-Tagging MRI. Magn Reson Med, 2008. 60(2): p. 357-63.
4. Barhoum, S., et al., Comparison of MRI methods for measuring whole-brain venous oxygen saturation. Magn Reson Med, 2015. 73(6): p. 2122-8.
5. Lu, H., et al., Calibration and validation of TRUST MRI for the estimation of cerebral blood oxygenation. Magn Reson Med, 2012. 67(1): p. 42-9.
6. Bush, A.M., T.D. Coates, and J.C. Wood, Diminished cerebral oxygen extraction and metabolic rate in sickle cell disease using T2 relaxation under spin tagging MRI. Magn Reson Med, 2018. 80(1): p. 294-303.
7. Li, W., et al., Quantification of whole-brain oxygenation extraction fraction and cerebral metabolic rate of oxygen consumption in adults with sickle cell anemia using individual T2 -based oxygenation calibrations. Magn Reson Med, 2020. 83(3): p. 1066-1080.
8. Jain, V., M.C. Langham, and F.W. Wehrli, MRI estimation of global brain oxygen consumption rate. J Cereb Blood Flow Metab, 2010. 30(9): p. 1598-607.
9. Jain, V., et al., Rapid magnetic resonance measurement of global cerebral metabolic rate of oxygen consumption in humans during rest and hypercapnia. J Cereb Blood Flow Metab, 2011. 31(7): p. 1504-12.
Figures
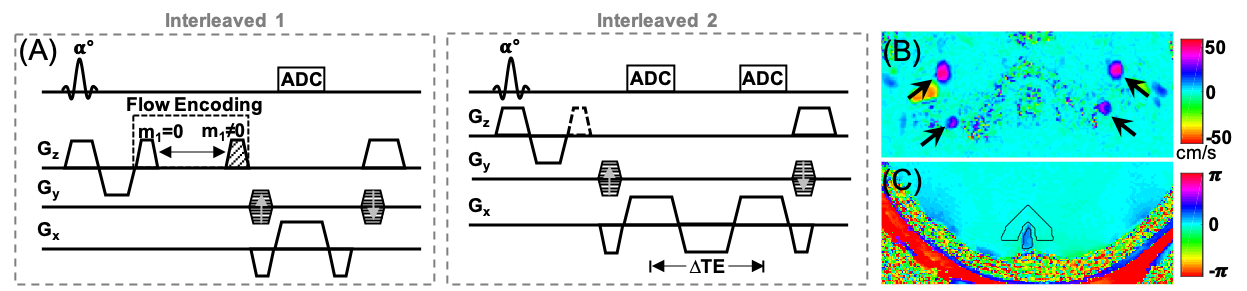
Figure 1. Two-slice interleaved OxFlow pulse sequence (A) used for quantification of CBF (interleaved 1) and SvO2 (interleaved 2). (B) Velocity map in the neck level obtained from two repeats differing in the first moment of the z-gradient (blood flow direction), and (C) phase difference map at the head level calculated from the first and third echo. Arrow heads indicate internal carotid and vertebral arteries.

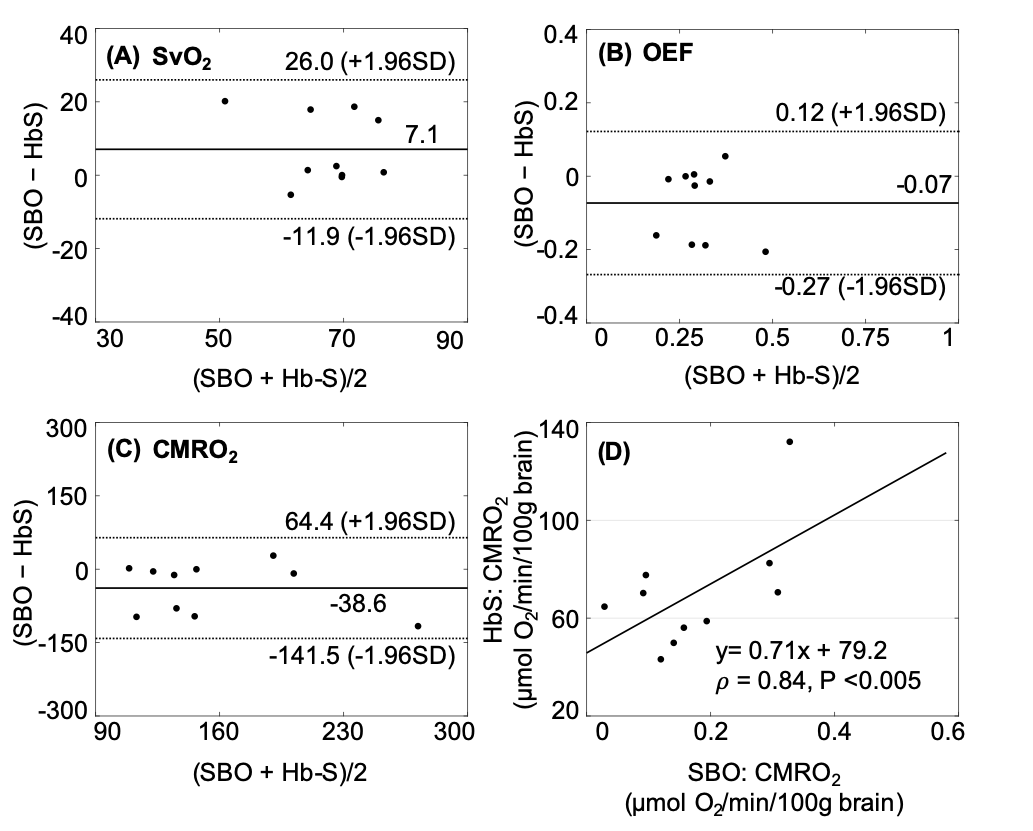
Figure 2. Bland and Altman and scatter plots. (A, B) Similar but slightly greater SvO2 and even OEF in susceptibility-based method (SBO) as compared to HbS model. (C, D) High correlation of CMRO2 between SBO and HbS, while substantial increase in CMRO2 from HbS.
