3724
The value of synthetic MRI in detecting the brain change and hearing impairment of children with sensorineural hearing loss1The Third Affiliated Hospital of Zhengzhou University, Zhengzhou, China, 2MR Research,GE Healthcare,Beijing,China, Beijing, China
Synopsis
Study explored the brain development of children with sensorineural hearing loss (SNHL),which may cause children's language discrimination ability and voice localization ability worse.The auditory pathway was regarded impaired and the related brain structure may change in SNHL,especially in early development stage for children age less than 3 months.Studies with Diffusion tensor imaging,diffusion kurtosis imaging and fMRImainly investigate the patient age over 2 years old,when it’s a timechildren's brain is myelinated[1] .
Synthetic MRI was used in this study to quantitatively evaluate the differences among normal and SNHL with varying degree of hearing loss. The quantitative value of T1 in inferior colliculus,lateral lemniscus and middle cerebellar peduncle were found help early diagnosis of hearing loss of SNHL infants.
Introduction
Sensorineural hearing loss (SNHL) is a type of deafness that occurs prior to language development during pregnancy. The auditory neural pathways could be impaired in SNHL.About 1.2 to 1.7 cases per 1,000 live births may develop to Permanent childhood hearing loss due to SNHL, and up to 30% cases have profound hearing loss[2].Delayed diagnosis of hearing loss in infants and young children with SNHL can result in severe deficits in learning and development. Though the auditory brainstem response (ABR) test has been commonly used for hearing screening of newborns, quantitative and more sensitive indexes are necessary for early and accurate diagnosis.Diffusion tensor imaging (DTI), diffusion kurtosis imaging (DKI) and fMRI have been used to diagnose the SNHL and investigate the brain development of SNHL infants[6].Most of the studies collected subjects older than 2 years old, when it is late to improve children's language discrimination ability by treating SNHL.Synthetic MRI (SyMRI) is the relaxation quantification imaging technology which provides the T1 and T2 relaxation times and proton density (PD) in one scan within the clinical accepted acquisition time[3,4]. T1 and T2 values have been considered as sensitive biomarker for change of brain structure in brain development investigation and related diseases[5,7,8], but few in SNHL. The aim of the study was trying to quantitatively assess the brain structure change in young children age from(1.4-3months)with SNHL by using the Synthetic MRI.Materials and Methods
Materials and MethodsThe study was approved by the local ethics committee. A total of 53 children with SNHL(1.4-3months)23 with unilateral sensorineural hearing loss,30 with bilateral sensorineural hearing loss were collected. All children underwent auditory brainstem response (ABR) to check the hearing threshold.The severity of hearing loss in each ear was classified as mild (31–50 dB), moderate (51– 70 dB), and severe (> 70 dB). Synthetic MRI using the magnetic resonance imaging compilation (MAGiC) imaging on a 3.0 T scanner (SIGNA. Pioneer; GE Healthcare, Waukesha, WI, USA) using a 21-channel head coil were performed for all subjects.The sequence parameters for synthetic MRI are as follows: FOV = 200 mm, slice thickness = 3mm, slice gap = 0.5 mm, number of slices = 36, TR/TE = 4230/20.4 ms, acquisition time = 5 min 8sec. The quantification maps (T1, T2, and PD map) were obtained with the vendor-provided program (SyMRI 8.0; SyntheticMR, Linköping, Sweden). Regions of interest (ROIs) were manually placed on the T1 image at 24 brain regions related with brain development as shown in Figure 1. SPSS 25.0 statistical analysis software was used for the data analysis. The measurement data in line with normal distribution were expressed in Mean ± SD . LSD test was used for pairwise comparison.
Results
No significant difference was found among the normal,mild, moderate and severe for T2 and PD value in all the 24 brain regions while there were significant differences for T1 values in brain regions of inferior colliculus (IC, Figure 2 A), lateral lemniscus (LL, Figure 2 B), middle cerebellar peduncle (MCP, Figure 2 C).With increased degree of hearing loss, the T1 values increased in IC and LL,which is significant except between the normal and mild group,mild and moderate group for IC and between the moderate and severe for LL.For MCP, significant differences were between normal and moderate group/severe group.The quantification of T1 values were summarized in Table 1.Discussion and Conclusion
The development and maturation of the brain proceed in a certain order.The formation of the myelin sheath of the brain begins at the fifth month of the fetus,develops with the myelin sheath of the central nerve, and lasts for a lifetime[9].In conventional MRI images,the myelination of the white matter begins,and the signal intensity of the white matter is higher than that of the cortex on T1WI.Within 6 ~ 8 months,the myelination of the white matter has begun,after 18 months,the myelin sheath of most white matter matured[9,10,11].The increase in T1 may be due to hearing impairment causing the development and maturation of these parts to slow down.According to the literature,the development law of white matter in infants is that white matter develops from dorsal to ventral,from caudal to cephalic,from center to periphery[12].The inferior colliculus,lateral lemniscus and middle cerebellar peduncle are all parts of early development.T1 can be used as a potential marker for early brain development detection in children with SNHL.The quantification in the inferior colliculus,lateral lemniscus and middle cerebellar peduncle can be used to distinguish patients with moderate to severe SNHL.Acknowledgements
No acknowledgement found.References
[1] Wang Shanshan,Chen Boyu,Yu Yalian et al. Alterations of structural and functional connectivity in profound sensorineural hearing loss infants within an early sensitive period: A combined DTI and fMRI study.[J] .Dev Cogn Neurosci, 2019, 38: 100654.
[2] Paludetti G,Conti G,DI Nardo W et al. Infant hearing loss: from diagnosis to therapy Official Report of XXI Conference of Italian Society of Pediatric Otorhinolaryngology.[J] .Acta Otorhinolaryngol Ital, 2012, 32: 347-70.
[3] Chari Divya A,Chan Dylan K,Diagnosis and Treatment of Congenital Sensorineural Hearing Loss.[J] .Curr Otorhinolaryngol Rep, 2017, 5: 251-258.
[4] Warntjes JB, Leinhard OD, West J, Lundberg P (2008) Rapid magnetic resonance quantification on the brain: optimization for clinical usage. Magn Reson Med 60:320–329.
[5] Suh Young Hwa,Kang Yeonah,Baek Moo Jin et al. T2 relaxation time shortening in the cochlea of patients with sudden sensory neuronal hearing loss: a retrospective study using quantitative synthetic magnetic resonance imaging.[J] .Eur Radiol, 2021, undefined: undefined.
[6] Wang Hanlin,Liang Yi,Fan Wenhui et al. DTI study on rehabilitation of the congenital deafness auditory pathway and speech center by cochlear implantation.[J] .Eur Arch Otorhinolaryngol, 2019, 276: 2411-2417.
[7] Schmidbauer Victor,Geisl Gudrun,Diogo Mariana et al. SyMRI detects delayed myelination in preterm neonates.[J] .Eur Radiol, 2019, 29: 7063-7072.
[8] Vanderhasselt Tim,Zolfaghari Roya,Naeyaert Maarten et al. Synthetic MRI demonstrates prolonged regional relaxation times in the brain of preterm born neonates with severe postnatal morbidity.[J] .Neuroimage Clin, 2021, 29: 102544.
[9] Mukherjee P,Miller J H,Shimony J S et al. Normal brain maturation during childhood: developmental trends characterized with diffusion-tensor MR imaging.[J] .Radiology, 2001, 221: 349-58.
[10]Brex P A,Parker G J,Leary S M et al. Lesion heterogeneity in multiple sclerosis: a study of the relations between appearances on T1 weighted images,T1 relaxation times, and metabolite concentrations.[J] .J Neurol Neurosurg Psychiatry, 2000, 68: 627-32.
Figures
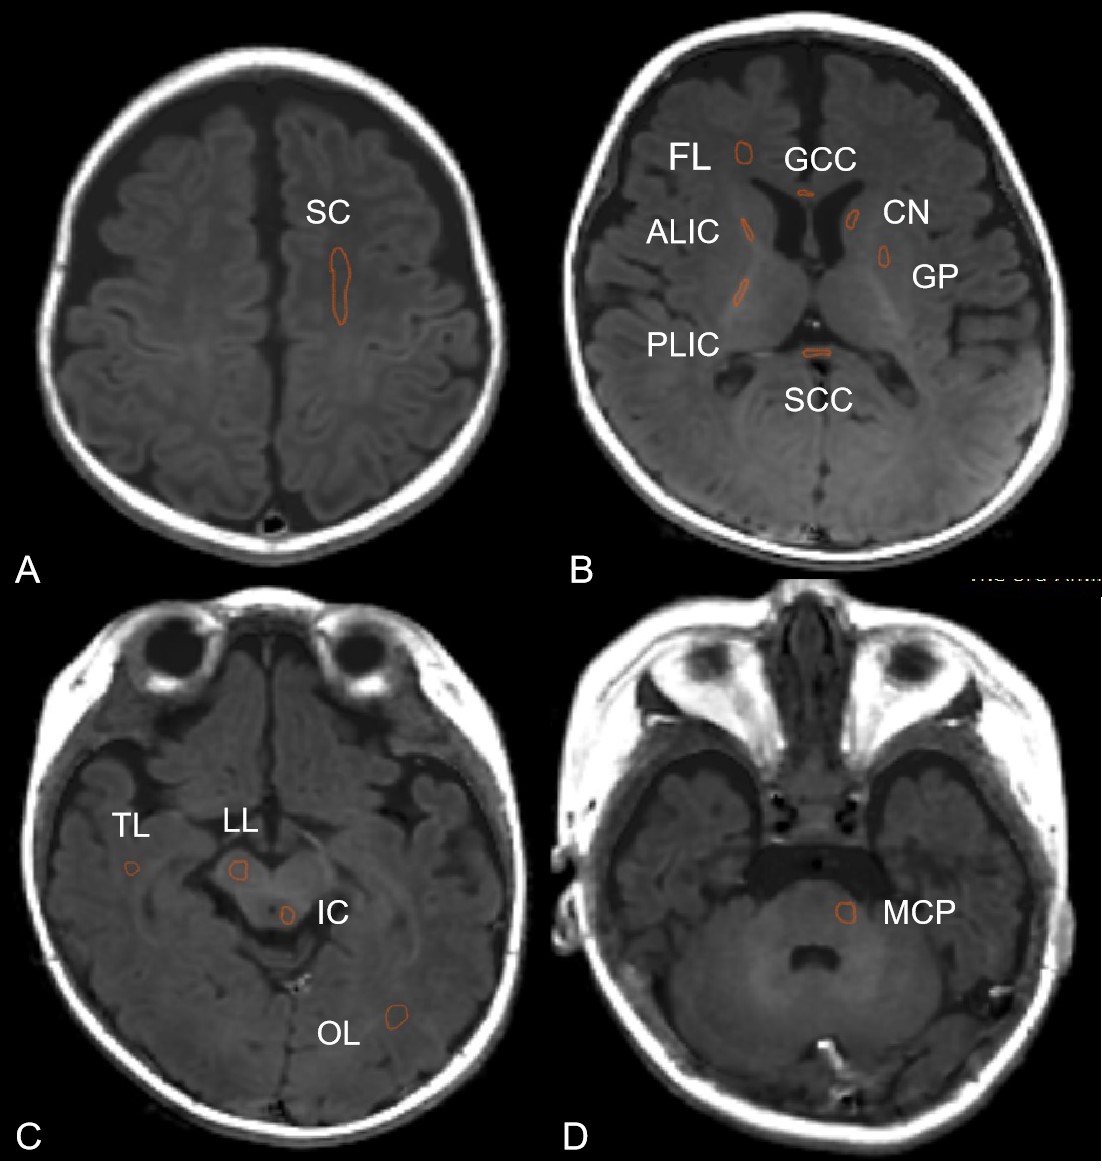
Figure 1 Male 3months Regions of interest (ROIs) delineation on T1 image. (A) Semioval Center(SC); (B)Frontal lobe(FL), Anterior limb of internal capsule (ALIC), Posterior limb of the internal capsule (PLIC), Genu of the corpus callosum (G-CC), Splenium of the corpus callosum (S-CC),Caudate nucleus(CN),Globus pallidus (GP); (C) Inferiorcolliculus (IC), Lateral lemniscus (LL); (D)Middle cerebellar peduncle (MCP).
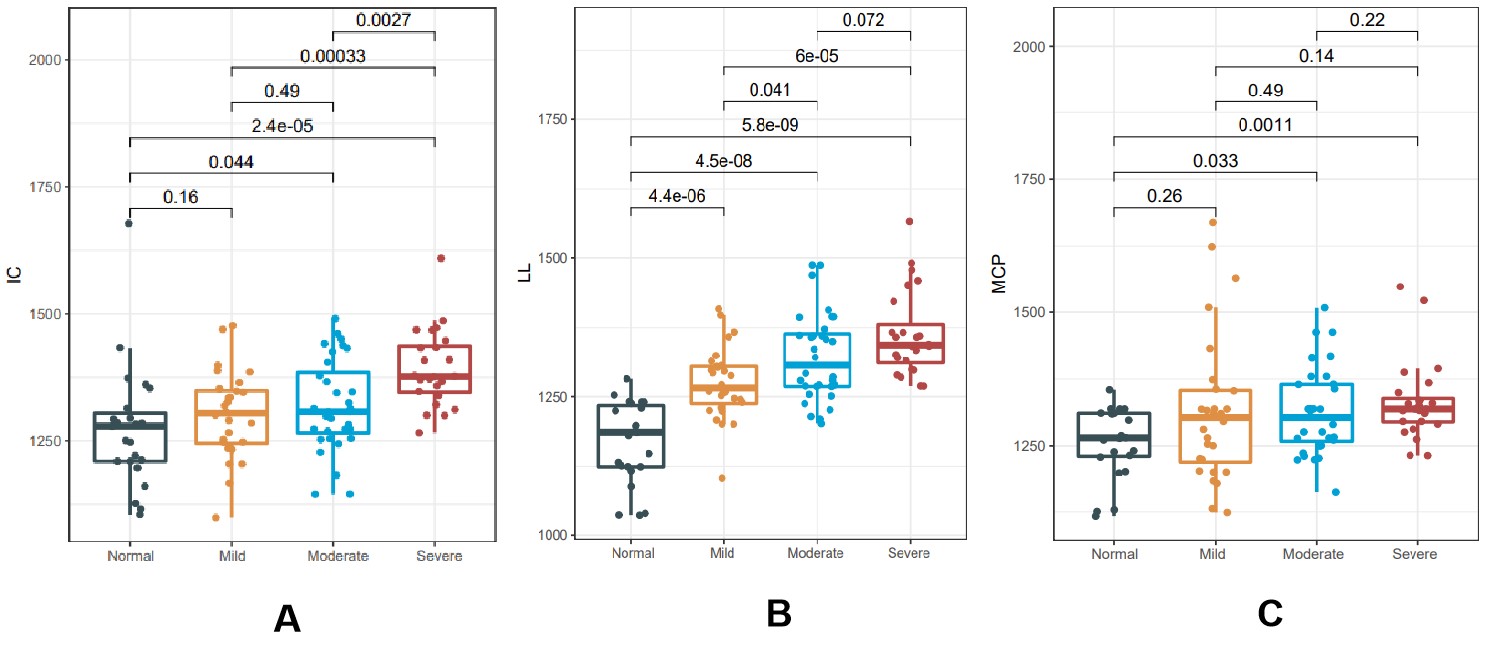
Figure 2A The comparison of the T1 value of Inferior colliculus (IC) among normal, mild, moderate and severe groups. 2B The comparison of the T1 value of Lateral lemniscus (LL) among normal, mild, moderate and severe groups. 2C The comparison of the T1 value of Middle cerebellar peduncle (MCP) among normal, mild, moderate and severe groups.
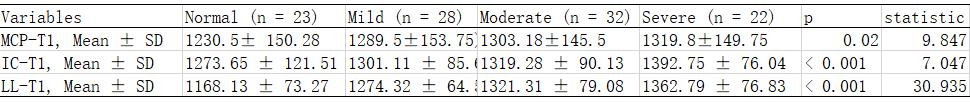
Table 1 Average and standard deviation of T1 in Middle cerebellar peduncle(MCP) ,Inferior colliculus(IC) and Lateral lemniscus(LL) for 4 groups.