3720
Cortical development over the first 13 years of life after very preterm birth
Claire Kelly1,2,3, Deanne K Thompson2,3,4, Chris Adamson3, Gareth Ball3,4, Thijs Dhollander3, Richard Beare3, Bonnie Alexander3,5, Jeanie LY Cheong2,6,7, Marc L Seal3,4, Terrie E Inder8, Lex W Doyle2,4,6,7, and Peter J Anderson1,2
1Turner Institute for Brain and Mental Health, School of Psychological Sciences, Monash University, Melbourne, Australia, 2Victorian Infant Brain Studies (VIBeS), Murdoch Children's Research Institute, Melbourne, Australia, 3Developmental Imaging, Murdoch Children's Research Institute, Melbourne, Australia, 4Department of Paediatrics, The University of Melbourne, Melbourne, Australia, 5Department of Neurosurgery, The Royal Children's Hospital, Melbourne, Australia, 6The Royal Women's Hospital, Melbourne, Australia, 7Department of Obstetrics and Gynaecology, The University of Melbourne, Melbourne, Australia, 8Department of Pediatric Newborn Medicine, Brigham and Women’s Hospital, Harvard Medical School, Boston, MA, United States
1Turner Institute for Brain and Mental Health, School of Psychological Sciences, Monash University, Melbourne, Australia, 2Victorian Infant Brain Studies (VIBeS), Murdoch Children's Research Institute, Melbourne, Australia, 3Developmental Imaging, Murdoch Children's Research Institute, Melbourne, Australia, 4Department of Paediatrics, The University of Melbourne, Melbourne, Australia, 5Department of Neurosurgery, The Royal Children's Hospital, Melbourne, Australia, 6The Royal Women's Hospital, Melbourne, Australia, 7Department of Obstetrics and Gynaecology, The University of Melbourne, Melbourne, Australia, 8Department of Pediatric Newborn Medicine, Brigham and Women’s Hospital, Harvard Medical School, Boston, MA, United States
Synopsis
Longitudinal cortical development following very preterm (VP) birth has been infrequently studied. We undertook a unique longitudinal MRI study of 202 VP infants and 66 term-born infants from shortly after birth to age 13 years. Longitudinal changes in surface-based volume, area and thickness measurements for 62 cortical regions were modelled using generalised additive models. We reveal cortical alterations in the neonatal period and altered cortical development in the early years of life following VP birth. Cortical alterations persisted to age 13, with several regions of reduced volume and area, thickness reductions in temporal regions, and thickness increases in frontal regions.
Introduction
Previous studies reported brain structural alterations in those born very preterm (VP) compared with term-born controls at cross-sectional timepoints in infancy, childhood and adulthood[1-3]. Longitudinal brain development following VP birth has been less frequently studied. Based on some existing studies, there is evidence for altered brain volumetric development in VP children, particularly in early years of life[4-10]. Cortical volume is the product of its area and thickness, which are genetically and phenotypically independent[11]. However, studies have not examined area and thickness changes from the neonatal period to later in childhood following VP birth. We investigated consequences of VP birth on cortical development, including volume, area and thickness trajectories, from term-equivalent age to 13 years of age.Methods
Participants: This was a prospective longitudinal cohort study of 202 VP infants (<30 weeks’ gestation) and 66 term-born control infants (≥37 weeks’ gestation), who underwent MRI at term-equivalent age (38-42 weeks), 7 (6.6-8.1) years of age and 13 (11.8-15.1) years of age.MRI analysis: Neonatal T1w images were processed with a specialised pipeline: tissue segmentation using iBEAT V2.0[12-15], cortical surface reconstruction using a modified version of M-CRIB-S tuned for T1w image contrast[16-18], and cortical parcellation using the M-CRIB-S-DKT atlas[16], which is compatible with the Desikan-Killiany-Tourville atlas available within FreeSurfer[19]. The 7-year and 13-year T1w images were processed using the FreeSurfer V6 standard pipeline[20], including tissue segmentation, cortical surface reconstruction and cortical parcellation using the Desikan-Killiany-Tourville atlas[19]. Surface-based volume, area and thickness measurements were extracted from 62 equivalent cortical regions per timepoint.
Statistical analysis: Volume, area and thickness of each region were compared between groups (VP/control) separately at each cross-sectional timepoint, using linear regressions adjusted for age and sex (and secondarily for total brain volume (TBV)). Longitudinal volume, area and thickness development of each region across the entire age period was modelled using generalised additive models; non-parametric alternatives to linear models with no assumptions on the shape of trajectories, which is estimated during model fitting[21,22]. For each region, we modelled volume, area and thickness separately as a smooth function of age with fixed effects of group and sex. To test the hypothesis that longitudinal cortical development differed between groups, we included a group-by-age interaction. To account for longitudinal observations, we included a random intercept for each participant.
Results
Cross-sectional: The VP group exhibited significantly lower volume and area than controls across frontal, parietal and temporal regions at each timepoint. The VP group displayed significantly higher volume or area than controls only in pericalcarine (at term-equivalent age and 13 years of age) and entorhinal regions (at 13) (Figure 1). After TBV adjustment, differences were similar at term-equivalent, but reductions were limited to temporal regions at 7 and 13 (not shown).The VP group exhibited significantly lower cortical thickness in temporal regions at all timepoints. The VP group displayed significantly higher cortical thickness across frontal, parietal and occipital regions at term-equivalent, but only in some frontal regions later in childhood (Figure 1). Differences were similar after TBV adjustment (not shown).
Longitudinal: Longitudinal trajectories differed significantly between groups in several frontal, parietal, temporal and cingulate regions for volume, and a small number of frontal, occipital and temporal regions for area (Figure 2). Generally, the VP group exhibited lower volume or area at term-equivalent age and less increases in volume or area over early childhood years, such that volume or area reductions in the VP group appeared greater in magnitude by age 7. Over subsequent middle-later childhood years, volume and area changes were similar between groups, with volume or area reductions in the VP group persisting until age 13 (Figures 3 and 4).
For thickness, longitudinal trajectories differed between groups in frontal, parietal, temporal and occipital regions (Figure 2). A common pattern across regions was that the VP group exhibited higher thickness at term-equivalent age and less increases in cortical thickness in early years, such that the groups did not differ in thickness by age 7 and 13 (Figure 5, top). In temporal regions specifically, the VP group exhibited lower thickness at term-equivalent age and less increases in thickness in early years, with the thickness reduction appearing greater in magnitude by age 7 and 13 (Figure 5, bottom).
Discussion
Those born VP exhibit alterations to cortical structure in the neonatal period, including widespread reduced volume and area, some regional thickness reductions, and other regional thickness increases, similar to recent work[23,24]. Importantly, our longitudinal study reveals altered cortical development beyond infancy and particularly over early years of life in those born VP, leading to some cortical alterations appearing greater in magnitude by 7 and 13 (e.g., volume, area and thickness changes in temporal regions), and other alterations appearing smaller in magnitude by 7 and 13 (e.g., thickness changes in parietal and occipital regions). Cortical alterations persist to age 13, encompassing several regions of reduced volume and area, thickness decreases in temporal regions, and thickness increases in frontal regions[1-3,7]. Alterations may underlie adverse neurodevelopmental outcomes in VP children[25].Conclusion
VP birth is associated with cortical alterations in the neonatal period, altered cortical development predominantly over early years of life, and persisting cortical alterations up to age 13 years.Acknowledgements
We would like to thank members of the Victorian Infant Brain Studies (VIBeS) and Developmental Imaging groups at the Murdoch Children’s Research Institute for ideas and support, Michael Kean and Radiographers at the Royal Children’s Hospital for the magnetic resonance images, and the families and children who participated in this study. This study was supported by the Australian National Health and Medical Research Council (NHMRC; Centre for Clinical Research Excellence 546519; Centre of Research Excellence 1060733; Centre of Research Excellence 1153176; Project Grants 237117, 491209 & 1066555; Senior Research Fellowships 628371 & 1081288 to PJA; Career Development Fellowship 1085754 to DKT and 1141354 to JLYC; Early Career Fellowship 1012236 to DKT), an Australian Government Research Training Program (RTP) Scholarship and Monash University Graduate Excellence Scholarship (CK), US National Institutes of Health HD058056, United Cerebral Palsy Foundation (USA), Leila Y. Mathers Charitable Foundation (USA), the Brown Foundation (USA), Murdoch Children’s Research Institute, the Royal Children’s Hospital, The Royal Children’s Hospital Foundation, Department of Paediatrics, The University of Melbourne and the Victorian Government’s Operational Infrastructure Support Program.References
[1] de Kieviet JF, Zoetebier L, van Elburg RM, et al. Brain development of very preterm and very low-birthweight children in childhood and adolescence: a meta-analysis. Developmental Medicine & Child Neurology. 2012;54(4):313-323.[2] Schmitz-Koep B, Haller B, Coupé P, et al. Grey and white matter volume changes after preterm birth: A meta-analytic approach. medRxiv. 2021;https://doi.org/10.1101/2021.06.15.21258937
[3] Zhou L, Zhao Y, Liu X, et al. Brain gray and white matter abnormalities in preterm-born adolescents: A meta-analysis of voxel-based morphometry studies. PLoS One. 2018;13(10):e0203498.
[4] Loh WY, Anderson PJ, Cheong JLY, et al. Longitudinal growth of the basal ganglia and thalamus in very preterm children. Brain Imaging Behav. 2020;14(4):998-1011.
[5] Matthews LG, Inder TE, Pascoe L, et al. Longitudinal Preterm Cerebellar Volume: Perinatal and Neurodevelopmental Outcome Associations. Cerebellum. 2018;17(5):610-627.
[6] Monson BB, Anderson PJ, Matthews LG, et al. Examination of the Pattern of Growth of Cerebral Tissue Volumes From Hospital Discharge to Early Childhood in Very Preterm Infants. JAMA Pediatr. 2016;170(8):772-779.
[7] Thompson DK, Matthews LG, Alexander B, et al. Tracking regional brain growth up to age 13 in children born term and very preterm. Nat Commun. 2020;11(1):696.
[8] Bjuland KJ, Rimol LM, Lohaugen GC, et al. Brain volumes and cognitive function in very-low-birth-weight (VLBW) young adults. Eur J Paediatr Neurol. 2014;18(5):578-590.
[9] Allin M, Nosarti C, Narberhaus A, et al. Growth of the corpus callosum in adolescents born preterm. Arch Pediatr Adolesc Med. 2007;161(12):1183-1189.
[10] Vandewouw MM, Young JM, Mossad SI, et al. Mapping the neuroanatomical impact of very preterm birth across childhood. Hum Brain Mapp. 2020;41(4):892-905.
[11] Winkler AM, Kochunov P, Blangero J, et al. Cortical thickness or grey matter volume? The importance of selecting the phenotype for imaging genetics studies. NeuroImage. 2010;53(3):1135-1146.
[12] Wang L, Li G, Shi F, et al. Volume-Based Analysis of 6-Month-Old Infant Brain MRI for Autism Biomarker Identification and Early Diagnosis. Medical Image Computing and Computer Assisted Intervention – MICCAI 2018; 2018: Springer International Publishing, Cham.
[13] Li G, Nie J, Wang L, et al. Measuring the dynamic longitudinal cortex development in infants by reconstruction of temporally consistent cortical surfaces. NeuroImage. 2014;90:266-279.
[14] Li G, Wang L, Shi F, et al. Construction of 4D high-definition cortical surface atlases of infants: Methods and applications. Medical Image Analysis. 2015;25(1):22-36.
[15] Li G, Wang L, Yap P-T, et al. Computational neuroanatomy of baby brains: A review. NeuroImage. 2019;185:906-925.
[16] Adamson CL, Alexander B, Ball G, et al. Parcellation of the neonatal cortex using Surface-based Melbourne Children's Regional Infant Brain atlases (M-CRIB-S). Sci Rep. 2020;10(1):4359.
[17] Wang H, Suh JW, Das SR, et al. Multi-Atlas Segmentation with Joint Label Fusion. IEEE Transactions on Pattern Analysis and Machine Intelligence. 2013;35(3):611-623.
[18] Wang H, Yushkevich P. Multi-atlas segmentation with joint label fusion and corrective learning—an open source implementation. Frontiers in Neuroinformatics. 2013;7:27.
[19] Klein A, Tourville J. 101 labeled brain images and a consistent human cortical labeling protocol. Front Neurosci. 2012;6:171.
[20] Fischl B. FreeSurfer. Neuroimage. 2012;62(2):774-781.
[21] Wood SN. Fast stable restricted maximum likelihood and marginal likelihood estimation of semiparametric generalized linear models. Journal of the Royal Statistical Society: Series B (Statistical Methodology). 2011;73(1):3-36.
[22] Ball G, Seal ML. Individual variation in longitudinal postnatal development of the primate brain. Brain Struct Funct. 2019;224(3):1185-1201.
[23] Dimitrova R, Pietsch M, Ciarrusta J, et al. Preterm birth alters the development of cortical microstructure and morphology at term-equivalent age. NeuroImage. 2021;243:118488.
[24] Ball G, Seidlitz J, O'Muircheartaigh J, et al. Cortical morphology at birth reflects spatiotemporal patterns of gene expression in the fetal human brain. PLoS Biol. 2020;18(11):e3000976.
[25] Saigal S, Doyle LW. An overview of mortality and sequelae of preterm birth from infancy to adulthood. The Lancet. 2008;371(9608):261-269.
Figures
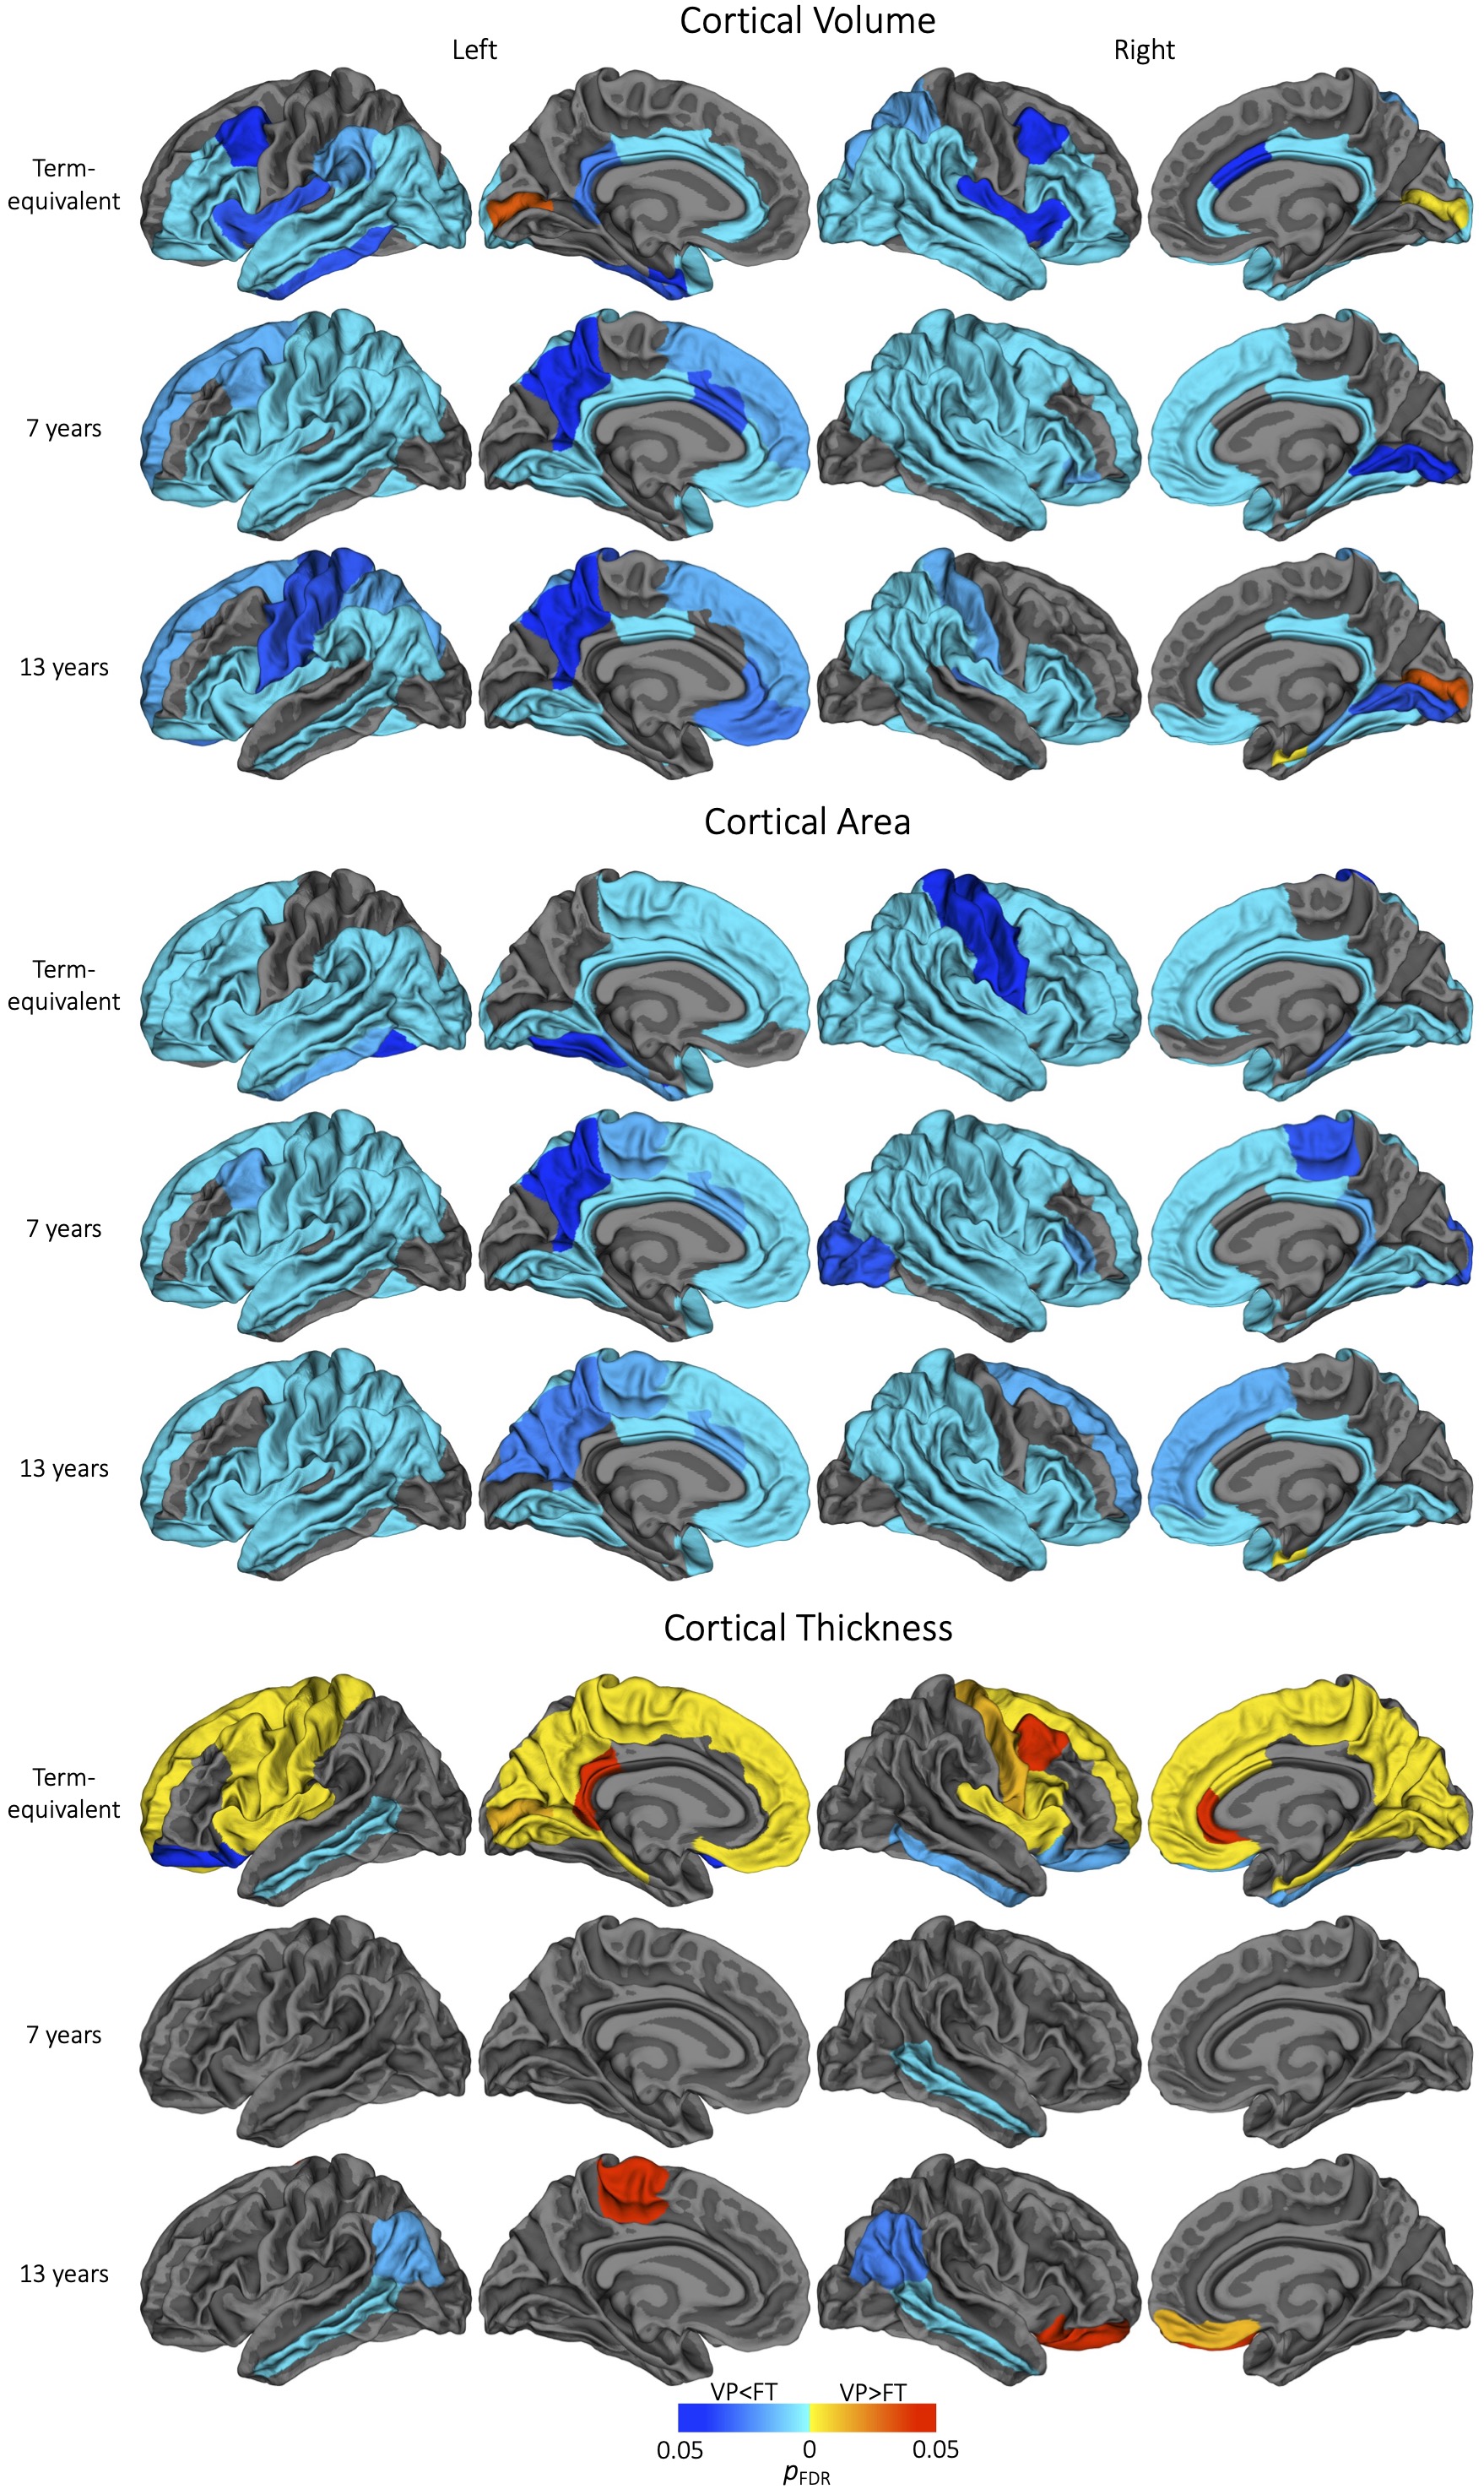
Figure 1. Regional cortical volume, area or thickness differences between very preterm (VP) and full-term (FT) control groups at cross-sectional timepoints. Widespread volume and area reductions are shown here (remaining present at term-equivalent, but limited to temporal and cingulate regions at 7 and 13 years, after adjusting for total brain volume- not shown). Some cortical thickness increases and decreases are shown here (remaining unchanged by adjusting for total brain volume- not shown).
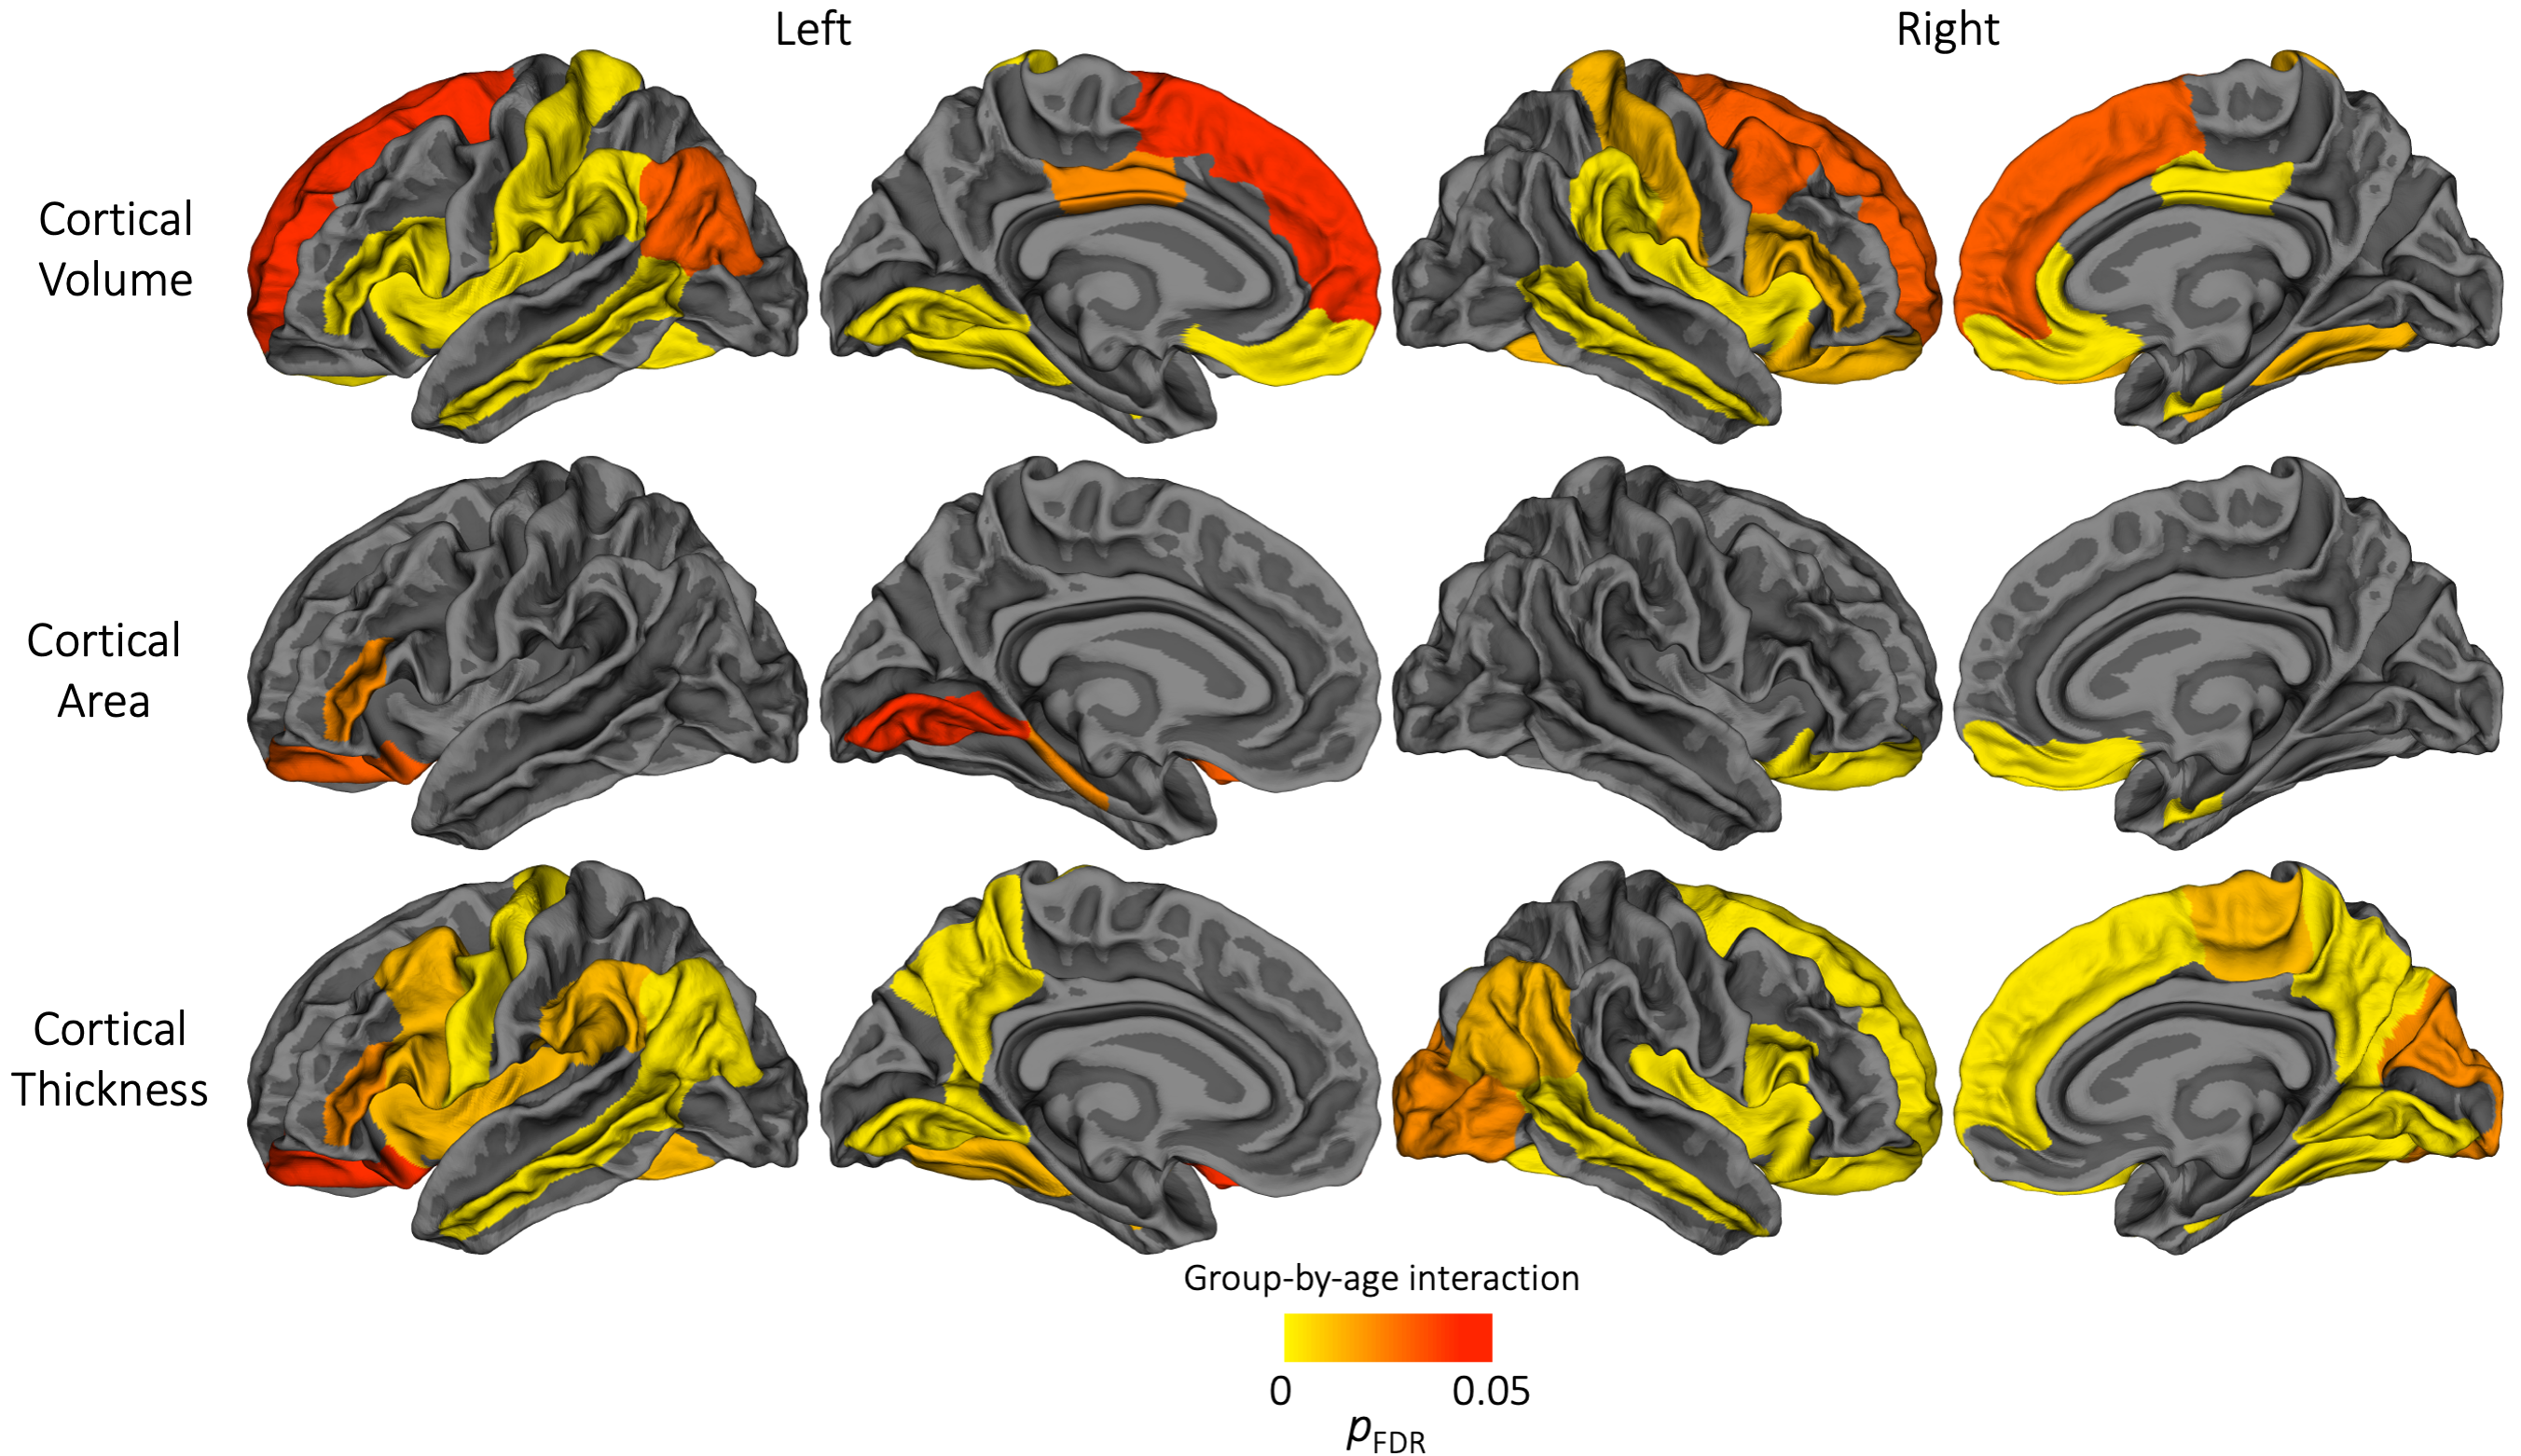
Figure 2. Cortical regions which exhibited a significant group-by-age interaction, suggesting the longitudinal change in cortical volume, area or thickness differed significantly between the very preterm group and full-term control group. For interpretation of these significant group-by-age interactions, the plots in Figures 3-5 can be referred to.
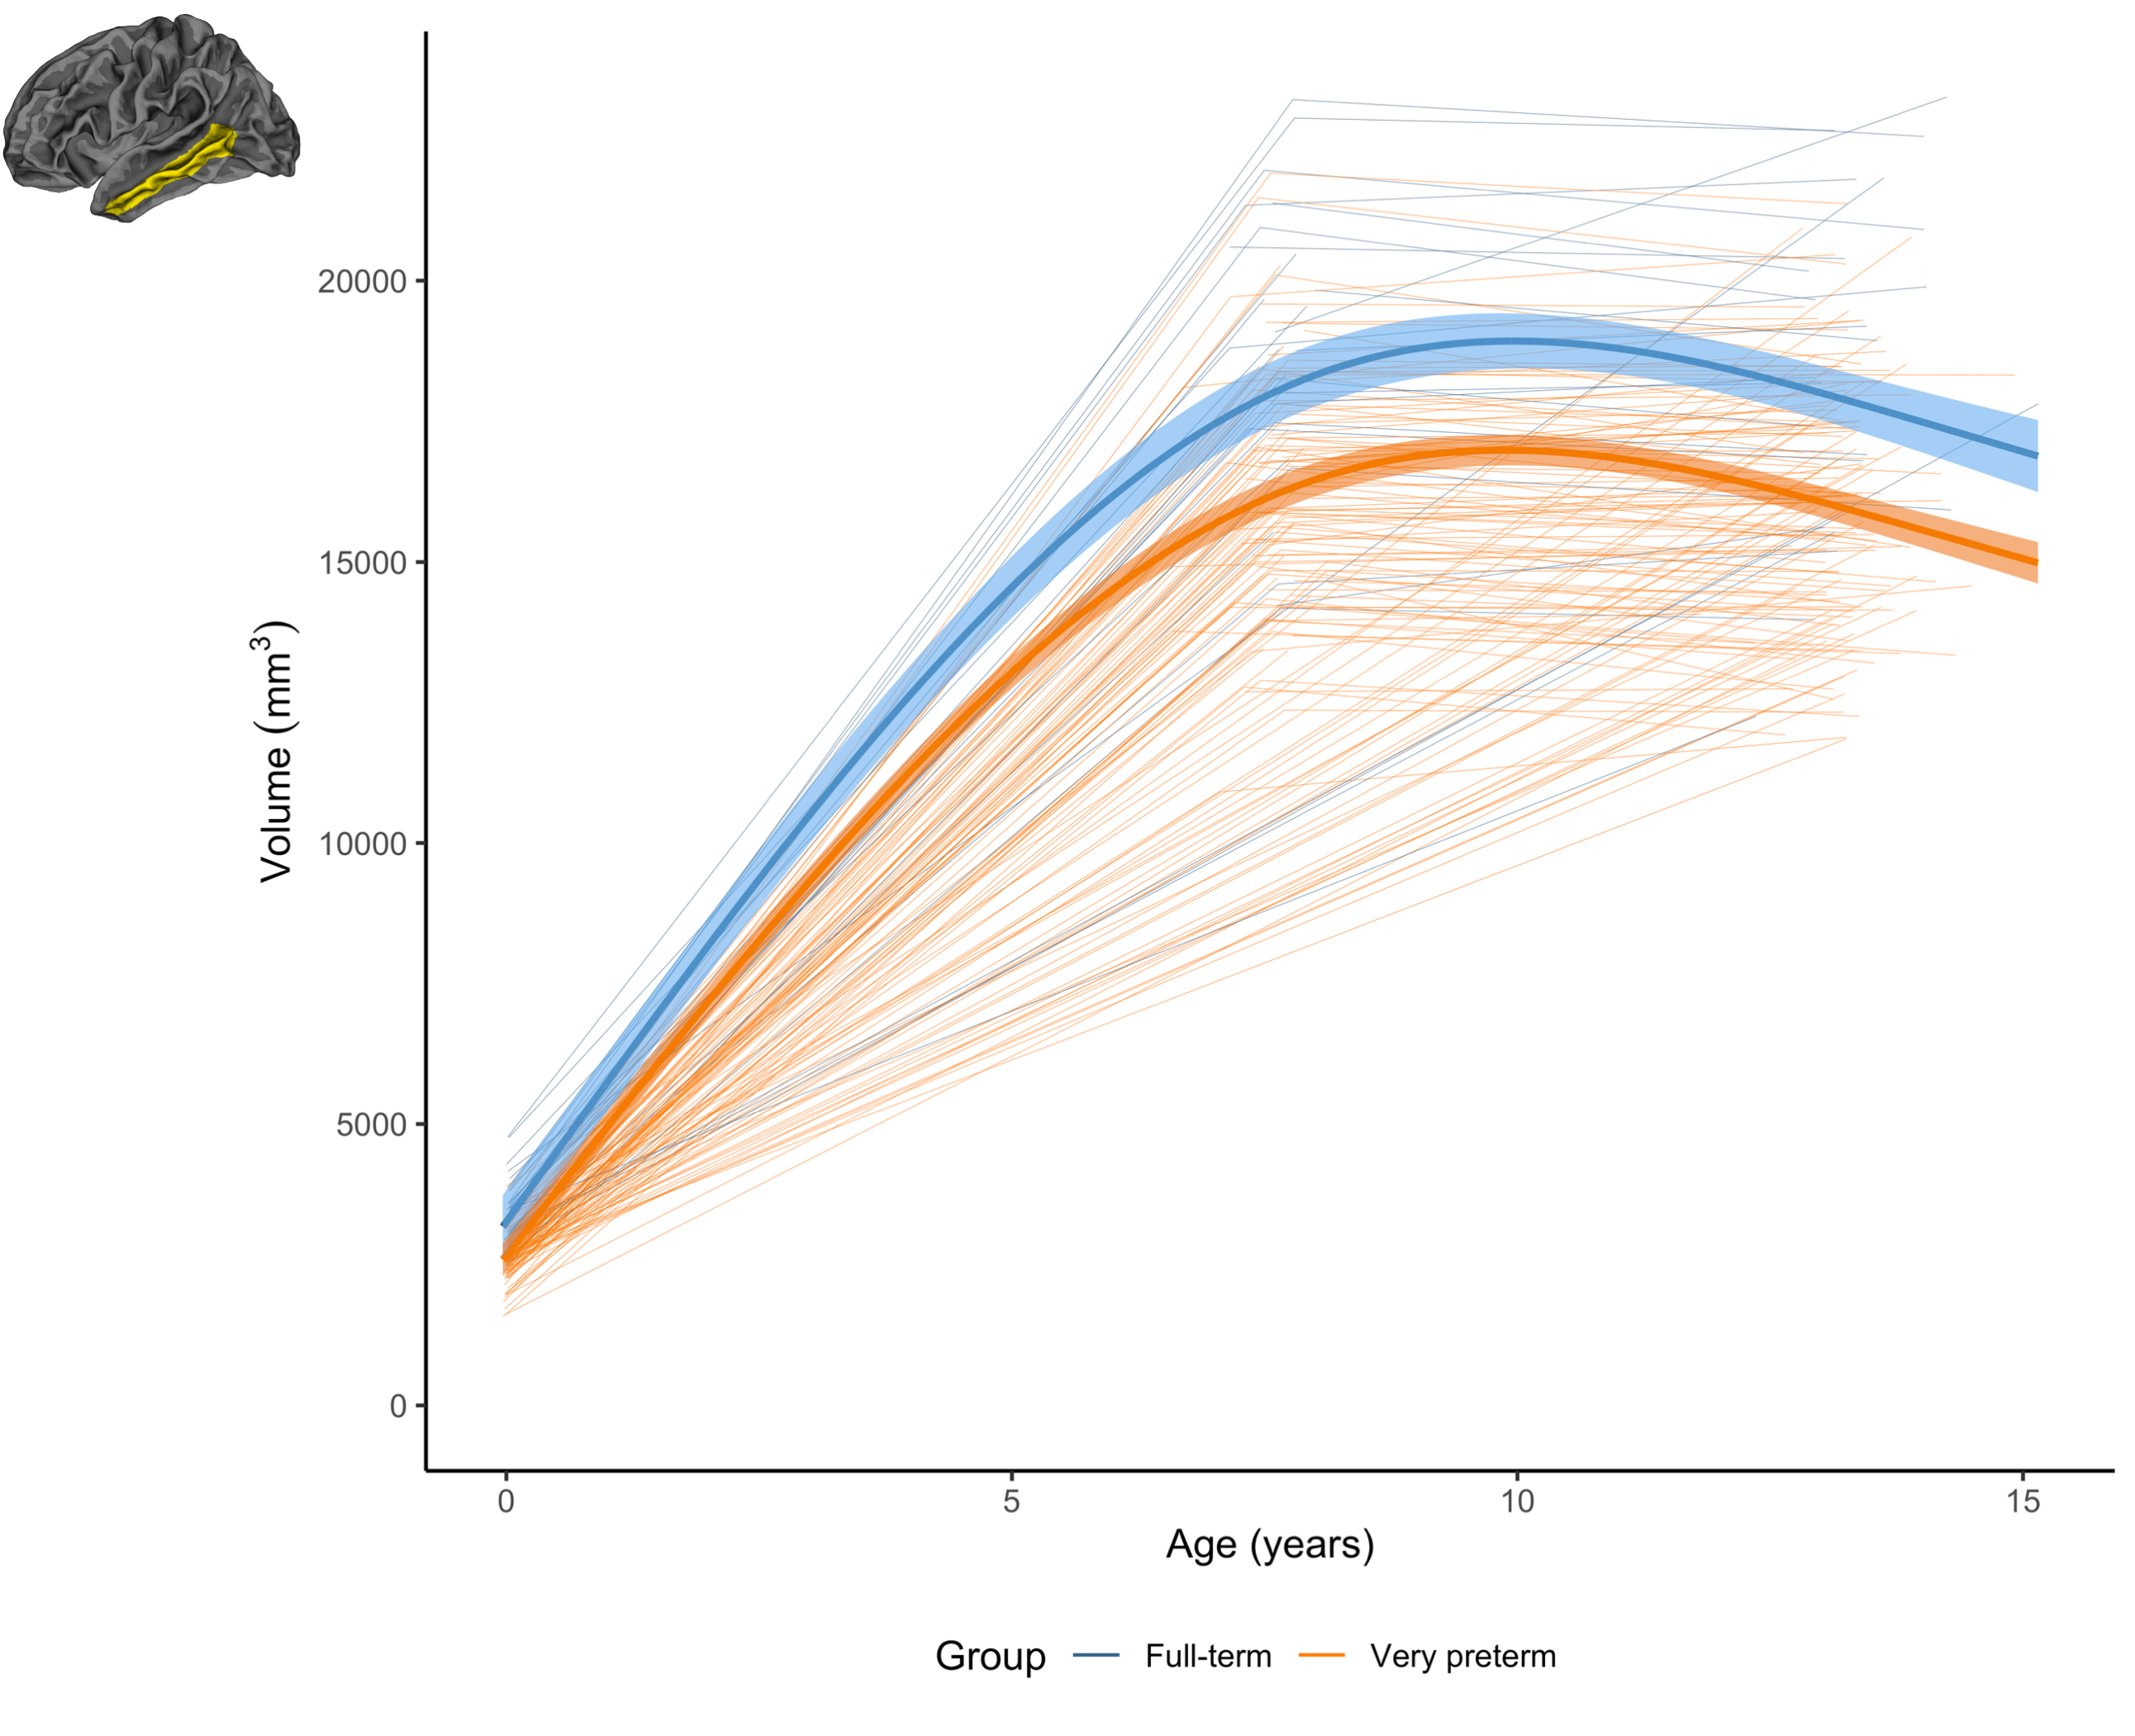
Figure 3. The longitudinal change in the volume of an example region (left middle temporal) for the very preterm group (orange) and full-term control group (blue). This demonstrates a common pattern across regions, whereby the very preterm group exhibited lower volume at term-equivalent and less increase in volume over the early years, such that the volumetric reduction appeared greater in magnitude by age 7 years, and persisted at a similar magnitude at age 13 years.
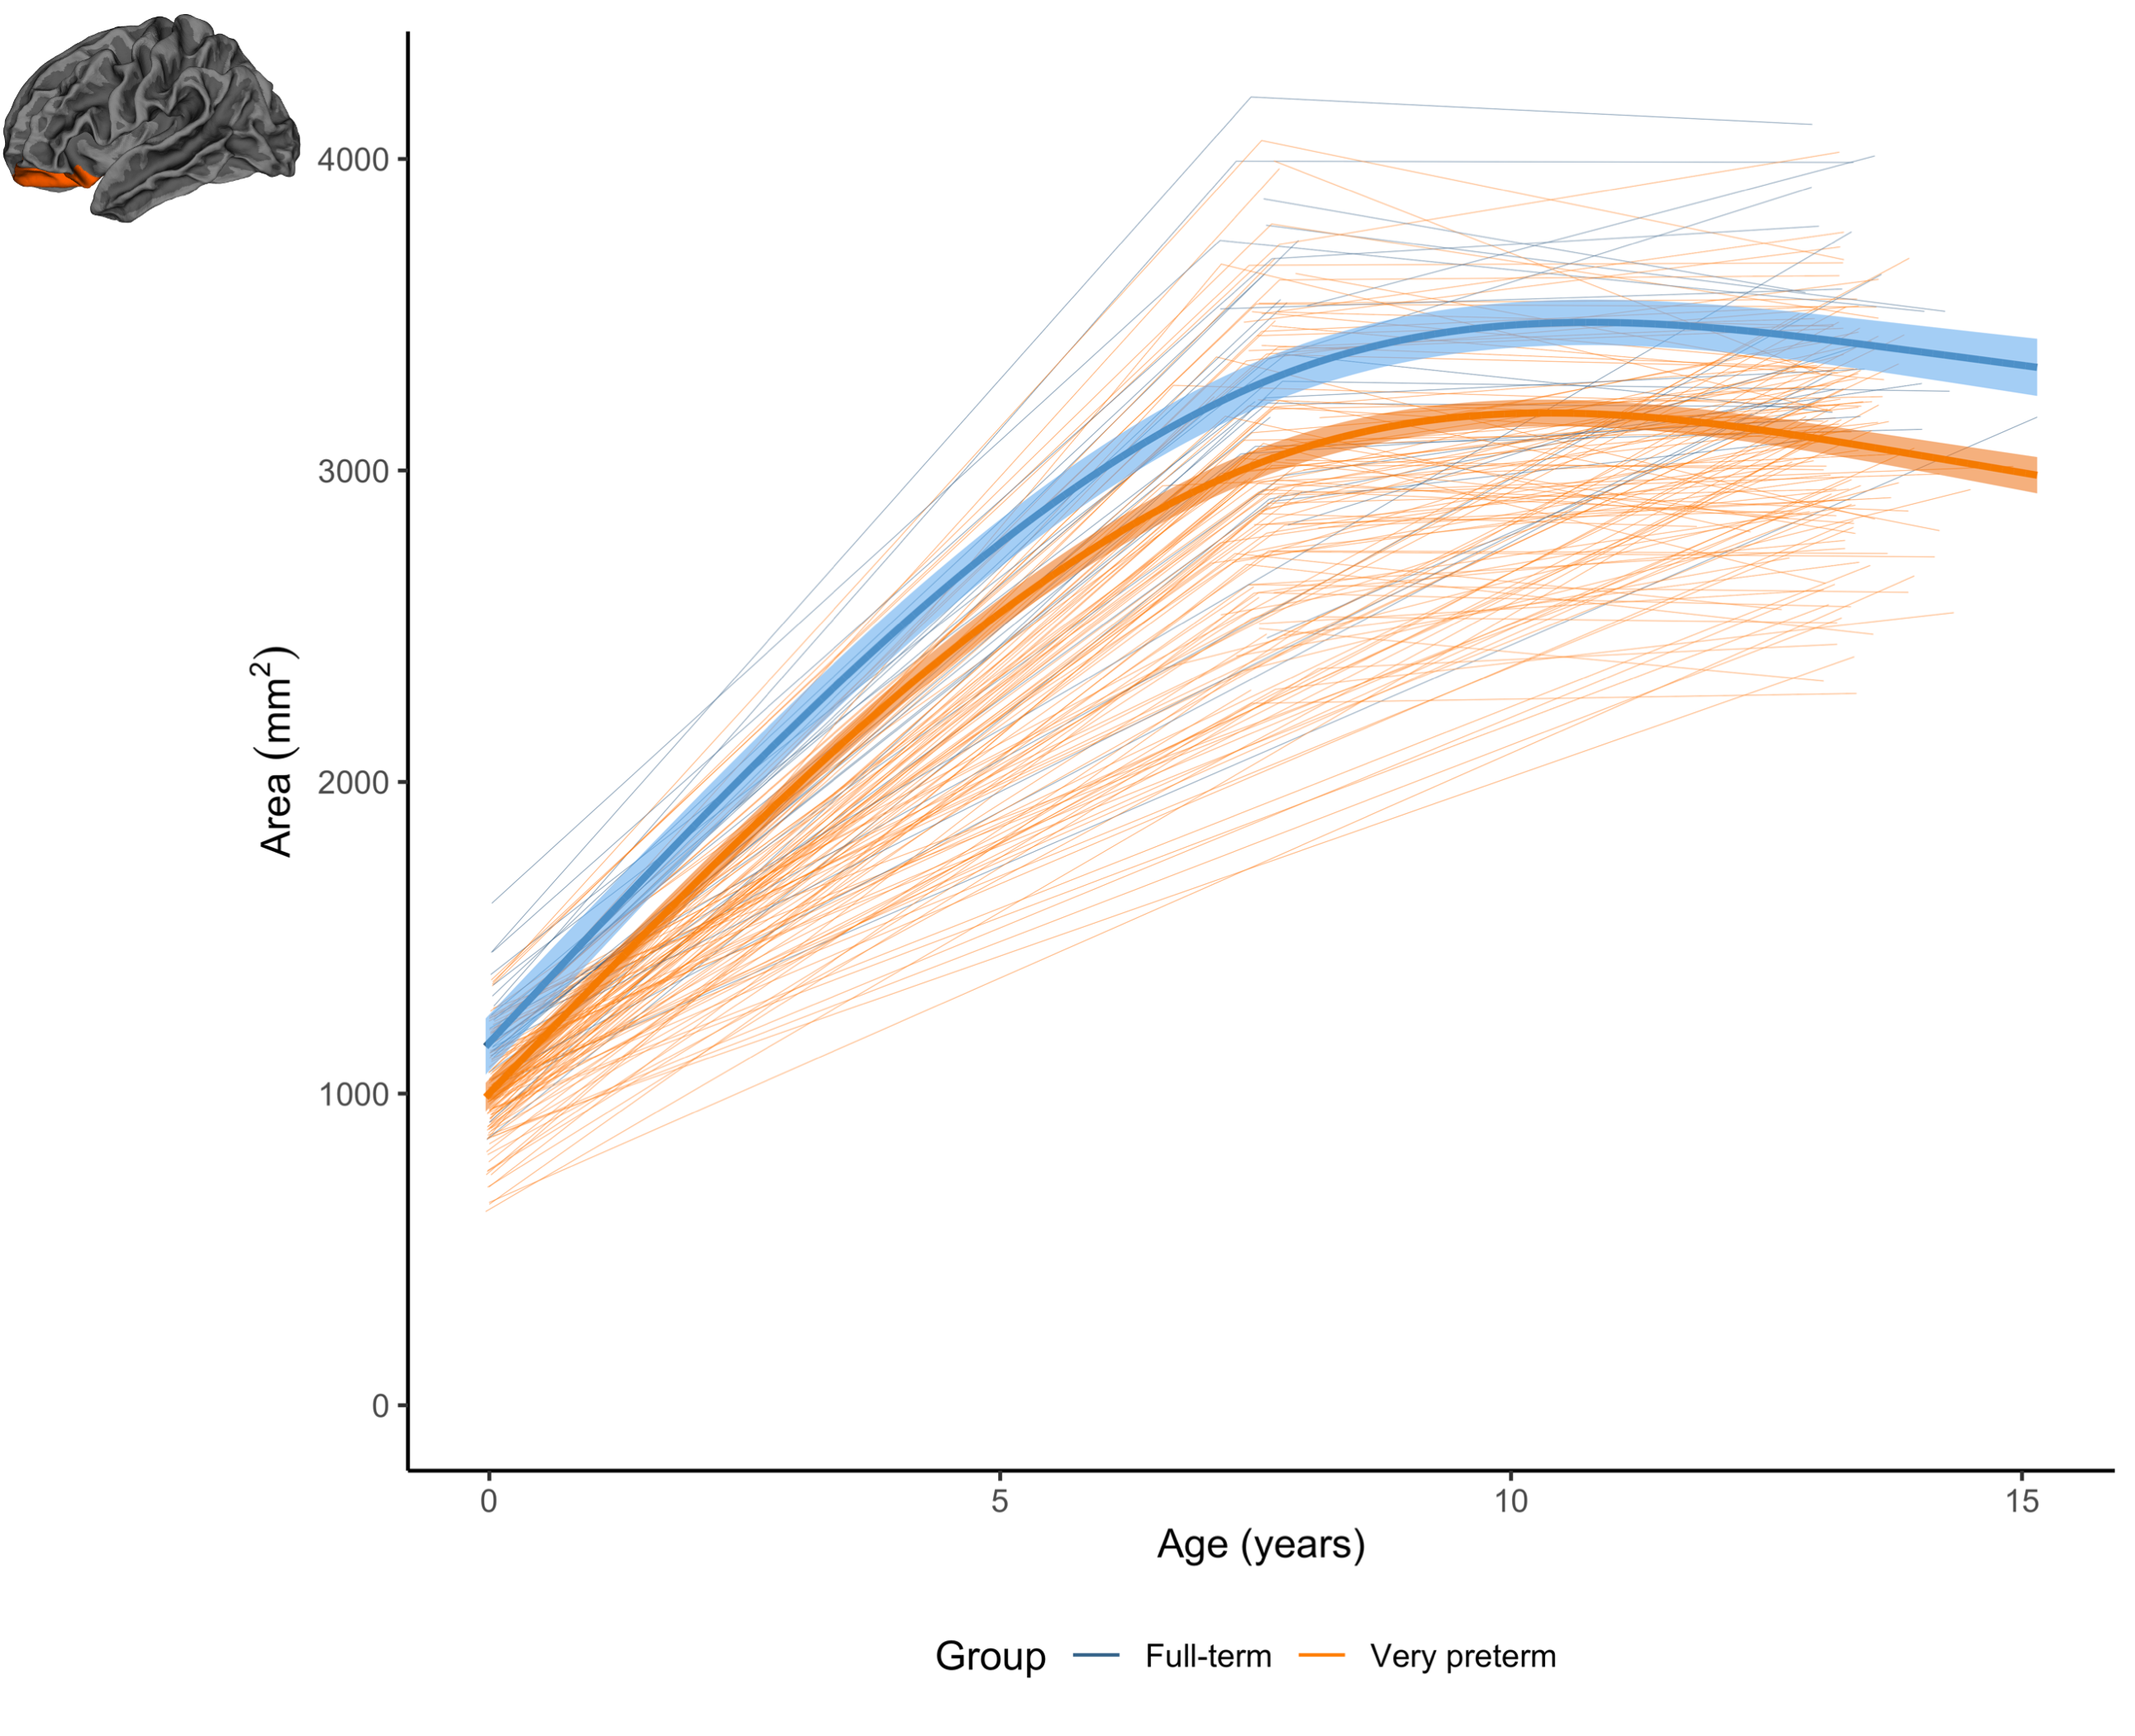
Figure 4. The longitudinal change in the area of an example region (left lateral orbitofrontal) for the very preterm group (orange) and full-term control group (blue). In this region and a small number of other regions, the very preterm group exhibited lower area at term-equivalent and less increase in area over the early years, such that the area reduction appeared slightly greater in magnitude by age 7 years, and persisted at a similar magnitude at age 13 years.
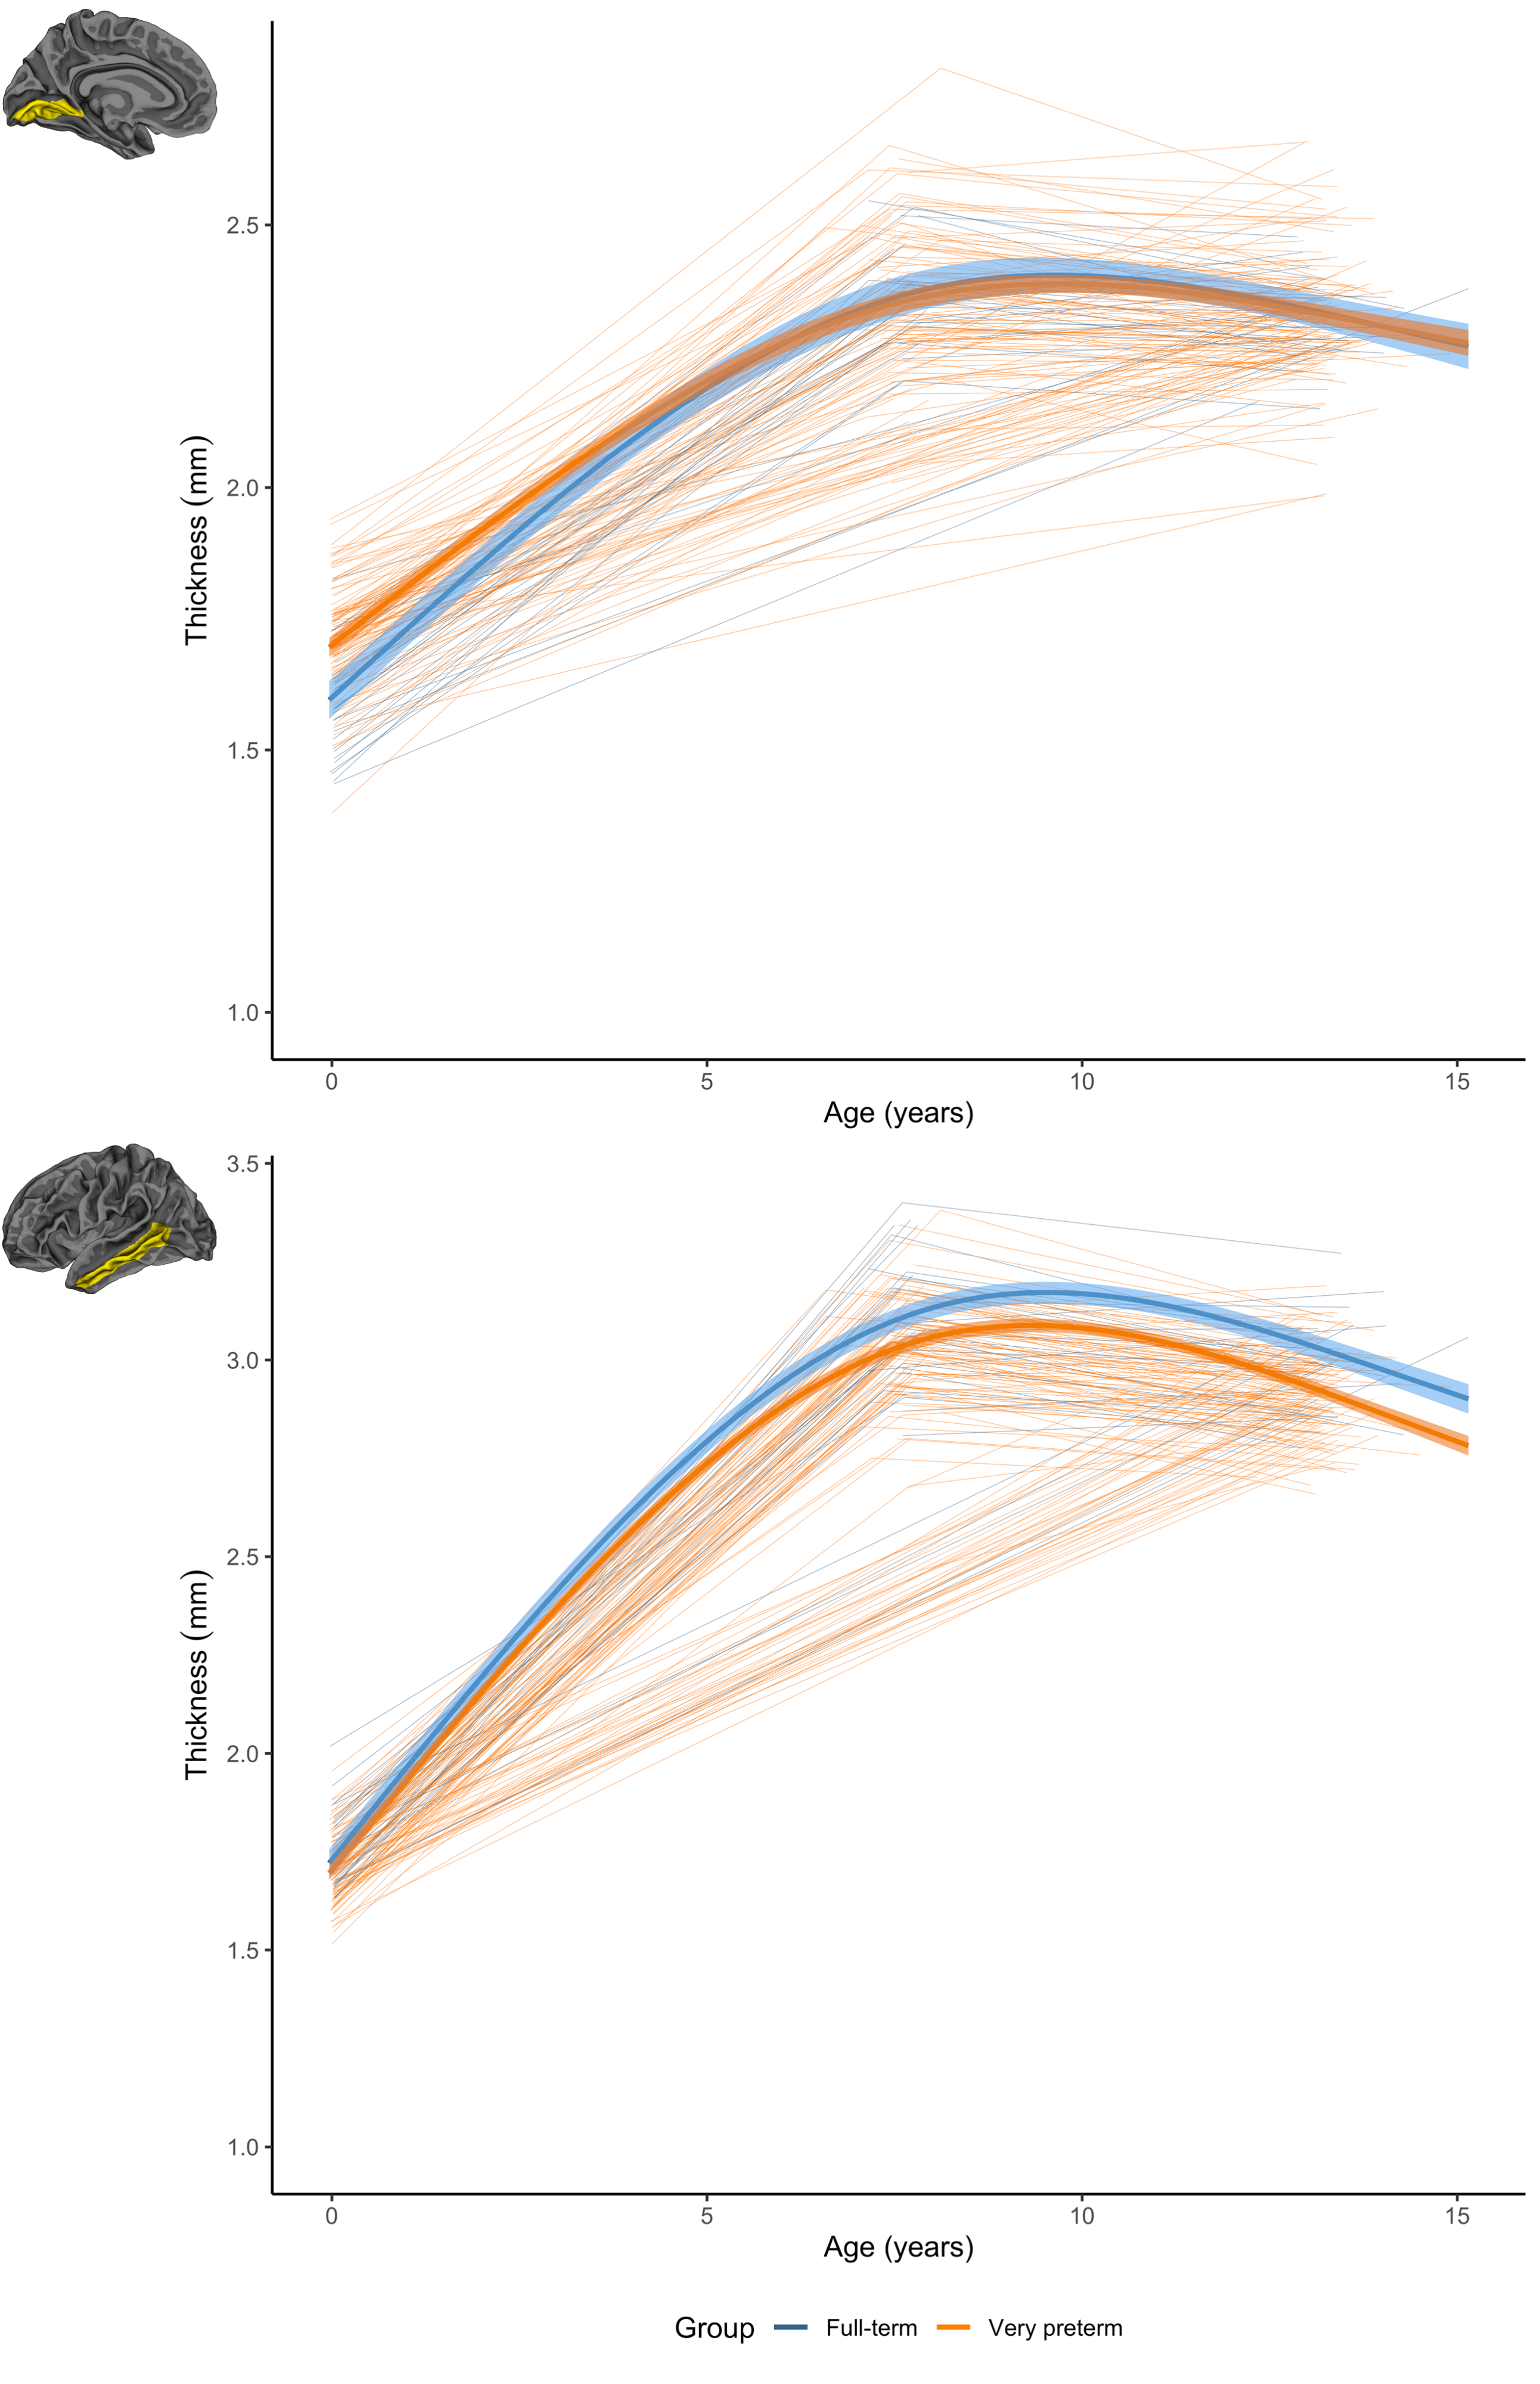
Figure 5. Longitudinal cortical thickness changes for the very preterm (orange) and full-term control group (blue). Top: in the lingual region, the very preterm group exhibited higher thickness at term-equivalent but less increases in early years, such that the groups did not differ by age 7 and 13. Bottom: in the middle temporal region, the very preterm group exhibited lower thickness at term-equivalent and less increases in early years, with a greater magnitude reduction by age 7 and 13.
DOI: https://doi.org/10.58530/2022/3720