3716
Radiomic Analysis of APT MRI for Preoperative Risk Stratification of Pediatric Neuroblastoma1Key Laboratory for Biomedical Engineering of Ministry of Education, Department of Biomedical Engineering, College of Biomedical Engineering & Instrument Science, Zhejiang University, Hangzhou, China, 2Department of Radiology, Children’s Hospital, Zhejiang University School of Medicine, Hangzhou, China, 3Philips Healthcare, Shanghai, China
Synopsis
Neuroblastoma (NB) is most often diagnosed in young children, and high-risk NB indicates a poor prognosis and requires aggressive treatment. Here, we assessed the utility of radiomics for amide proton transfer (APT) imaging in the preoperative classification of high-risk and low-risk abdominal NBs. Thirty-three pediatric patients underwent APT scans, with 16 confirmed high-risk NBs and 17 confirmed low-risk NBs. Radiomic models were constructed from four APT-related metric maps using 7 classifiers, with their prediction performances evaluated by associated AUCs. The optimal model achieved an AUC of 0.86, demonstrating the potential of APT MRI-based radiomics for risk stratification of NB.
INTRODUCTION
Neuroblastoma (NB) is one of the most common and deadly solid tumors in children, which derives from tissues of the sympathetic nervous system and usually arises in the abdomen1. Risk stratification is critical in guiding the therapeutic strategy, as the patients with high-risk NB require substantially higher treatment intensity. Amide proton transfer (APT) imaging is a novel molecular MR technique that can detect the amide protons in mobile proteins and peptides2. Recent studies suggest that the content of amide protons is higher in tumors than in normal tissues3, and APT MRI can facilitate grade prediction of brain tumors4, 5 and other diseases6, 7. Radiomic techniques enable the extraction of high-dimensional quantitative features from medical images, providing more comprehensive and accurate information in clinical diagnosis8. In this work, we aim for preoperative risk stratification of pediatric NB in the abdomen using radiomic analysis of APT images.METHODS
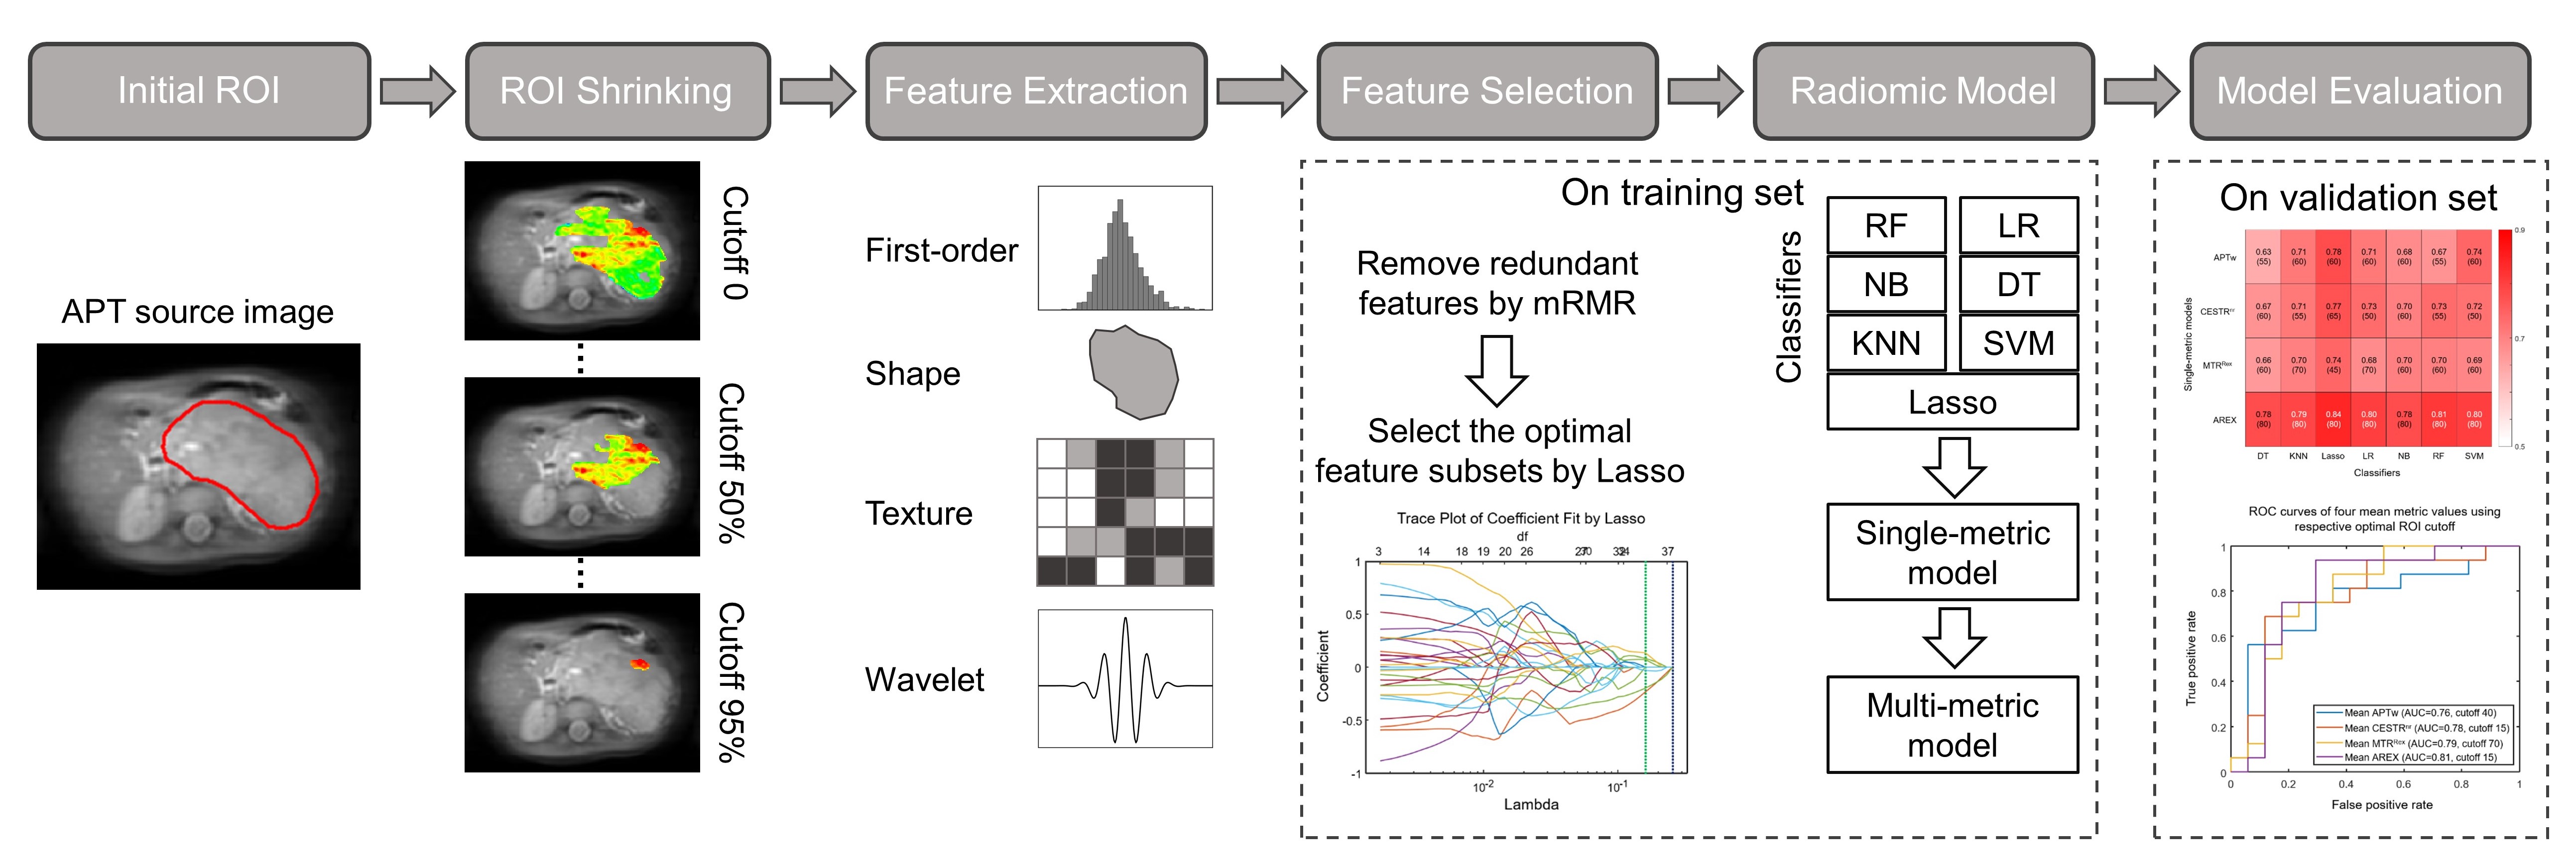
Thirty-three children (21 males and 12 females) with abdominal NB were enrolled in the final analysis, including 17 patients with low-risk NB (mean age, 3.78±2.74 years) and 16 with high-risk NB (mean age, 4.13±3.00 years). There was no age bias between the low-risk and high-risk groups (P=0.731). All patients underwent APT scans preoperatively on a 3T Philips Achieva scanner, using the following parameters: RF saturation power/duration = 2 µT/0.8 sec, TR/TE = 3000/6.7 ms, SENSE factor = 2, slice thickness = 5 mm, FOV = 212×186 mm2, acquisition resolution = 2.2×2.2 mm2, and 63 frequency offsets from -6 to 80 ppm. In addition, a single-slice MIX sequence9 was performed to calculate the relaxation times.Several APT-related metrics (APTw, CESTRnr, MTRRex and AREX)10 were measured after correcting the motion artifacts11 and B0-field inhomogeneity12 of APT images. The initial region of interest (ROI) of each patient, encircling the whole tumor, was selected by a radiologist. Then, an automatic ROI-shrinking algorithm5 was adopted to select the sub-area with signals greater than a histogram cutoff, with 20 sub-ROIs generated within each initial ROI (cutoff ranging from 0 to 95th percentile of the histogram, with a step of 5%). Next, we calculated the mean values of different metrics within sub-ROIs and assessed their performance in predicting the risk group of NBs.
We randomly divided 80% of the data into the training set and 20% into the validation set, and repeated 100 times to avoid bias resulting from the initial data partitioning. For every APT metric, 474 features were obtained from each sub-ROI using Pyradiomics13 and then normalized to 0-1 using the Min-Max method. For feature selection, the minimum redundancy maximum relevance (mRMR) method14 was applied to remove redundant features in the training set. Then, the least absolute shrinkage and selection operator (Lasso) analysis15 was used to select optimal features. Seven classifiers were trained to build radiomic models: decision tree (DT), k-nearest neighbor (KNN), Lasso, logistic regression (LR), naïve bayes (NB), random forest (RF) and support vector machine (SVM), with parameters optimized by 5-fold cross-validation. For each single-metric model, we identified the optimal histogram cutoff for ROI shrinking by maximizing the average areas under the curve (AUC) in risk stratification. Multi-metric models were generated by combining features of different metrics extracted using respective optimal cutoff. The classification performance of the models was evaluated using average AUCs, sensitivities and specificities on the 100 repeated validation sets.
RESULTS
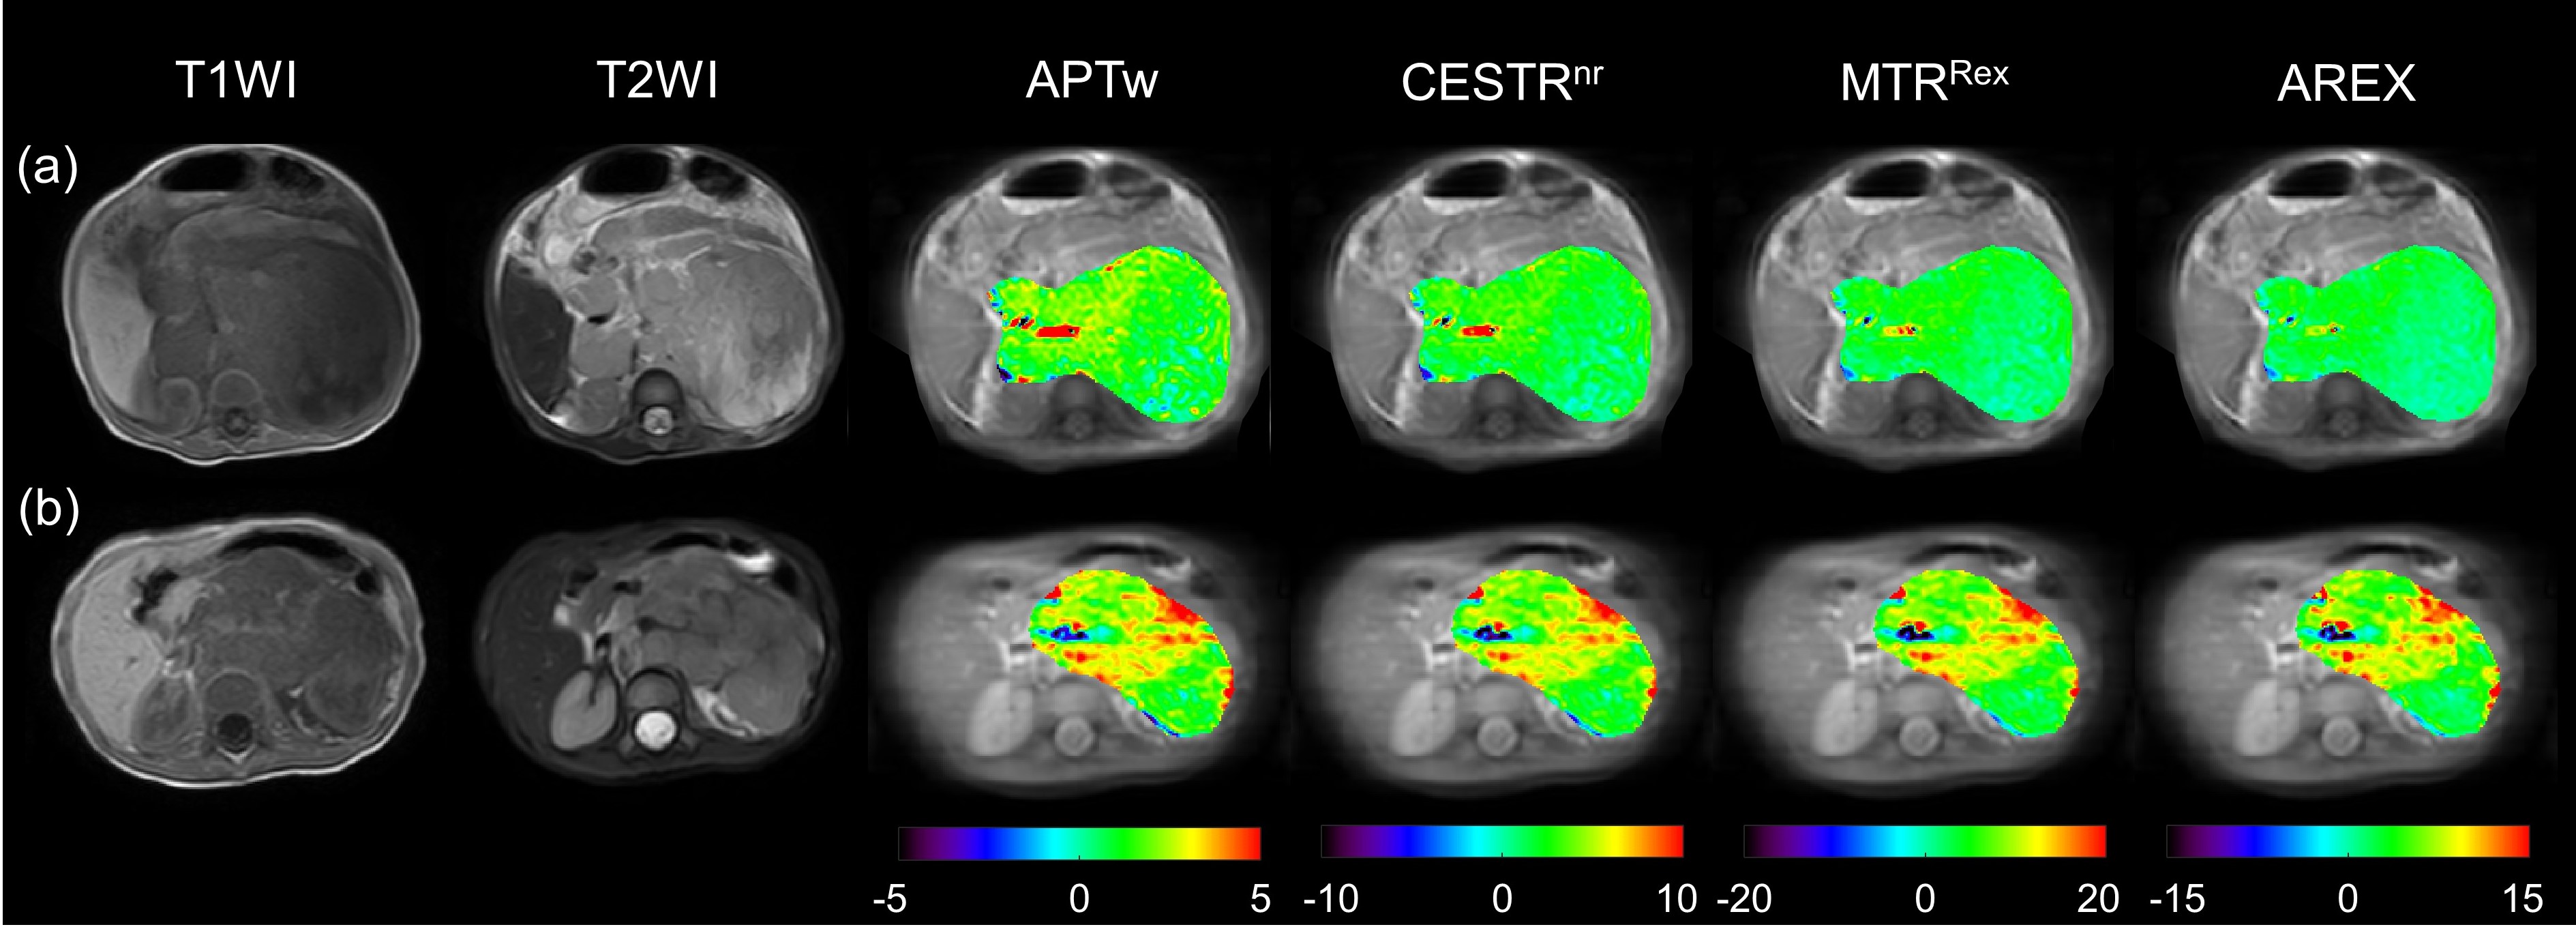
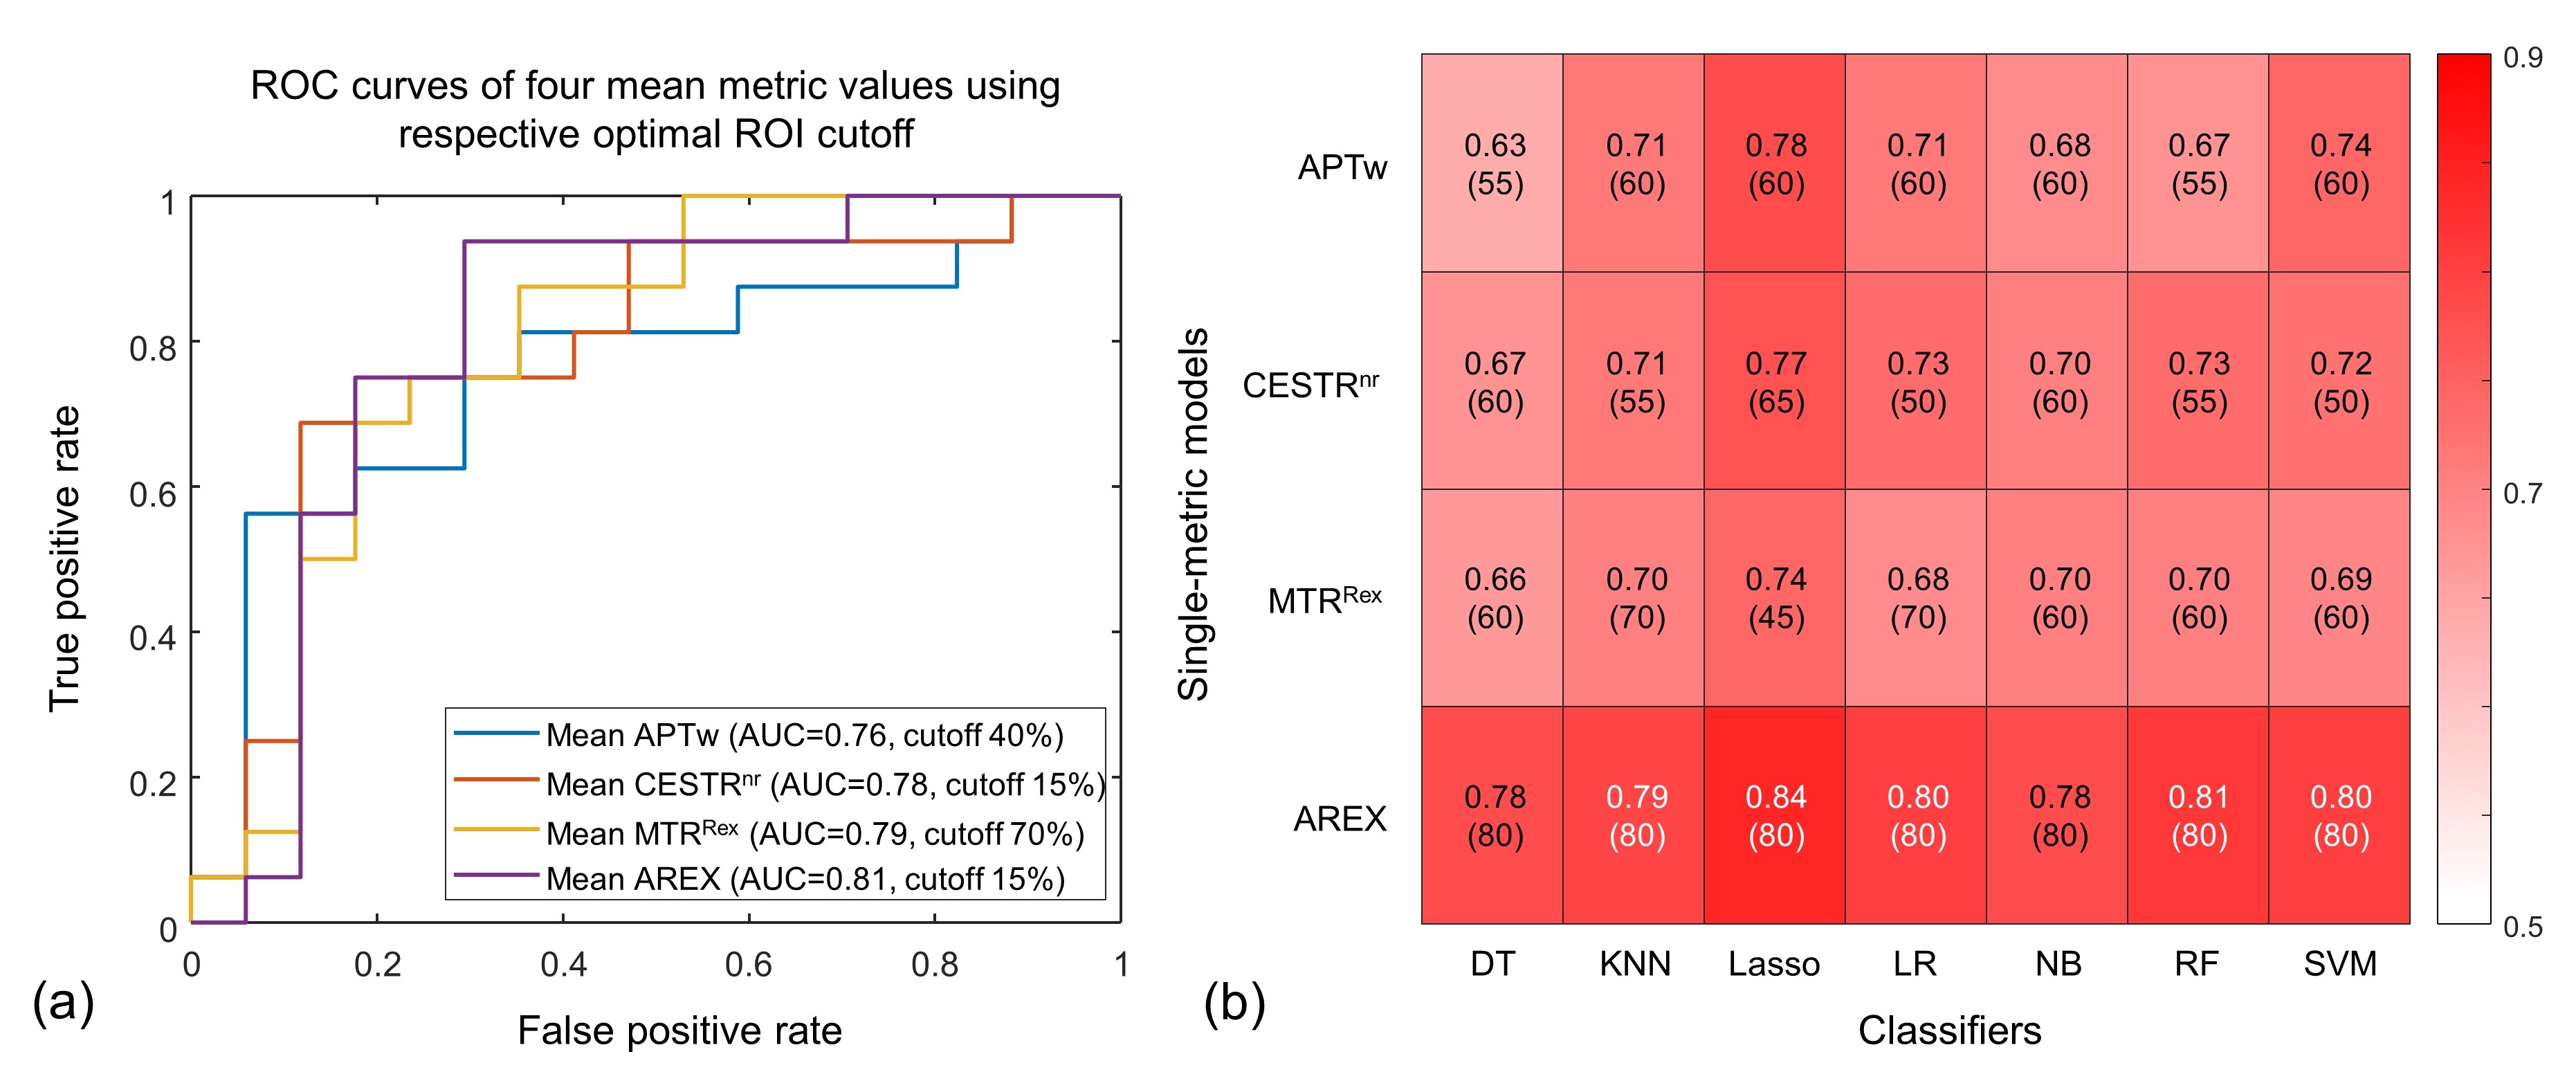
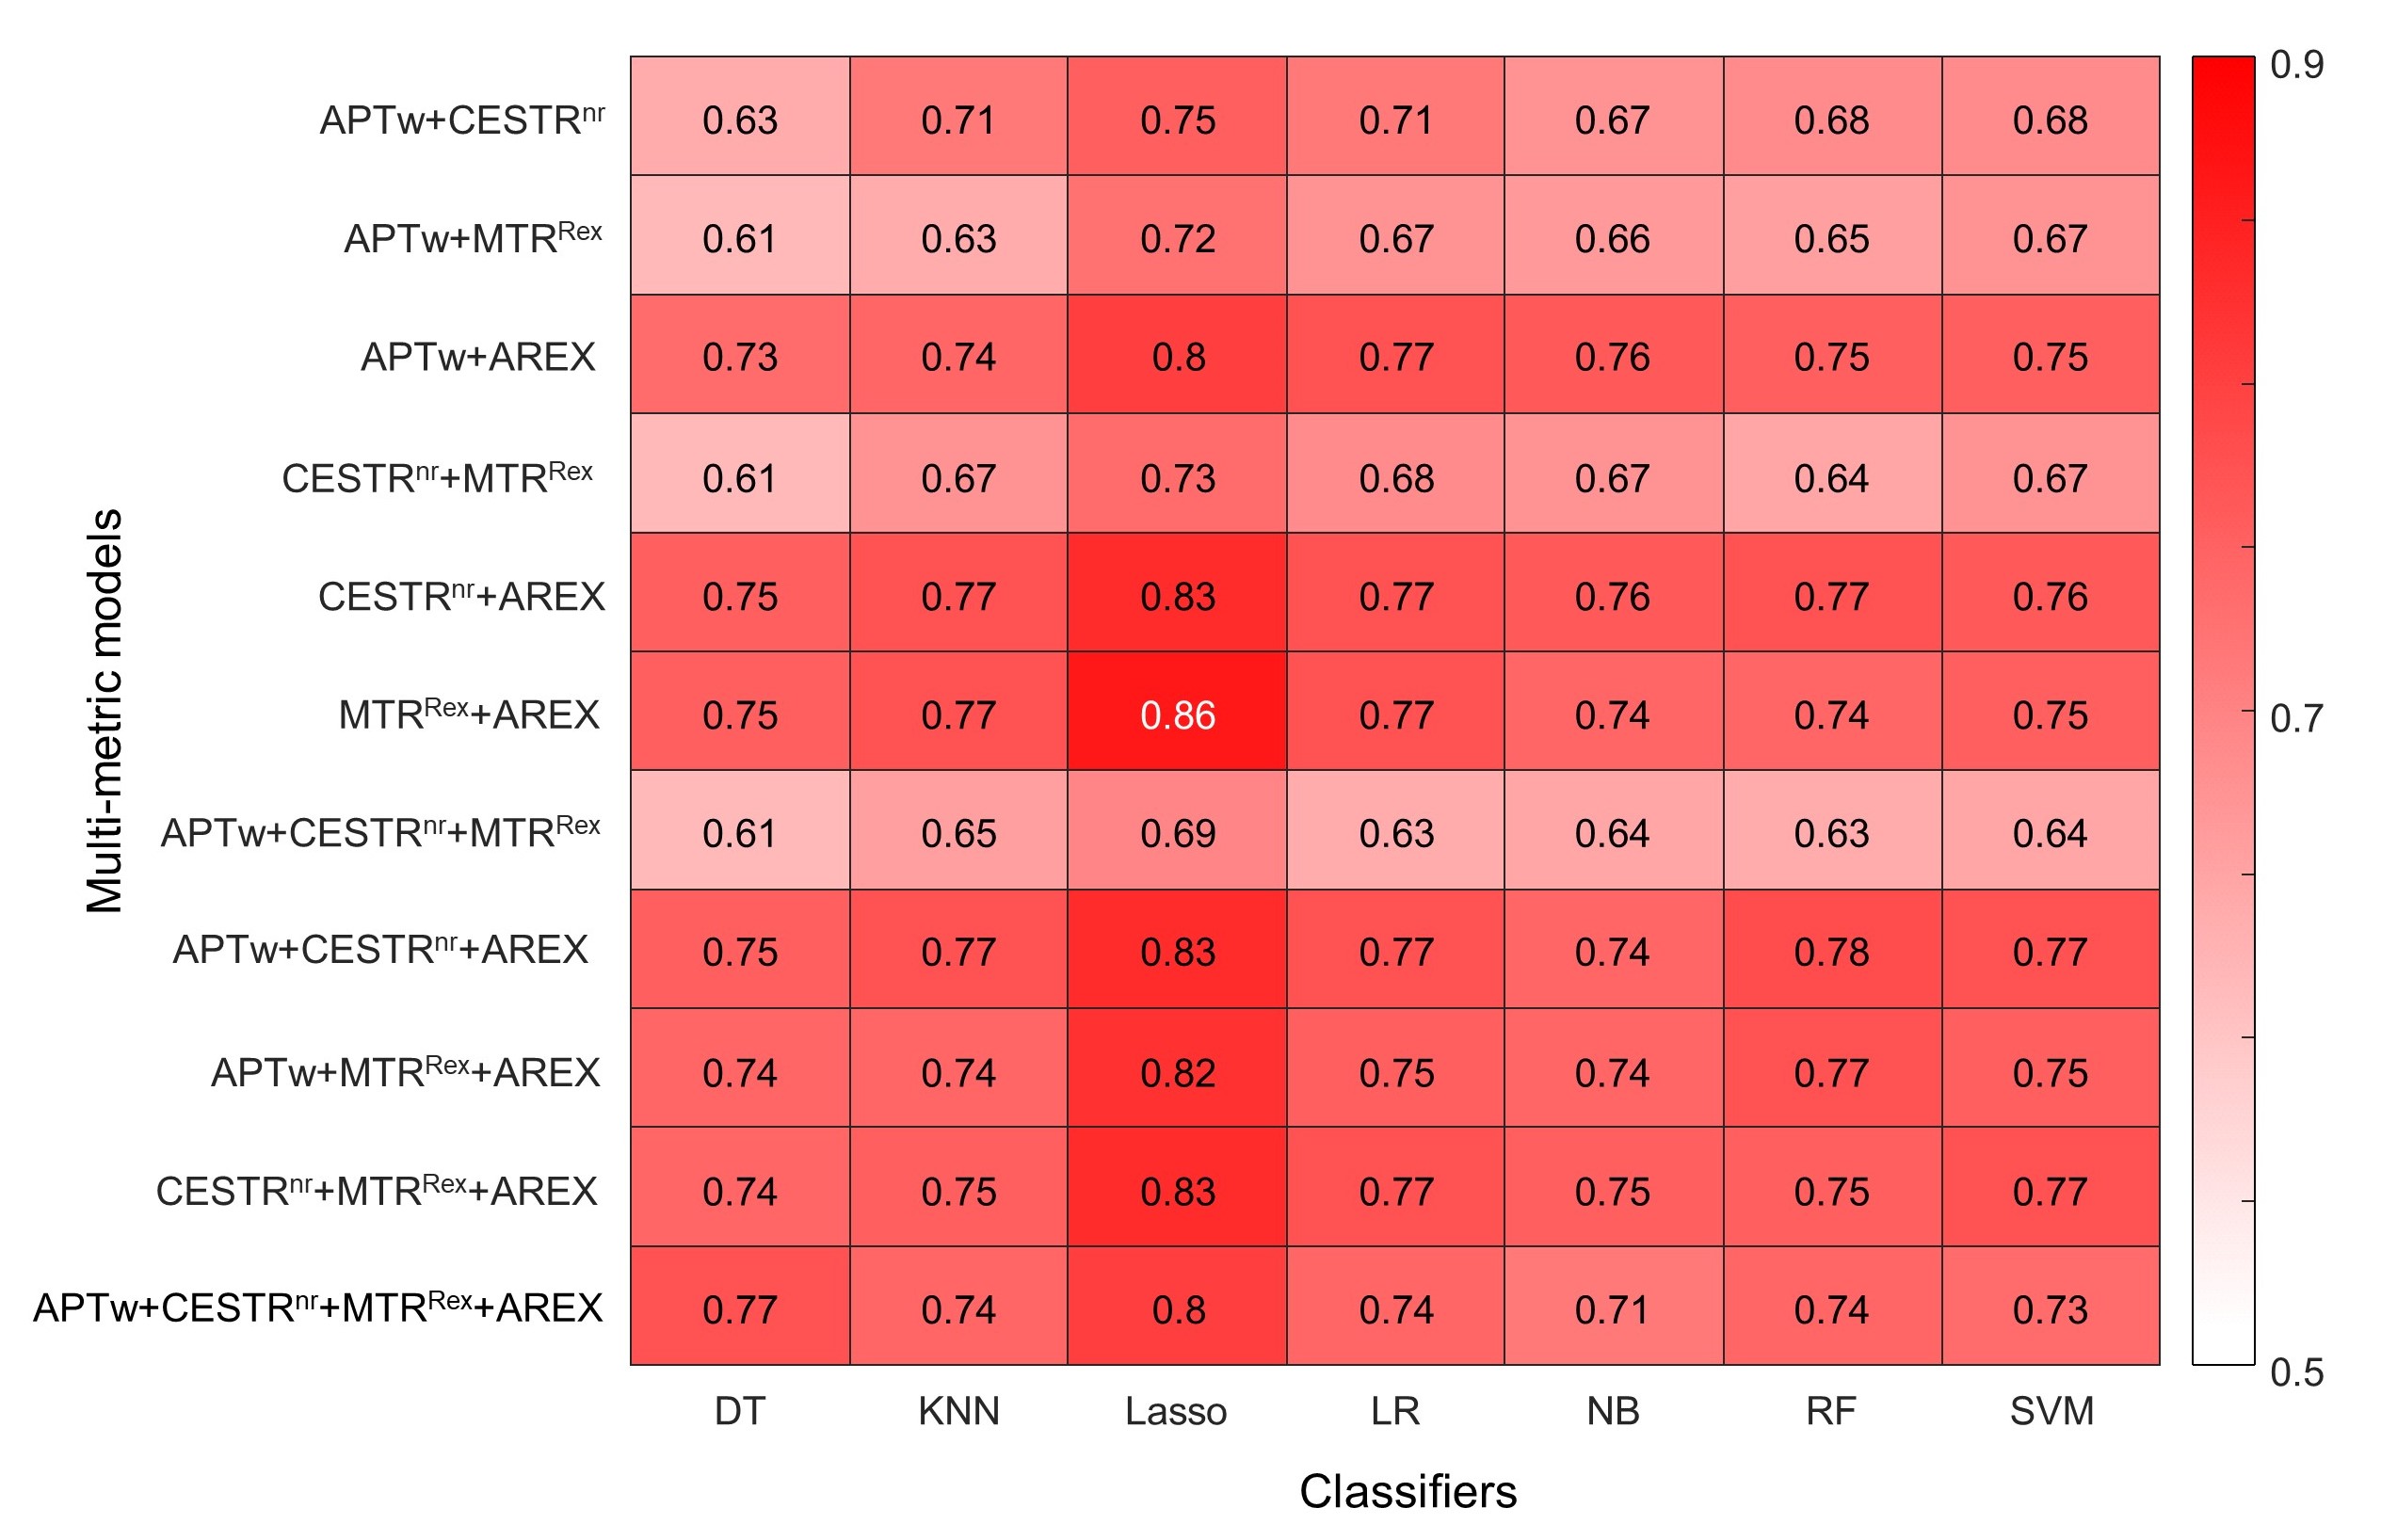
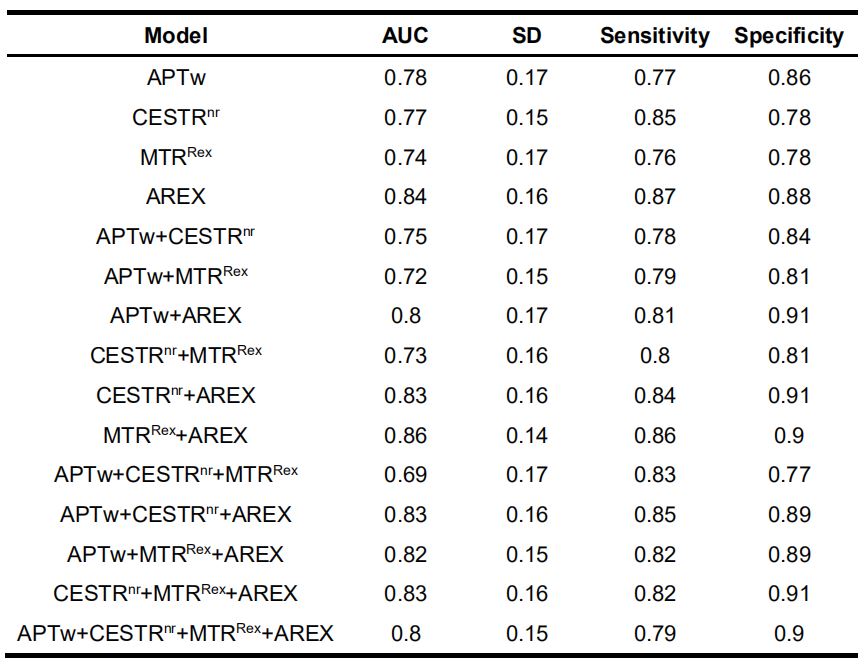
Fig.1 shows the representative cases of low-risk and high-risk NBs, where the risk group cannot be distinguished from conventional MRI. However, the maps of APT-related metrics demonstrate substantially higher values in high-risk NBs than those in low-risk NBs. The radiomic workflow is depicted in Fig. 2. The performance of discriminating NB risk groups using four mean metric values with respective optimal cutoff is exhibited in Fig. 3a. And the AUCs of 28 single-metric radiomic models are displayed in a heatmap (Fig. 3b). Notably, the AREX radiomic model (AUC=0.84) obtained a higher AUC than the mean AREX value (AUC=0.81). And, the AREX metric yielded higher AUCs (AUC=0.78~0.84) than those from the other metrics (AUC=0.63~0.78). Besides, among the different classifiers in the radiomic analysis, the Lasso classifier performed the best. The heatmap of AUCs from 11 multi-metric combinations in conjunction with seven classifiers is shown in Fig. 4. Similarly, among the various multi-metric models, the AUC of the Lasso group was the highest. The performance of the single-metric and multi-metric models constructed by the Lasso classifier on validation sets is shown in Fig. 5. The model integrating MTRRex and AREX features achieved the best performance (AUC=0.86±0.14; Sensitivity=0.86; Specificity=0.9) in differentiating high-risk NBs from low-risk NBs.DISCUSSION and CONCLUSION
We proposed a radiomic model based on APT MRI for non-invasive risk stratification of abdominal NB in children. Our findings showed the radiomic models constructed by APT-related metrics improved the prediction ability of NB risk groups, compared to the mean values of those metrics. Moreover, the AREX metric outperformed the other three metrics, and the Lasso classifier showed the best performance among all seven classifiers. Furthermore, the combination of multiple metrics improved the performance compared with the single metric. In conclusion, the radiomic models of APT MRI are promising biomarkers for preoperative risk stratification of pediatric NB in the abdomen.Acknowledgements
NSFC grant numbers: 61801421 and 81971605. Leading Innovation and Entrepreneurship Team of Zhejiang Province: 2020R01003. This work was supported by the MOE Frontier Science Center for Brain Science & Brain-Machine Integration, Zhejiang University.References
1. Maris JM, Hogarty MD, Bagatell R, Cohn SL. Neuroblastoma. Lancet. 2007;369(9579):2106-20.
2. Zhou J, Payen J-F, Wilson DA, Traystman RJ, van Zijl PC. Using the amide proton signals of intracellular proteins and peptides to detect pH effects in MRI. Nat Med. 2003;9(8):1085-90.
3. Zhou JY, Tryggestad E, Wen ZB, Lal B, Zhou TT, Grossman R, et al. Differentiation between glioma and radiation necrosis using molecular magnetic resonance imaging of endogenous proteins and peptides. Nat Med. 2011;17(1):130-U308.
4. Togao O, Yoshiura T, Keupp J, Hiwatashi A, Yamashita K, Kikuchi K, et al. Amide proton transfer imaging of adult diffuse gliomas: correlation with histopathological grades. Neuro Oncol. 2014;16(3):441-8.
5. Zhang H, Yong X, Ma X, Zhao J, Shen Z, Chen X, et al. Differentiation of low- and high-grade pediatric gliomas with amide proton transfer imaging: added value beyond quantitative relaxation times. Eur Radiol. 2021.
6. Nishie A, Takayama Y, Asayama Y, Ishigami K, Ushijima Y, Okamoto D, et al. Amide proton transfer imaging can predict tumor grade in rectal cancer. Magn Reson Imaging. 2018;51:96-103.
7. Ohno Y, Yui M, Koyama H, Yoshikawa T, Seki S, Ueno Y, et al. Chemical Exchange Saturation Transfer MR Imaging: Preliminary Results for Differentiation of Malignant and Benign Thoracic Lesions. Radiology. 2016;279(2):578-89.
8. Gillies RJ, Kinahan PE, Hricak H. Radiomics: Images Are More than Pictures, They Are Data. Radiology. 2016;278(2):563-77.
9. In Den Kleef JJE, Cuppen JJM. RLSQ:T1,T2, and ρ calculations, combining ratios and least squares. Magn Reson Med. 1987;5(6):513-24.
10. Heo HY, Lee DH, Zhang Y, Zhao X, Jiang S, Chen M, et al. Insight into the quantitative metrics of chemical exchange saturation transfer (CEST) imaging. Magn Reson Med. 2017;77(5):1853-65.
11. Zhang Y, Heo HY, Lee DH, Zhao X, Jiang S, Zhang K, et al. Selecting the reference image for registration of CEST series. J Magn Reson Imaging. 2016;43(3):756-61.
12. Kim M, Gillen J, Landman BA, Zhou J, Van Zijl PCM. Water saturation shift referencing (WASSR) for chemical exchange saturation transfer (CEST) experiments. Magn Reson Med. 2009;61(6):1441-50.
13. Van Griethuysen JJM, Fedorov A, Parmar C, Hosny A, Aucoin N, Narayan V, et al. Computational Radiomics System to Decode the Radiographic Phenotype. Cancer Res. 2017;77(21):e104-e7.
14. Hanchuan P, Fuhui L, Ding C. Feature selection based on mutual information criteria of max-dependency, max-relevance, and min-redundancy. IEEE T PATTERN ANAL. 2005;27(8):1226-38.
15. Tibshirani R. Regression Shrinkage and Selection via the Lasso. J R Stat Soc, Ser B, Methodol (Online). 1996;58(1):267-88.
Figures