3714
Spatiotemporal structural atlas of the fetal brain depicts cortical developmental patterns in a Chinese population1Key Laboratory for Biomedical Engineering of Ministry of Education, Department of Biodical Engineering, College of Biomedical Engineering & Instrument Science, Zhejiang University, HangZhou, China, 2Department of Biomedical Engineering, Johns Hopkins University School of Medicine, Baltimore, MD, United States, 3Department of Radiology, Cheeloo College of Medicine, Shandong Provincial Hospital, Shandong University, Jinan, China, 4MR Collaboration, Siemens Healthineers Ltd, Shanghai, China, 5Department of Radiology, Shandong Provincial Hospital Affiliated to Shandong First Medical University, Jinan, China
Synopsis
We constructed a 4D spatiotemporal atlas of the normal fetal brain development from 23 to 38 gestational weeks in a Chinese population. We depicted the developmental trajectories of morphological indices of the cerebral cortex, which showed a characteristic regional variations and indicated the developmental order and rates in the different cortical parcels. The fetal brain atlas and fetal cerebral cortex trajectory offer a better understanding of fetal brain development and can be used as an analytic reference for clinicians in diagnostic or research settings.
Introduction
Fetal brains development is a rapid and complex process, especially during the second and third trimesters. This developmental stage can be captured with advanced MRI acquisition and post-processing techniques1-14. Spatiotemporal atlas of the fetal brain enabled us to quantify the normal fetal brain development and useful reference for diagnosis of prenatal diseases. Several previous studies showed fetal T2 atlases with less robust registration method6,10, groupwise registration only1,11, and smaller range of gestational age1,2,6,8. Moreover, the existing studies are predominantly performed in Caucasian or mixed populations. Here, we proposed a Chinese fetal atlas with a wide gestational age range (23-38 GW) and rich anatomic details, using a pairwise and groupwise registration-based algorithm. Furthermore, we characterized the cortical morphological changes that revealed the developmental order and rates in different cortical parcels.Materials and Methods
The MRI data in this study were acquired from 90 healthy fetuses (22.57-39 GW) on a 3T Siemens scanner (MAGNETOM Skyra, Siemens Healthcare, Erlangen, Germany). The fetal brain structural MRI was performed using a T2-HASTE sequence in the axial, coronal, and sagittal planes at an in-plane resolution of $$$1.1\times1.1 {mm}^{2}$$$ and a slice-thickness of $$$2mm$$$.The preprocessing, including brain extraction, signal inhomogeneity correction, slice-to-volume registration, and super-resolution reconstruction was performed using the NiftyMIC15, and the multiple orthogonal 2D stacks were reconstructed into the high-resolution of $$$0.8\times0.8\times0.8 {mm}^{3}$$$ 3D volume by NiftyMIC.
Fetal brain atlas was constructed for each gestational age by first grouping the subject with an adaptive kernel algorithm16 according to their GA (Figure 1b), such that each week contained 5-9 subjects. The atlas construction pipeline, as shown in Figure 1a, can be divided into two steps, initial template construction, and then template update. During the first step, the initial template $$$T_0^t$$$ was constructed by weighted averaging the pairwise registered images $$$I_i^{\prime\prime}\left(i=1,2,...,N\right)$$$ at a given gestational age $$$t$$$. The pairwise registration method16,17 selects each subject image $$$I_i\left(i=1,2,...,N\right)$$$ as the target in turn, and the rest of subject images are registered to the target using rigid, affine, and SyN18 registrations. Subsequently, a shape-update procedure was performed, by applying the weighted averaged transformations to each weighted averaged target $$$I_i^\prime\left(i=1,2,...,N\right)$$$, to obtain an unbiased mean image $$$I_i^{\prime\prime}\left(i=1,2,...,N\right)$$$, where the weights were obtained from the adaptive kernel (Figure 1b). The pairwise registration is important for capturing structure information of each subject and the shape-update is necessary for eliminating bias in the atlas toward any of the original images (dashed contours on $$$I_i^{\prime\prime}$$$). The second step updated the template iteratively based on groupwise registration, which usually converged in 6 to 10 iterations, and we took the 10th iteration result as our final template at each GA weeks.
The 3D-reconstructed fetal brains were segmented in DrawEM19, and then the cortical gray matter(cGM) label was manually corrected by experts. The white matter surface and the pial surface were then obtained using the dHCP-structural-pipeline20, which was modified to adapt to our fetal data (originally defined for neonates). Vertex-wise cortical indicators, including the thickness, mean curvature, sulcal depth, and surface area, were computed20. The Beta growth and decay model21 was chosen to fit the cortical thickness in each region that exhibited a bi-phasic change. Mean curvature data were fitted with previously used Gompertz growth model3,22. The surface area was fitted using an Exponential growth model while sulcal depth was fitted linearly. The models were selected based on the trajectory pattern and also the goodness-of-fit.
Results
Figure 2 shows the constructed T2 atlases and segmentation results at different gestational ages, using our Chinese population (CHP). Compared with CRL atlas11(Figure 2b), our atlas shows slight differences in a few anatomical details, such as the degree of gyrification (red circles). Figure 3 shows the surface maps of curvature, cortical thickness, and sulcal depth of the fetal brain at each GA.The cGM thickness in Figure 4 demonstrated the thickness first increased and then declined with GA, and distinct regional specificity can be observed in Figure 4c. Figure 4d shows turning-point (Te1) when thickness reached the peak in different regions. Te of the parietal lobe was found to be the earliest, followed by occipital, temporal and frontal lobe. Figure 5 shows the different trajectories of the 4 cortical morphology indices from 23 to 38 GW, with regional maps of the characteristic model parameters. For instance, the inflection point of the Gompertz growth model (Te2) for curvature indicated similar developmental order as that from thickness; and the slope of the linear model for sulcal depth (k1) and exponential index for surface area (k2) indicated the developmental rates in different ROIs (Figure 5c, d).
Discussion and Conclusions
We developed a 4D spatiotemporal T2 fetal brain atlas from 23-38 gestational weeks that depicts developmental trajectories in normal Chinese fetal brains. We think the bi-phasic (first increase and then decrease) pattern in cortical thickness and the expansion of surface area reflect the neuronal proliferation and migration; while that later decline of thickness in cGM during the third trimester might be related to the lamination within the cortical plate. The inflection points (Te) and growth rate (k) of different regions captures spatial pattern of fetal brain development.Acknowledgements
This work was supported by Ministry of Science and Technology of the People’s Republic of China (2018YFE0114600), National Natural Science Foundation of China (61801424, 81971606, 82122032), and Science and Technology Department of Zhejiang Province (202006140).
References
1. Zhan J, Dinov I D, Li J, et al. Spatial–temporal atlas of human fetal brain development during the early second trimester. NeuroImage. 2013;82(115-126.
2. Wu J, Sun T, Yu B, et al. Age-specific structural fetal brain atlases construction and cortical development quantification for chinese population. NeuroImage. 2021;241(118412.
3. Wright R, Kyriakopoulou V, Ledig C, et al. Automatic quantification of normal cortical folding patterns from fetal brain MRI. NeuroImage. 2014;91(21-32.
4. Vasung L, Rollins C K, Velasco-Annis C, et al. Spatiotemporal Differences in the Regional Cortical Plate and Subplate Volume Growth during Fetal Development. Cerebral Cortex. 2020;30(8): 4438-4453.
5. Vasung L, Lepage C, Radoš M, et al. Quantitative and Qualitative Analysis of Transient Fetal Compartments during Prenatal Human Brain Development. 2016;10(11):
6. Serag A, Aljabar P, Kyriakopoulou V, et al. A Multi-channel 4D Probabilistic Atlas of the Developing Brain: Application to Fetuses and Neonates. Special Issue of the Annals of the British Machine Vision Association. 2011;
7. Scott J A, Habas P A, Kim K, et al. Growth trajectories of the human fetal brain tissues estimated from 3D reconstructed in utero MRI. International Journal of Developmental Neuroscience. 2011;29(5): 529-536.
8. Li H, Yan G, Luo W, et al. Mapping fetal brain development based on automated segmentation and 4D brain atlasing. Brain Structure and Function. 2021;226(6): 1961-1972.
9. Habas P A, Scott J A, Roosta A, et al. Early Folding Patterns and Asymmetries of the Normal Human Brain Detected from in Utero MRI. Cerebral Cortex. 2011;22(1): 13-25.
10. Habas P A, Kim K, Corbett-Detig J M, et al. A spatiotemporal atlas of MR intensity, tissue probability and shape of the fetal brain with application to segmentation. NeuroImage. 2010;53(2): 460-470.
11. Gholipour A, Rollins C K, Velasco-Annis C, et al. A normative spatiotemporal MRI atlas of the fetal brain for automatic segmentation and analysis of early brain growth. Sci Rep. 2017;7(1): 476-476.
12. Garel C, Chantrel E, Brisse H, et al. Fetal cerebral cortex: normal gestational landmarks identified using prenatal MR imaging. AJNR Am J Neuroradiol. 2001;22(1): 184-189.
13. Clouchoux C, Kudelski D, Gholipour A, et al. Quantitative in vivo MRI measurement of cortical development in the fetus. Brain Structure and Function. 2012;217(1): 127-139.
14. Andescavage N N, du Plessis A, McCarter R, et al. Complex Trajectories of Brain Development in the Healthy Human Fetus. Cerebral Cortex. 2016;27(11): 5274-5283.
15. Ebner M, Wang G, Li W, et al. An automated framework for localization, segmentation and super-resolution reconstruction of fetal brain MRI. NeuroImage. 2020;206(116324.
16. Serag A, Aljabar P, Ball G, et al. Construction of a consistent high-definition spatio-temporal atlas of the developing brain using adaptive kernel regression. NeuroImage. 2012;59(3): 2255-2265.
17. Seghers D, D’Agostino E, Maes F, et al. Construction of a Brain Template from MR Images Using State-of-the-Art Registration and Segmentation Techniques. Springer Berlin Heidelberg. 2004. 696-703.
18. Avants B B, Epstein C L, Grossman M, et al. Symmetric diffeomorphic image registration with cross-correlation: evaluating automated labeling of elderly and neurodegenerative brain. Med Image Anal. 2008;12(1): 26-41.
19. Makropoulos A, Gousias I S, Ledig C, et al. Automatic Whole Brain MRI Segmentation of the Developing Neonatal Brain. IEEE Transactions on Medical Imaging. 2014;33(9): 1818-1831.
20. Makropoulos A, Robinson E C, Schuh A, et al. The developing human connectome project: A minimal processing pipeline for neonatal cortical surface reconstruction. NeuroImage. 2018;173(88-112.
21. YIN X, GOUDRIAAN J, LANTINGA E A, et al. A Flexible Sigmoid Function of Determinate Growth. Annals of Botany. 2003;91(3): 361-371.
22. Makropoulos A, Aljabar P, Wright R, et al. Regional growth and atlasing of the developing human brain. NeuroImage. 2016;125(456-478.
Figures
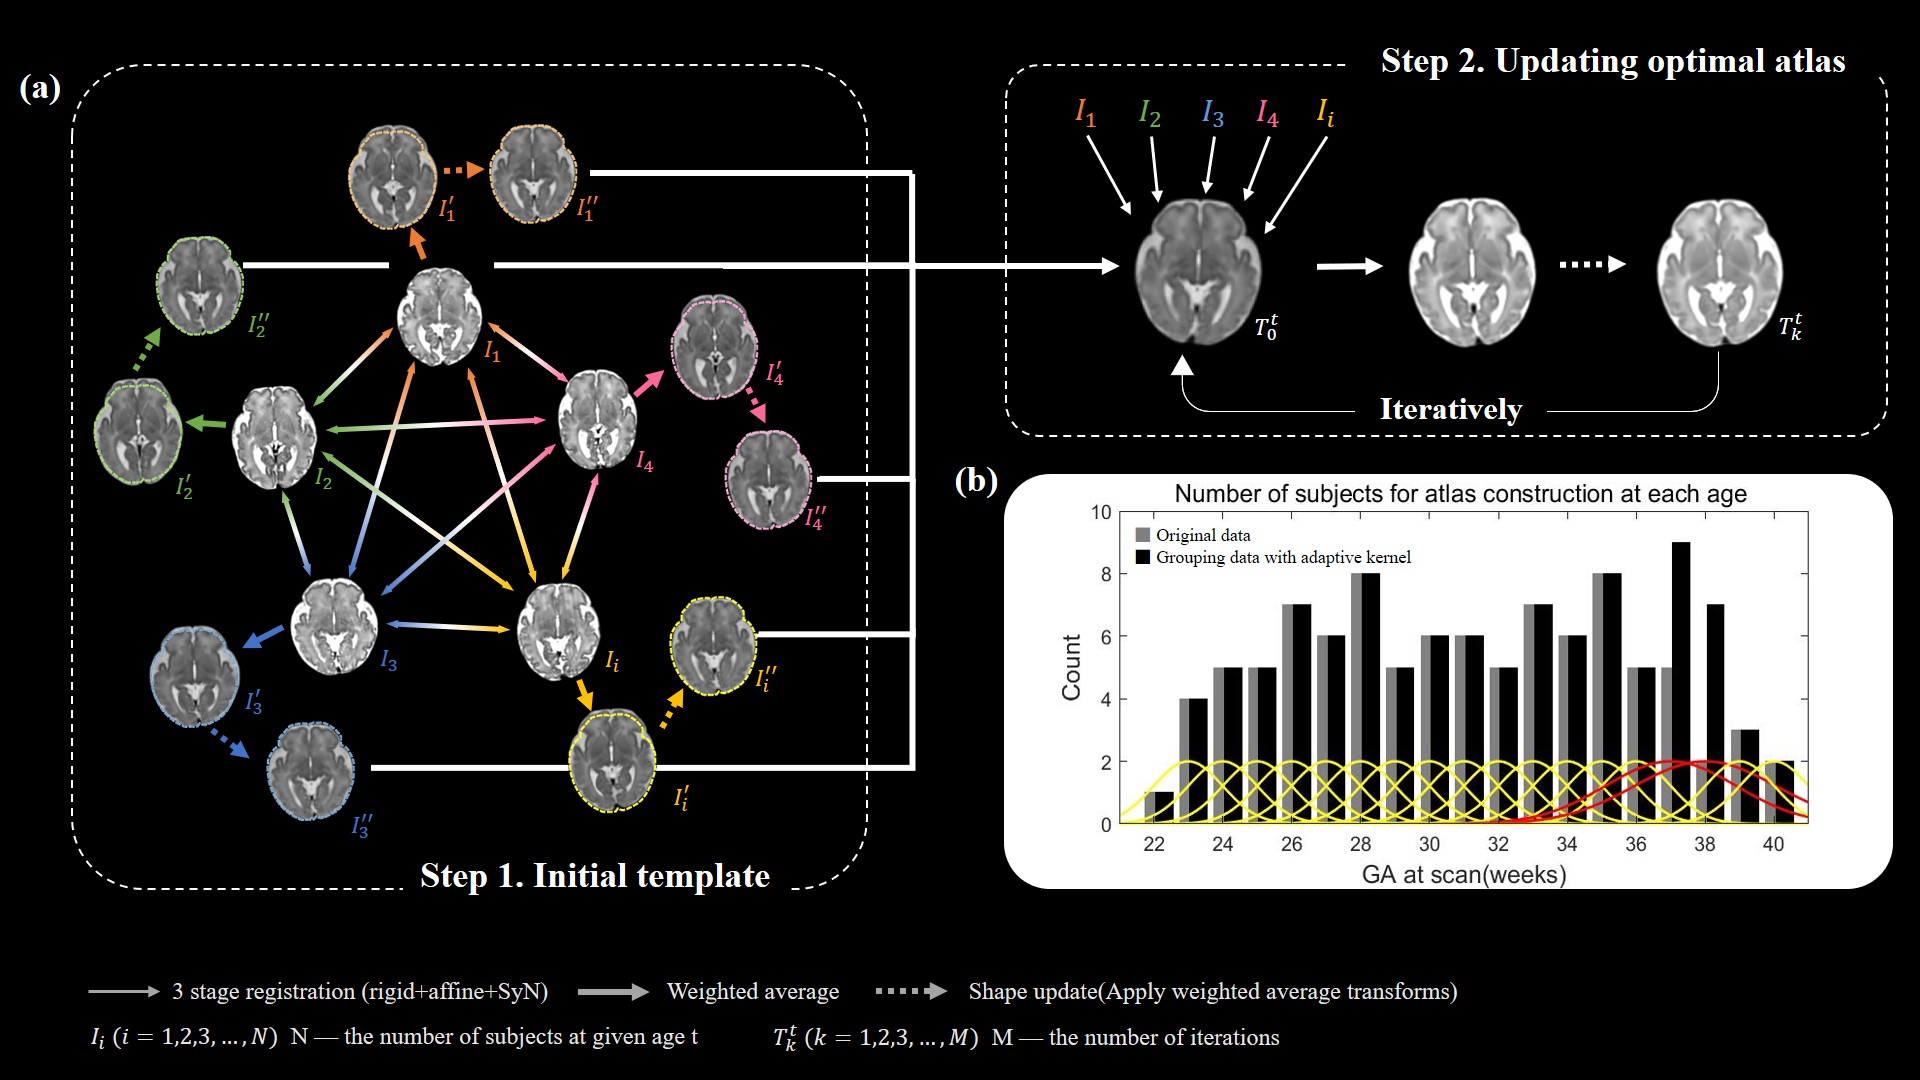
Figure 1. (a) Fetal atlas generation pipeline. Step 1, building the initial template, T0t. Step 2, iterative update of the atlas Tkt. (b) The number of subjects used for atlas construction at each GA weeks, determined using an adaptive kernel approach with the weights shown in yellow and red.
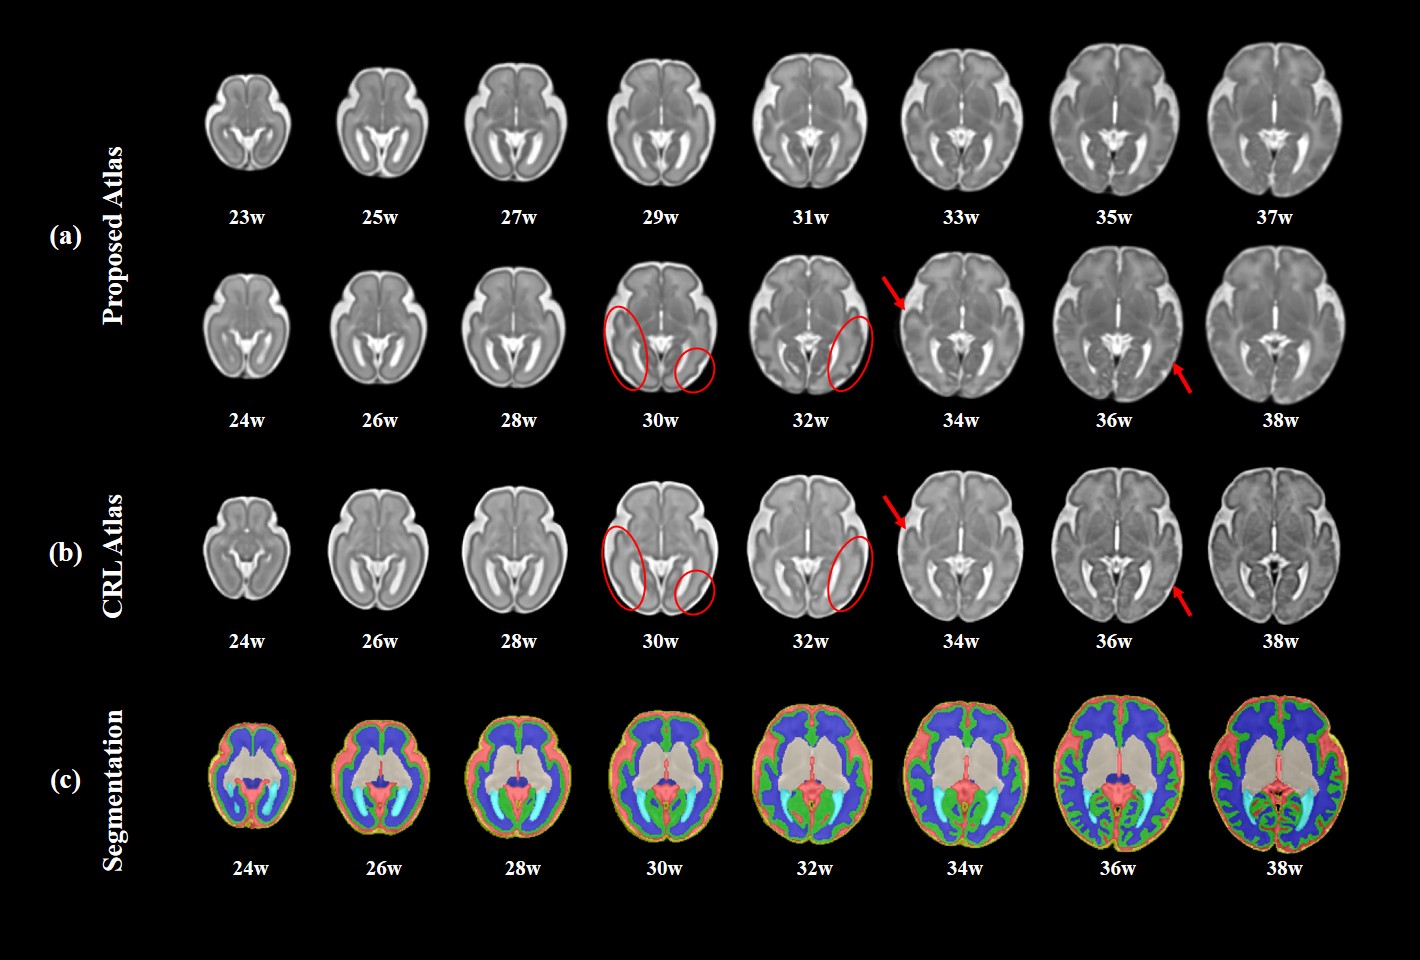
Figure 2. (a) The 4D spatiotemporal T2 atlas at representative gestation ages. (b) CRL atlas at corresponding gestational age. (c) Tissue segmentation maps of our atlas. Slight differences shown in red circles and red arrows.
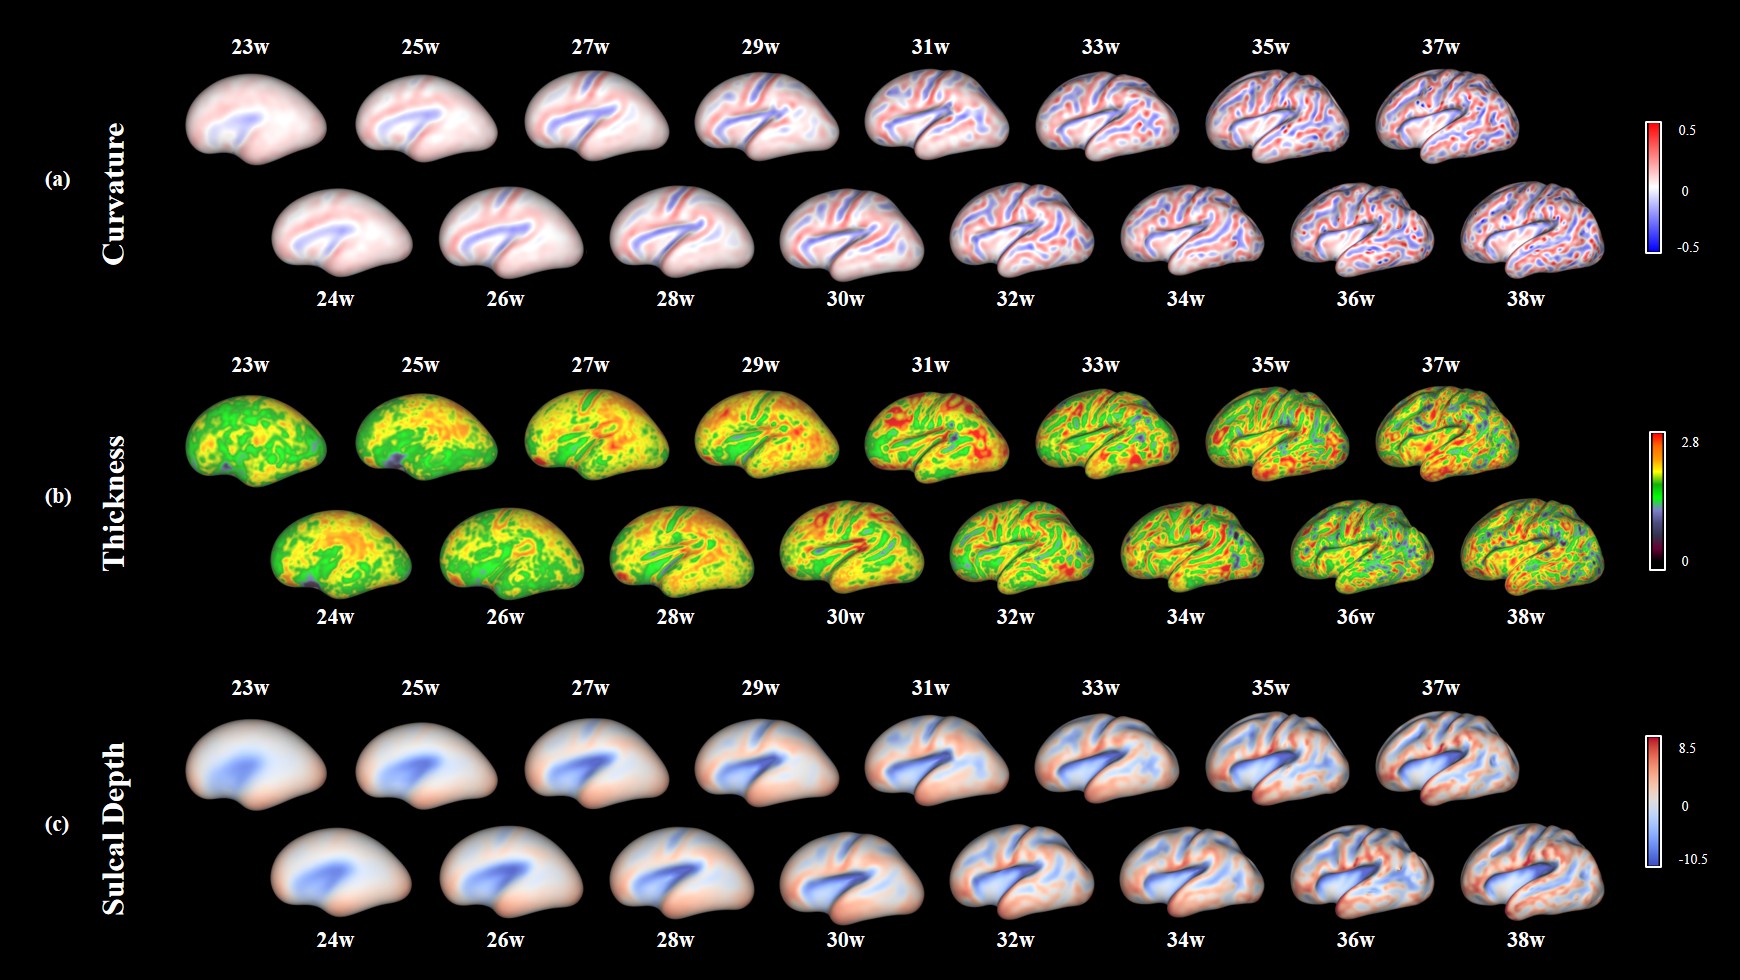
Figure 3. Vertex-wise cortical morphological indices, including (a) curvature, (b) thickness, and (c) sulcal depth, on the inflated surface of atlas at each gestational age.

Figure 4. Developmental trajectories of the cortical thickness in the fetal brains. (a) The thickness on inflated surface at every other GA weeks. (b) Beta growth and decay model fitting of thickness of whole brain and hemispheres. (c) Beta growth and decay model fitting of thickness of individual cortical regions. Dash line represents Te in different regions for the left (blue) and right (red) sides. (d) Comparison of Te between different cortical regions.
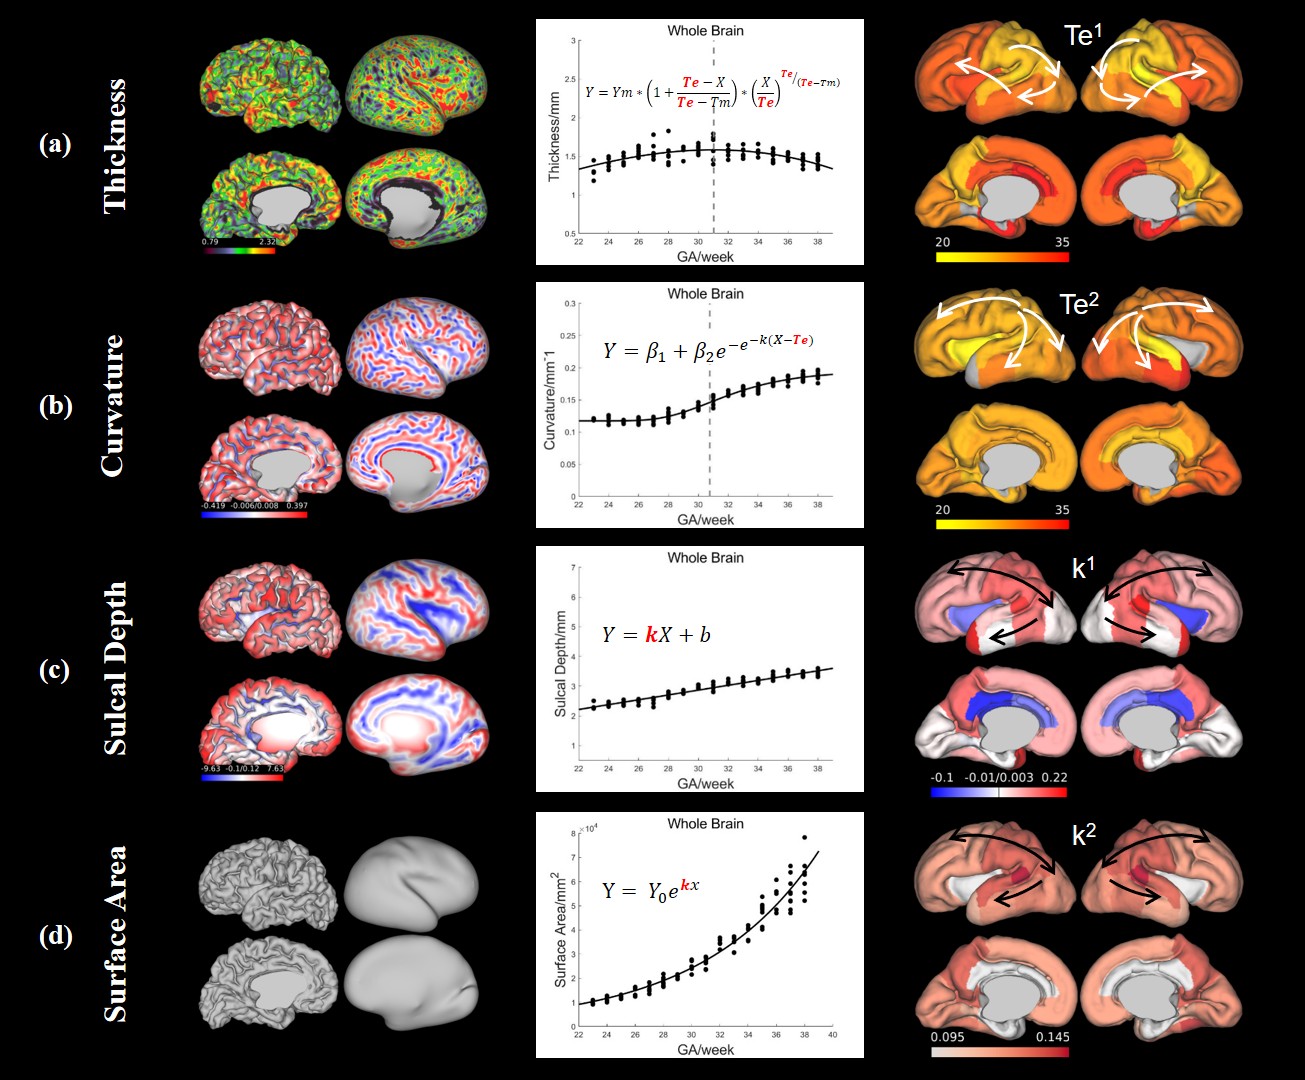
Figure 5. Left column: Vertex-wise cortical morphological index maps on mid-thickness surface and inflated surface at 39 GW subject. Middle column: The Model fitting results based on the whole-brain measurements. Right column: The parameter maps (Te1 of the Beta growth and decay model, Te2 of the Gompertz model, k1 of the linear model and k2 of the exponential model) show in lateral and medial view of mid-thickness surface at 30 GW atlas. (a) Curvature. (b) Sulcal Depth. (c) Thickness. (d) Surface area.