3710
CEST vs. DWI: Capability for Distinguishing Malignant from Benign Prostatic Areas in Patients with Prostatic Cancer1Radiology, Fujita Health University School of Medicine, Toyoake, Japan, 2Joint Research Laboratory of Advanced Medical Imaging, Fujita Health University School of Medicine, Toyoake, Japan, 3Canon Medical Systems Corporation, Otawara, Japan, 4Radiology, Fujita Health University Hospital, Toyoake, Japan
Synopsis
We hypothesize that CEST is at least as valuable as DWI and may have a potential to improve differentiation capability of malignant from benign prostatic areas as one of the combined quantitative discriminators on prostatic MR imaging. The purpose of this study was to compare the capability for distinguishing malignant from benign areas among CEST, DWIs at standard and super high b values and combined quantitative discriminator in suspected prostatic cancer patients.
Introduction
Multi-parametric magnetic resonance (MR) imaging is widely used to detect, localize, and stage prostate cancer. Currently, diffusion-weighted imaging (DWI) is an integral part of the multi-parametric MR imaging in the prostatic cancer, and apparent diffusion coefficient (ADC) maps derived from DWI have not only been shown to detect prostatic cancer, but also ADC values correlate with the histologic grade of it. However, lesions on ADC maps can be subtle and it has been observed that inclusion of DWI with high b value improves the conspicuity of prostatic cancer. Therefore, the recently published PI-RADS ver. 2 criteria is suggested to obtain DWI with high b value above 1400 s/mm21. However, appropriate b value has not been determined in this setting. In the last several years, chemical exchange saturation transfer (CEST) imaging at 3.5 ppm (APTw imaging) has been suggested as one of the MR-based molecular imaging techniques in patients with lung, rectum, uterus and ovary cancers or tumors2-6. CEST Imaging can be performed on proteins, amino acids and DNAs including chemical exchangeable protons such as hydroxyl protons (-OH: ~1ppm), amine protons (-NH2: ~2ppm) and amide protons (R-C(=O)-NH2 or R-C(=O)-NHR1 <R ≠ H>: ~3.5ppm)7, 8. However, no major reports have been evaluated the capability of APTw imaging for differentiation of malignant from benign prostatic areas in patients with prostatic cancer. In addition, no one have not determined how to apply APTw imaging with DWI in this setting. We hypothesize that APTw imaging is at least as valuable as DWI with super high b value and may have a potential to improve differentiation capability of malignant from benign prostatic areas as one of the combined quantitative discriminators on prostatic MR imaging. The purpose of this study was to compare the capability for distinguishing malignant from benign areas among CEST, DWIs at standard and super high b values and combined quantitative discriminator in suspected prostatic cancer patients.Materials and Methods
This study included 60 patients (mean age: 67 years; range=49-80 years) with a mean serum prostate specific antigen (PSA) of 10.2±6.7 ng/mL (range=4.9-87.8 ng/mL) underwent MR imaging of prostate with CEST imaging by 2D fast advanced spin-echo (FASE) sequence with MT pulses and DWI with b values at 0, 1500 (DWI1500) and 3000 (DWI3000) mm2/s by spin-echo (SE) type echo planar imaging (EPI) sequence, systemic prostate biopsy, radical prostatectomy, and pathological examination. All prostatic MR imaging were performed at two 3T MR systems (Vantage Centurian, Otawara, Japan). According to the pathological results, 56 areas were determined as malignant, and 56 out of 664 areas were computationally selected as benign. Magnetization transfer ratio asymmetry (MTRasym) at 3.5 ppm, ADCs from DWI1500 (ADC1500) and DWI3000 (ADC3000) in each area were determined by ROI measurements. To compare each quantitative index between malignant and benign prostatic areas, Student’s t-test was performed. Then, multivariate regression analysis was performed to investigate the discriminating factors for distinguishing malignant from benign prostatic areas. ROC analysis was performed to compare differentiation capability among all indexes as well as combine discriminators. Diagnostic performance was compared among all methods by ROC analysis. Finally, sensitivity, specificity and accuracy were compared among all methods by McNemar’s test. A p value less than 0.05 was considered as significant in this study.Results
Representative cases are shown in Figures 1. Comparison of each quantitative index between malignant and benign prostatic areas is shown in Figure 2. There were significant differences of all indexes between two areas (p<0.05). Multiple regression analysis was revealed that ADC3000 (Odds ratio: 0.00003, p<0.0001) and MTRasym at 3.5ppm (Odds ratio: 1.01, p=0.007) as discriminators. Results of ROC analysis and diagnostic performance among all quantitative indexes and combined discriminators are shown in Figure 3. Area under the curve (AUC), specificity and accuracy of ADC3000 were significantly larger or higher than those of ADC1500 (p<0.05). AUC, sensitivity and accuracy of combined discriminators were significantly larger or higher than those of ADC1500, ADC3000 and MTRasym at 3.5ppm (p<0.05).Conclusion
CEST is considered as valuable as DWIs at b value as 1500 and 3000mm2/s and would be better to be combined with DWI3000 for distinguishing malignant from benign areas in suspected prostatic cancer patients.Acknowledgements
This study was technically and financially supported by Canon Medical Systems Corporation.References
- Purysko AS, Baroni RH, Giganti F, et al. PI-RADS Version 2.1: A Critical Review, From the AJR Special Series on Radiology Reporting and Data Systems. AJR Am J Roentgenol. 2021; 216(1): 20-32.
- Ohno Y, Yui M, Koyama H, et al. Chemical Exchange Saturation Transfer MR Imaging: Preliminary Results for Differentiation of Malignant and Benign Thoracic Lesions. Radiology. 2016; 279(2): 578-589.
- Ohno Y, Kishida Y, Seki S, et al. Amide proton transfer-weighted imaging to differentiate malignant from benign pulmonary lesions: Comparison with diffusion-weighted imaging and FDG-PET/CT. J Magn Reson Imaging. 2018; 47(4): 1013-1021.
- Takayama Y, Nishie A, Togao O, et al. Amide Proton Transfer MR Imaging of Endometrioid Endometrial Adenocarcinoma: Association with Histologic Grade. Radiology. 2018; 286(3): 909-917.
- Nishie A, Takayama Y, Asayama Y, et al. Amide proton transfer imaging can predict tumor grade in rectal cancer. Magn Reson Imaging. 2018; 51: 96-103.
- Ishimatsu K, Nishie A, Takayama Y, et al. Amide proton transfer imaging for differentiating benign ovarian cystic lesions: Potential of first time right. Eur J Radiol. 2019; 120: 108656.
- van Zijl PC, Yadav NN. Chemical exchange saturation transfer (CEST): what is in a name and what isn't? Magn Reson Med. 2011 Apr;65(4):927-48.
- Zhou J, Heo HY, Knutsson L, van Zijl PCM, Jiang S. APT-weighted MRI: Techniques, current neuro applications, and challenging issues. J Magn Reson Imaging. 2019; 50(2): 347-364.
Figures
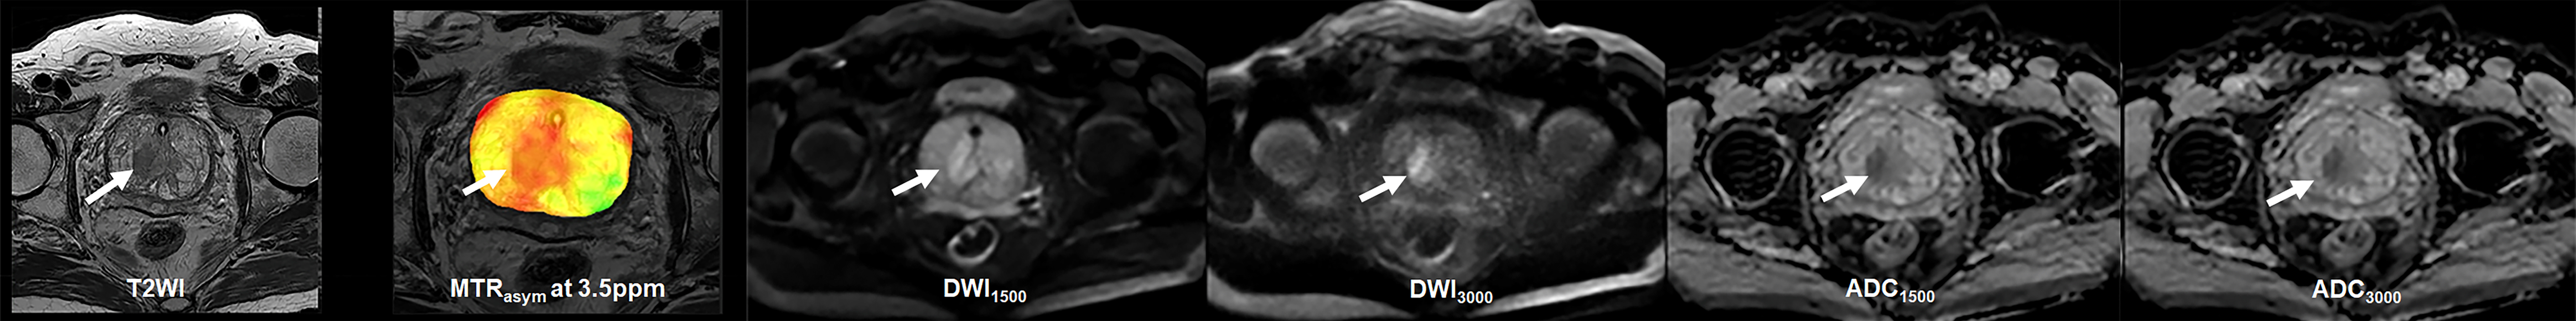
Figure 1. 68-year-old patient with prostatic cancer.
(L to R: T2WI, CEST image at 3.5ppm <APTw image>, DWI at b value as 1500mm2/s (DWI1500), DWI at b value as 3000mm2/s (DWI3000), ADC1500 map and ADC3000 map) Prostatic cancer area(arrow)in the right transitional zone demonstrated as low signal intensity on T2WI, high MTRasym on CEST imaging, high signal intensity on both DWIs and low ADC on both ADC maps. All methods could accurately depict the malignant area.
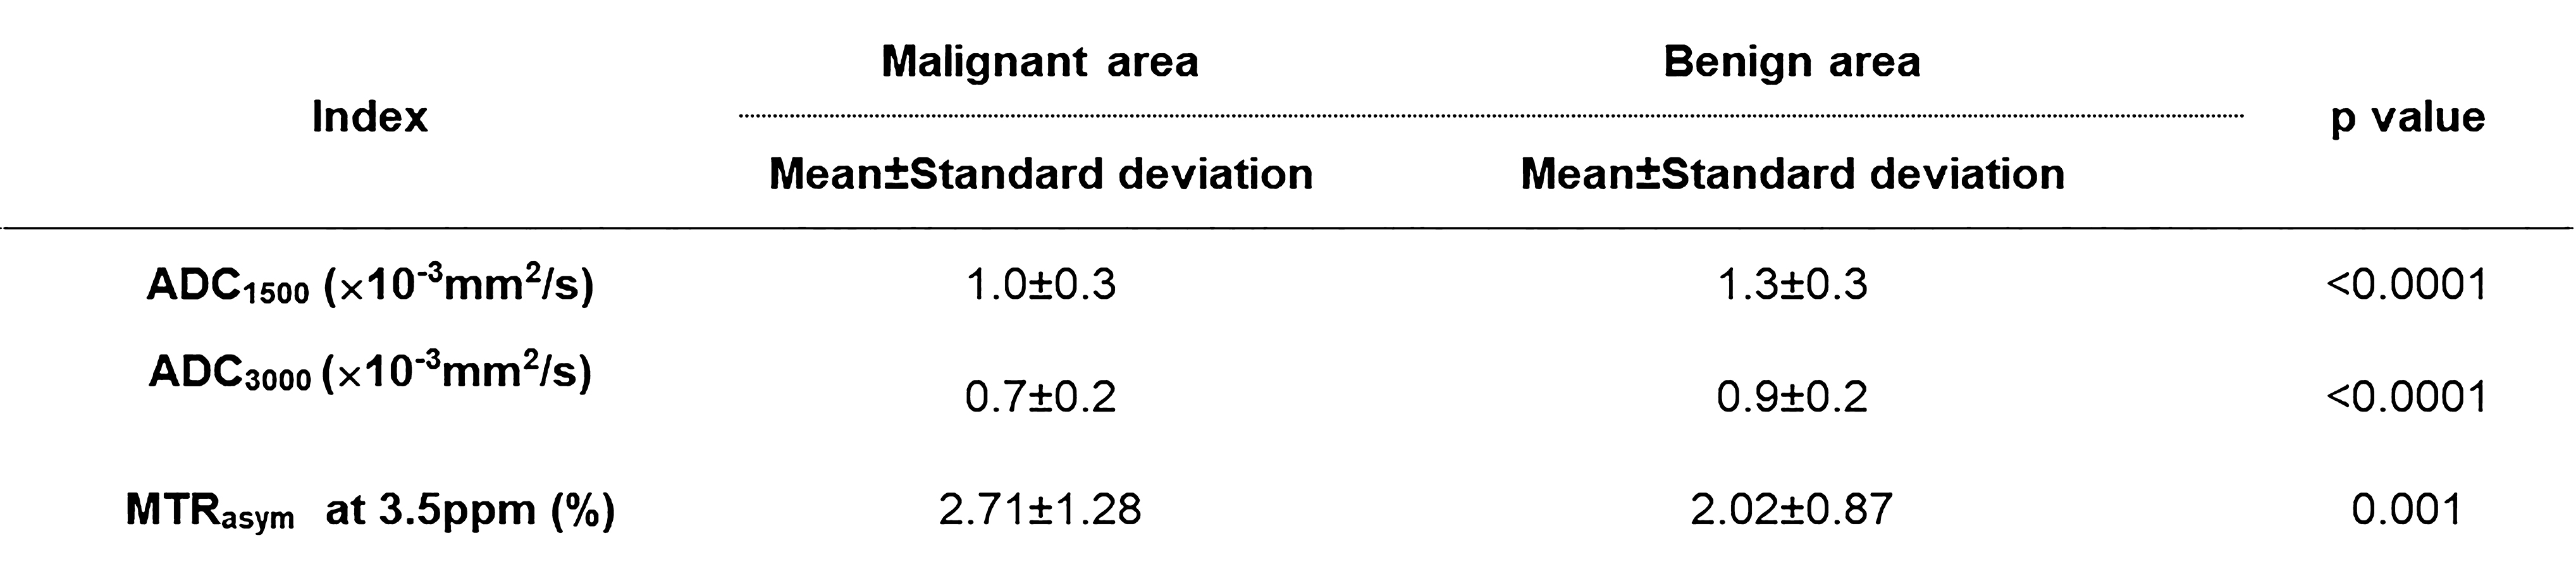
Figure 2. Comparison of each quantitative index between malignant and benign prostatic areas.
All indexes had significant differences between malignant and benign areas (p<0.05).
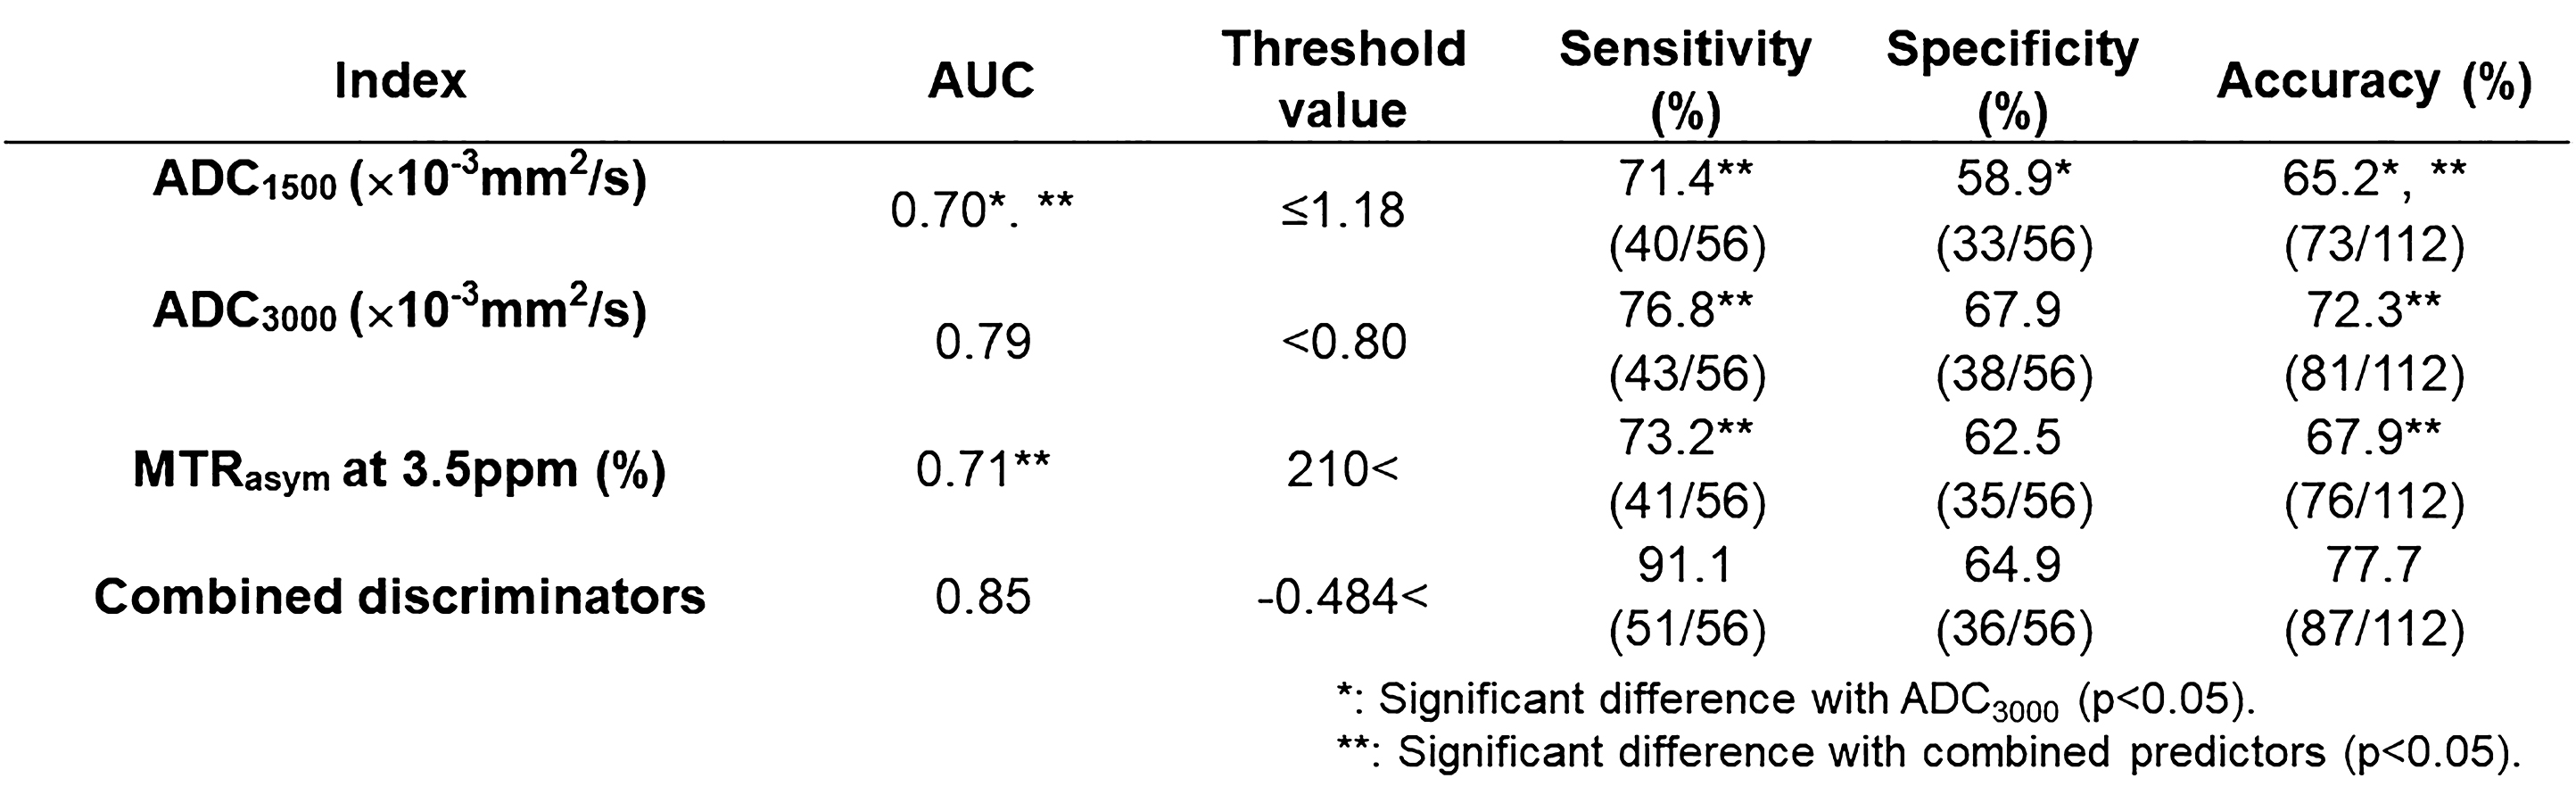
Figure 3. Results of ROC analysis and diagnostic performance among all quantitative indexes and combined discriminators.
ADC3000 showed significantly larger area under the curve (AUC), higher specificty and higher accuracy than ADC1500 (p<0.05). Combined discriminators demonstrated significantly larger AUC, higher sensitivity and higher accuracy than others (p<0.05).