3704
MR-based radiomics-clinical nomogram in epithelial ovarian tumor prognosis prediction: a comparison of effectiveness of multiple MR sequences1Shanghai key lab of magnetic resonance, East China Normal University, Shanghai, China, 2Department of Radiology, Obstetrics and Gynecology Hospital of Fudan University, Shanghai, China
Synopsis
To compare radiomics-clinical nomograms based on various sequence MR images in predicting epithelial ovarian tumor prognosis status. A total of 186 patients with epithelial ovarian cancer pathologically proven by invasive procedure were enrolled. The single-sequence and paired-sequence radiomics signatures were constructed for T2W, T1W, DWI and CE-T1W images. And the T2W radiomic-clinical nomogram achieved a favorable prediction performance in the validation cohort with an AUC of 0.818. And it was also found the T2W radiomic-clinical nomogram was better than other models with a greater clinical net benefit.
Introduction
Epithelial ovarian cancer (EOC) is the most malignant gynecologic cancer in women1. Standard treatment is the combination of carboplatin and paclitaxel chemotherapy2,3. However, most of cases will relapse within three years after the first complete treatment cycle. Patients relapse in half a year largely show the intractable chemotherapy resistance and have the dismal prognosis4,5. Identifying these patients as early as possible may help to design individualized treatment strategy (for example, targeted immunotherapy) and improve the prognosis. We compared the correlations between preoperative MR-based radiomic features and clinical outcome and found the best MR feature predictor (imaging biomarker) across various acquisition sequences6.Methods
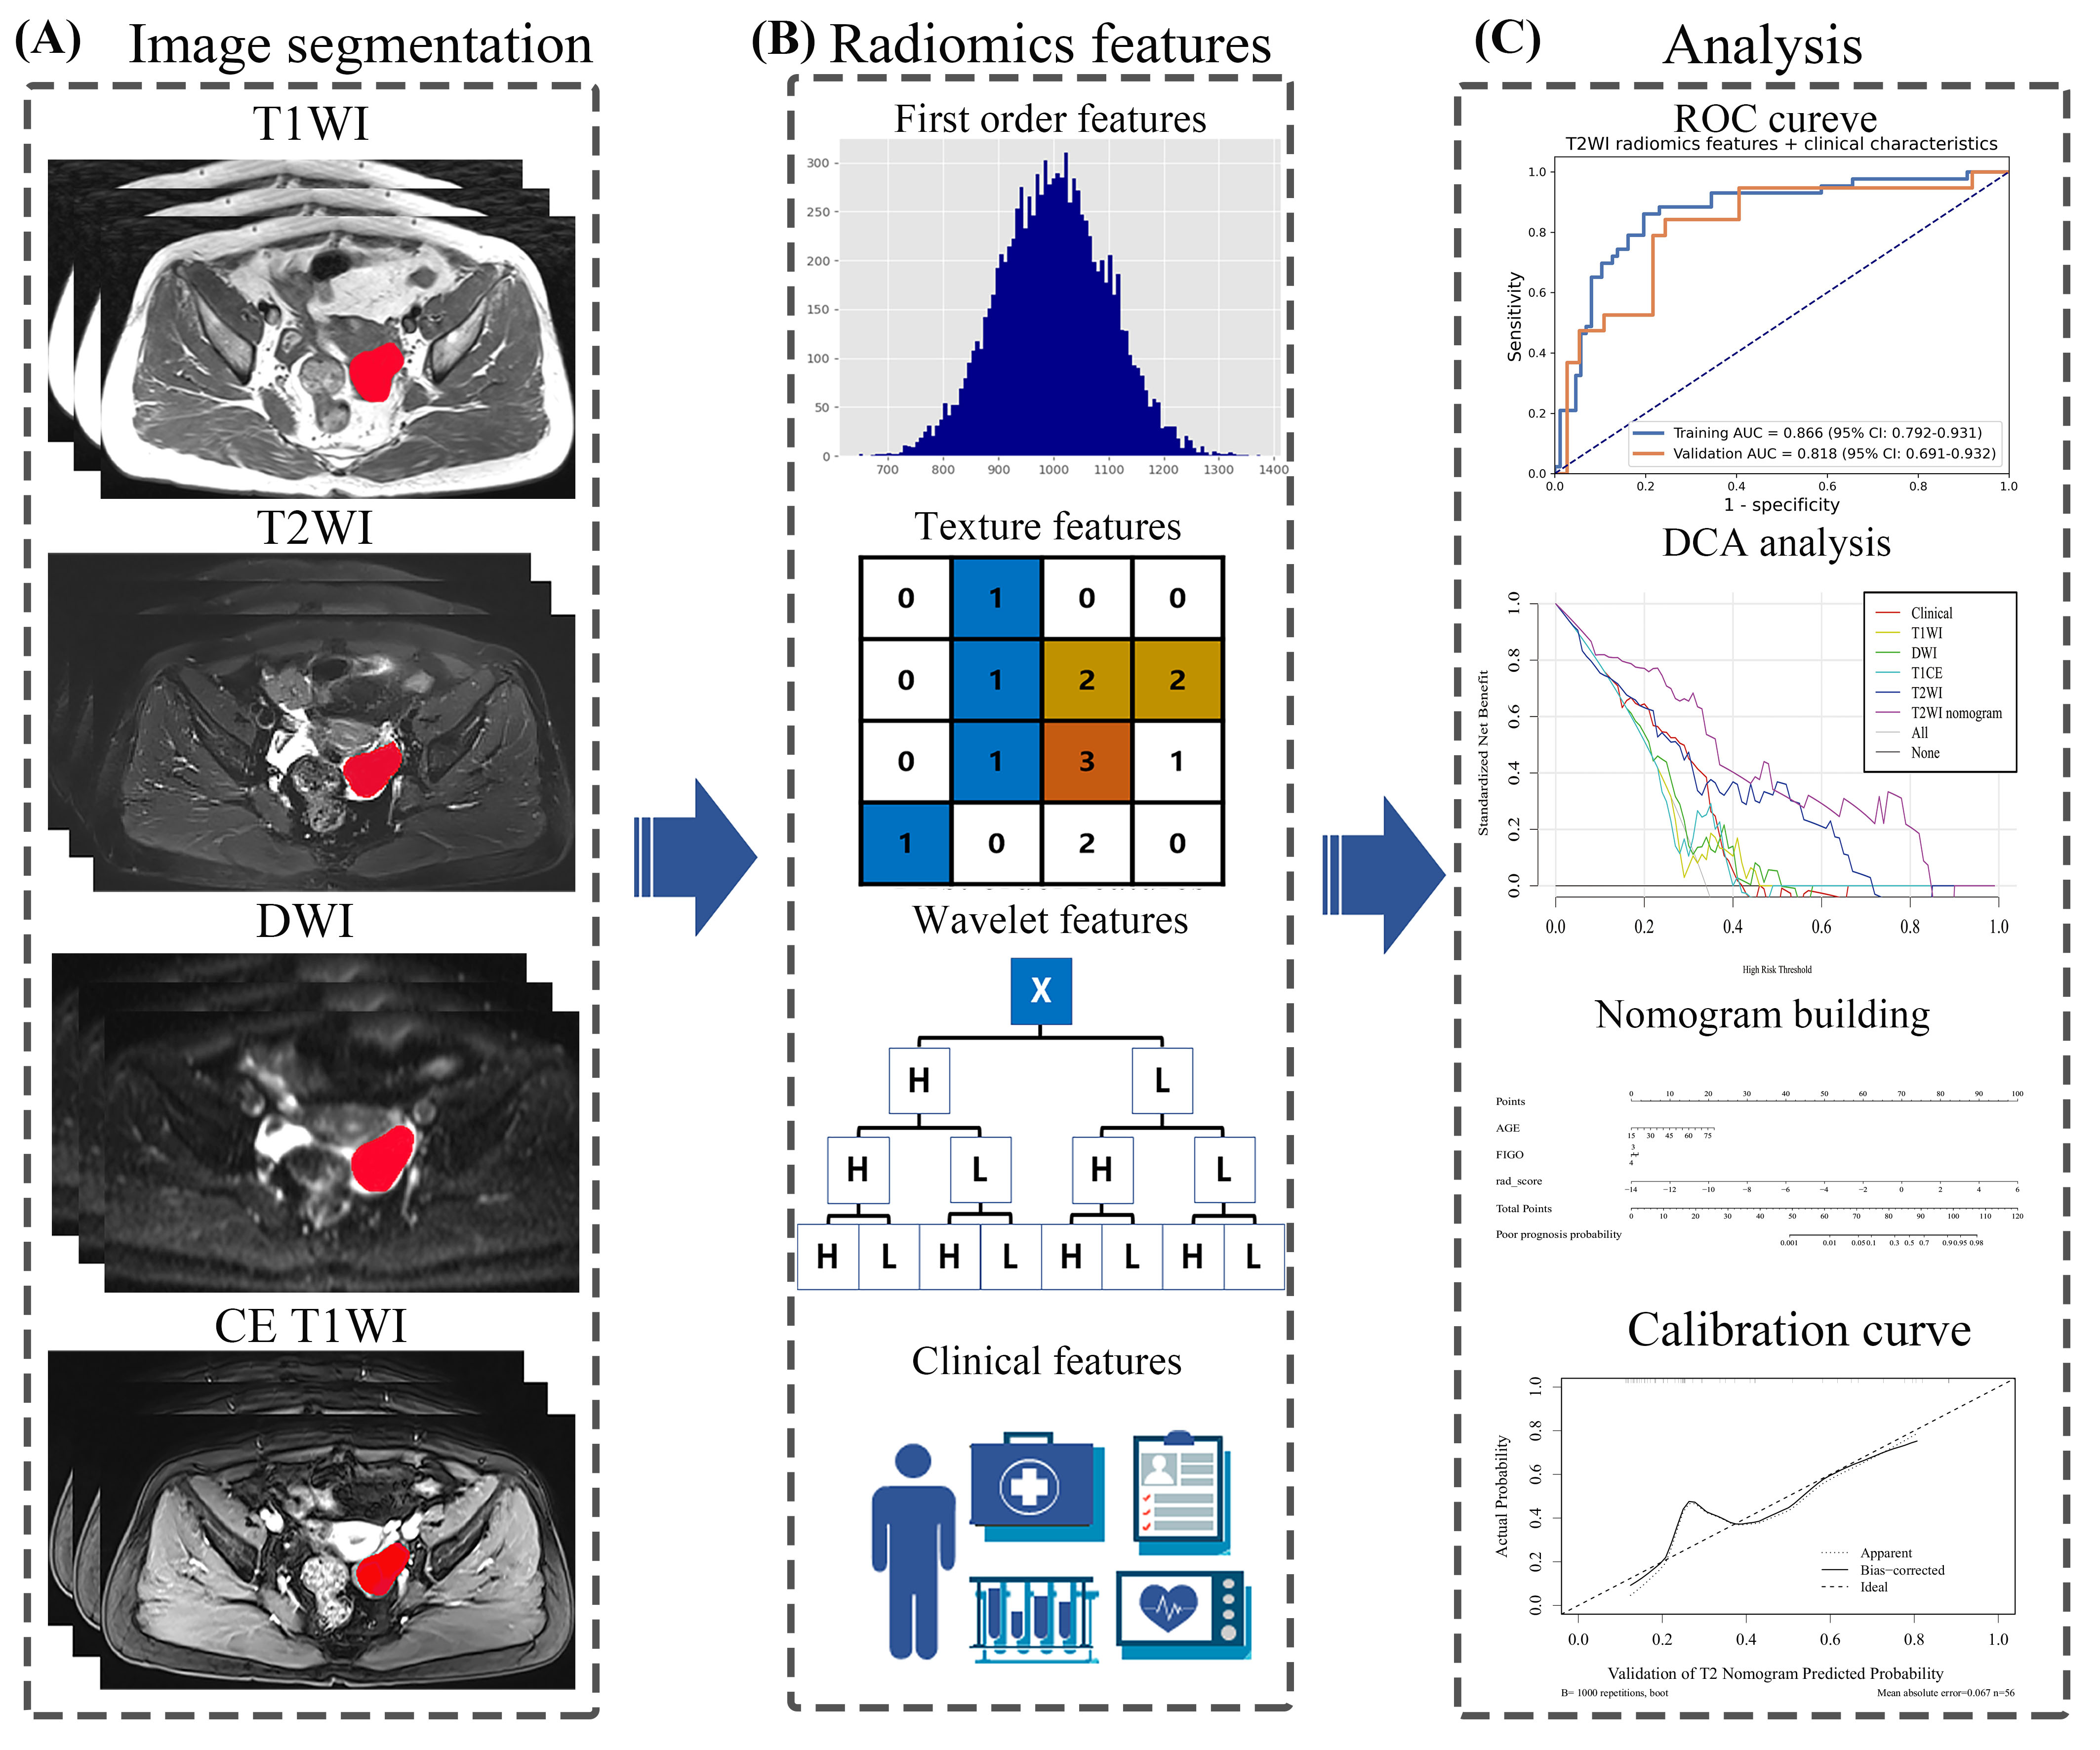
A flowchart of this study was illustrated in Figure 1. A total of 186 patients (124 uneventful / 62 relapse or dead during clinical follow-up) with epithelial ovarian cancer pathologically proven were retrospectively collected from Obstetrics and Gynecology Hospital of Fudan University. Multiple MRI sequences, including T1-weighted imaging (T1W), T2-weighted imaging (T2W), contrast enhanced T1-weighted imaging (CE-T1W) and diffusion weighted imaging (DWI) were acquired with a 1.5T MR system (Magnetom Avanto, Siemens) with a phased-array coil. All EOC lesion segmentation was performed by a radiologist with 10 years of experience (T.W.). The dataset was randomly splitting into a training cohort (n=130) and a validation cohort (n=56), and the same splitting was used for training and evaluation of all models.To find the best MRI sequence for radiomics analysis for epithelial ovarian tumor prognosis prediction, we built radiomics models for each one of T1W, T2W, CE-T1W, and DWI sequences.
For each sequence, 1116 radiomics features were extracted from each tumor from original image, images filtered by Laplacian-of-Gaussian (LoG) filters, or the wavelet transforms. Pearson correlation coefficient (PCC) was calculated for each pair of features, and whenever PCC > 0.99, one random feature in the pair was eliminated to remove redundancy in the candidate feature set. Recursive feature elimination (RFE) were used for feature selection. Three different classifiers, namely linear support vector machine (SVM), Logistic Regression (LR), and Random Forest (RF), were used to find the best one for the prognosis prediction. The best model and the number of retained features in it was selected according its performance in 5-fold cross-validation using the training cohort.
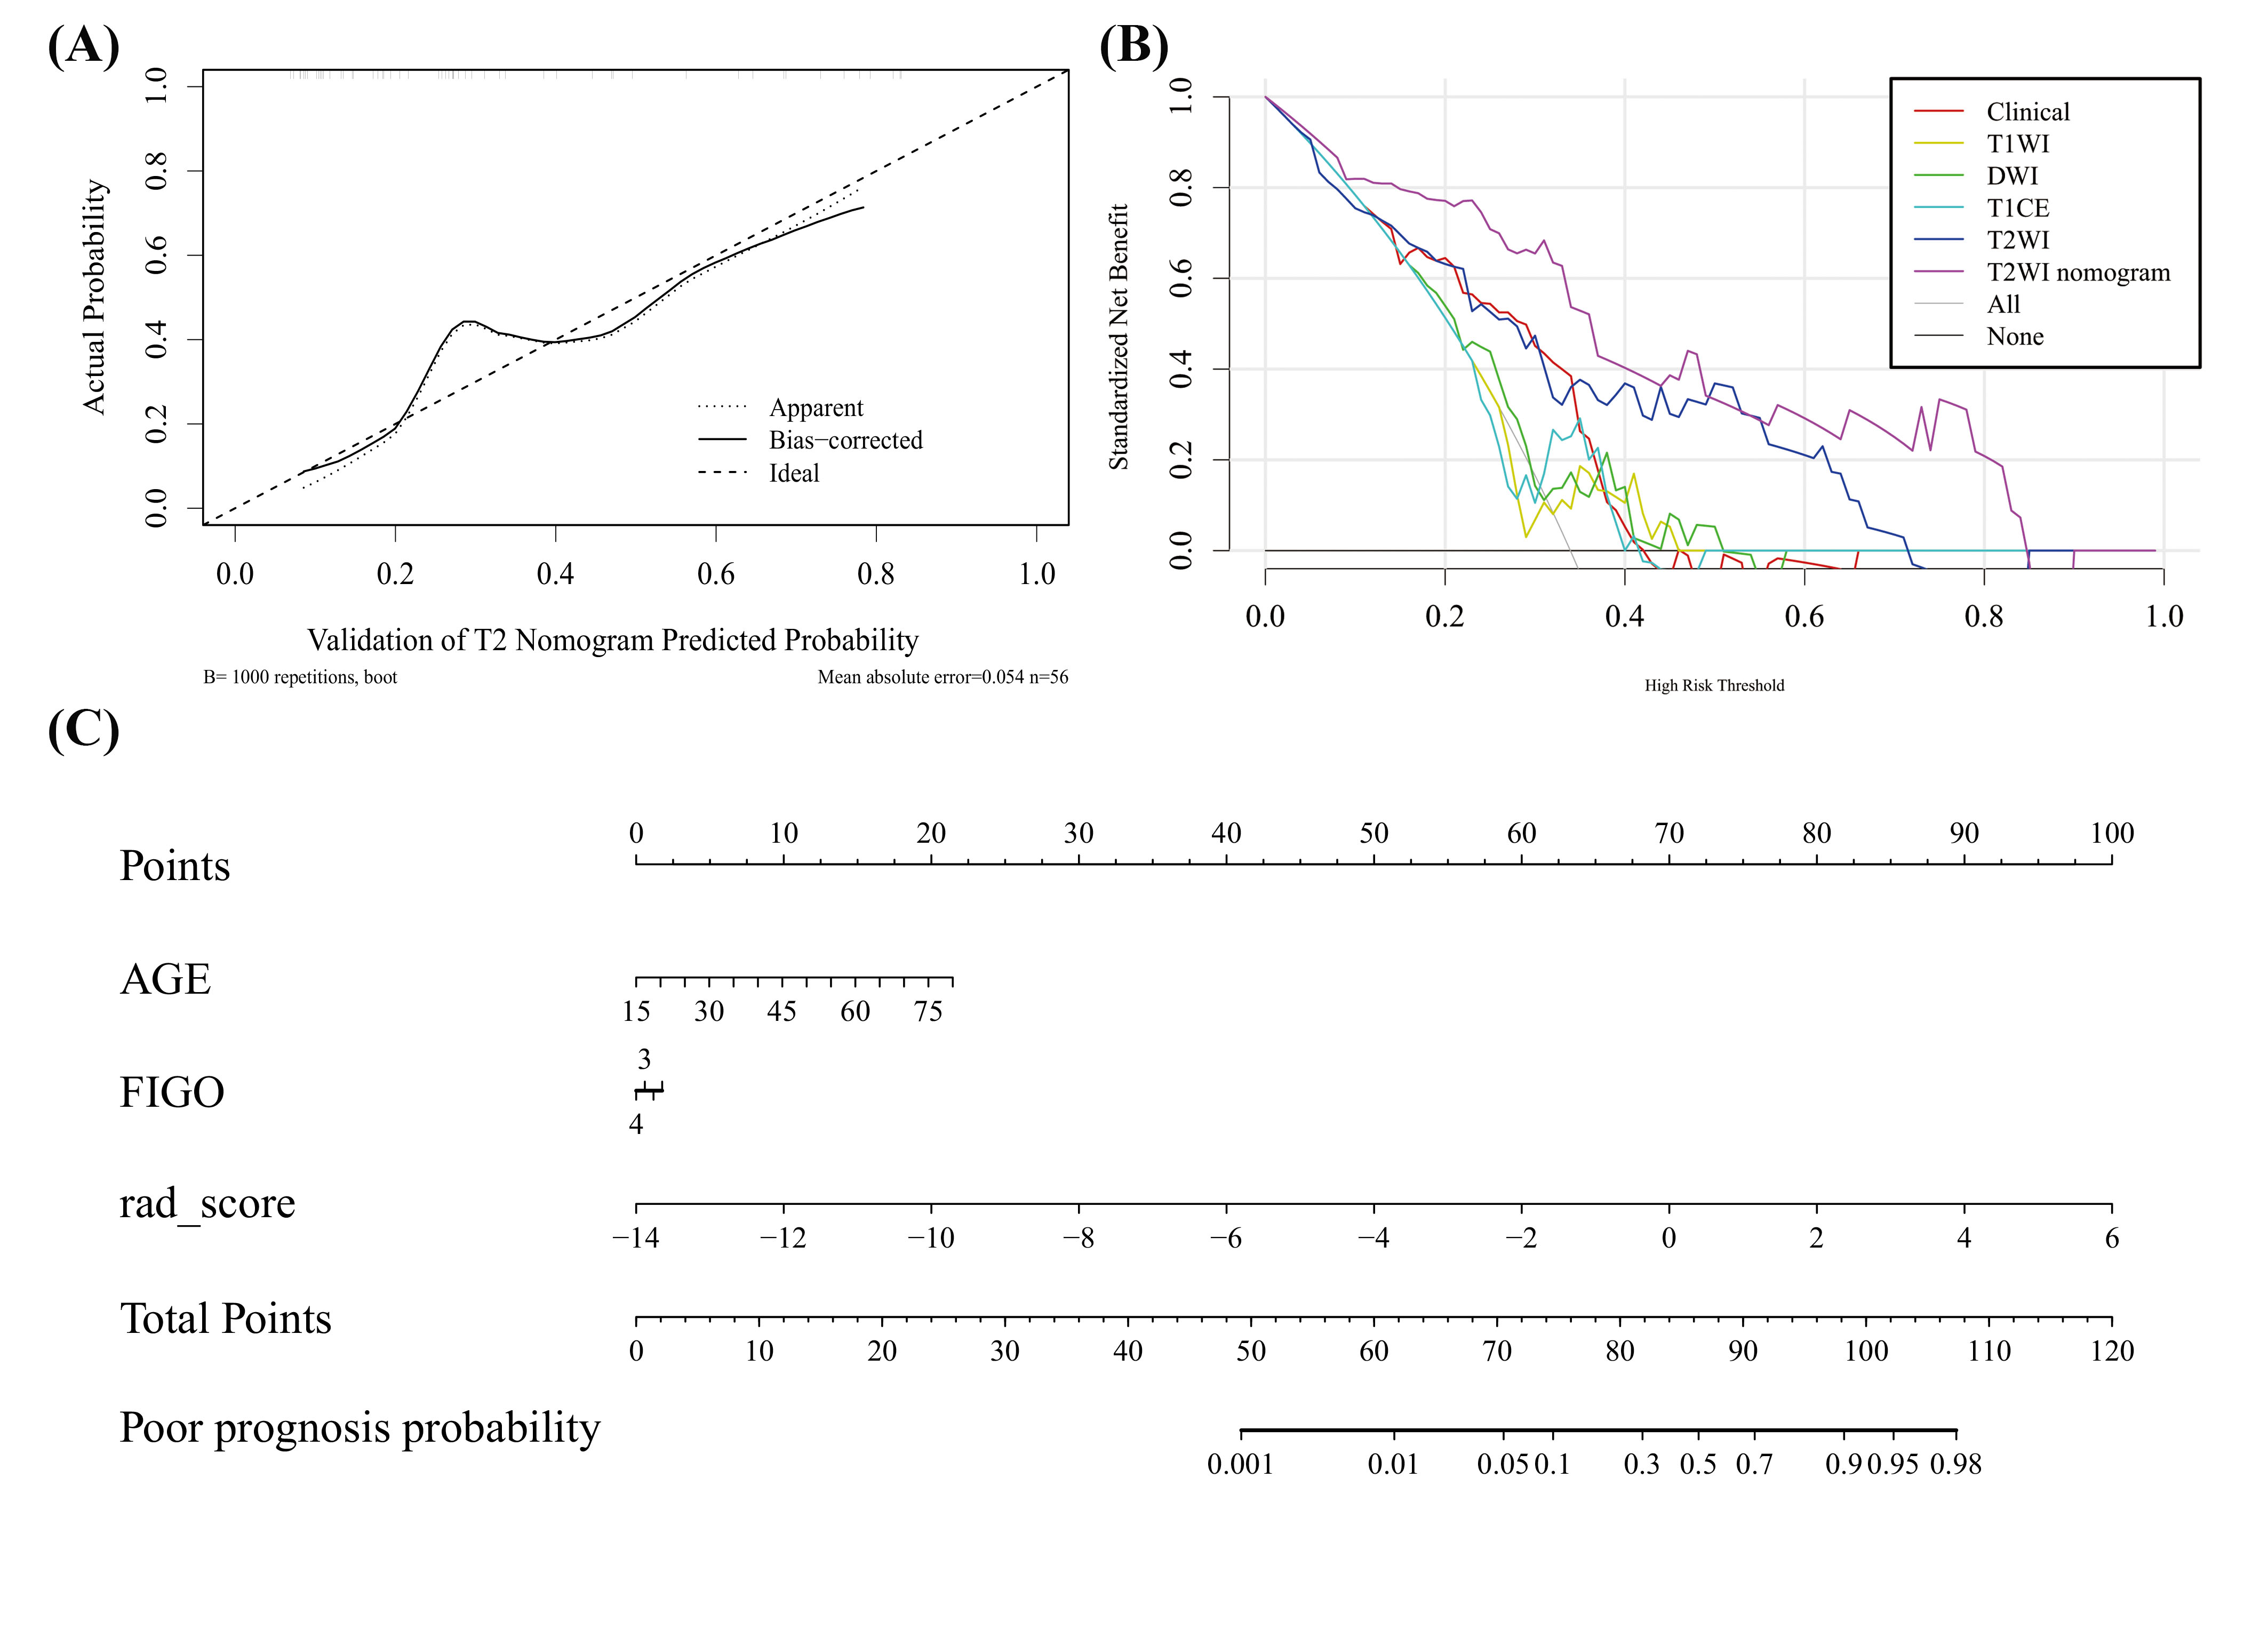
The final nomogram was developed with the clinical characteristics (age, ki67, and FIGO stage) and radiomics score (rad-score) calculated by the linear combination of the selected features.
We used an open-source software FeatureExplorer7 to implement feature extraction and model building. In the backend, FeatureExplorer uses PyRadiomics (version 3.0)8 and scikit-learn (version 1.0.1) for feature extraction, and machine learning model building, respectively.
Results
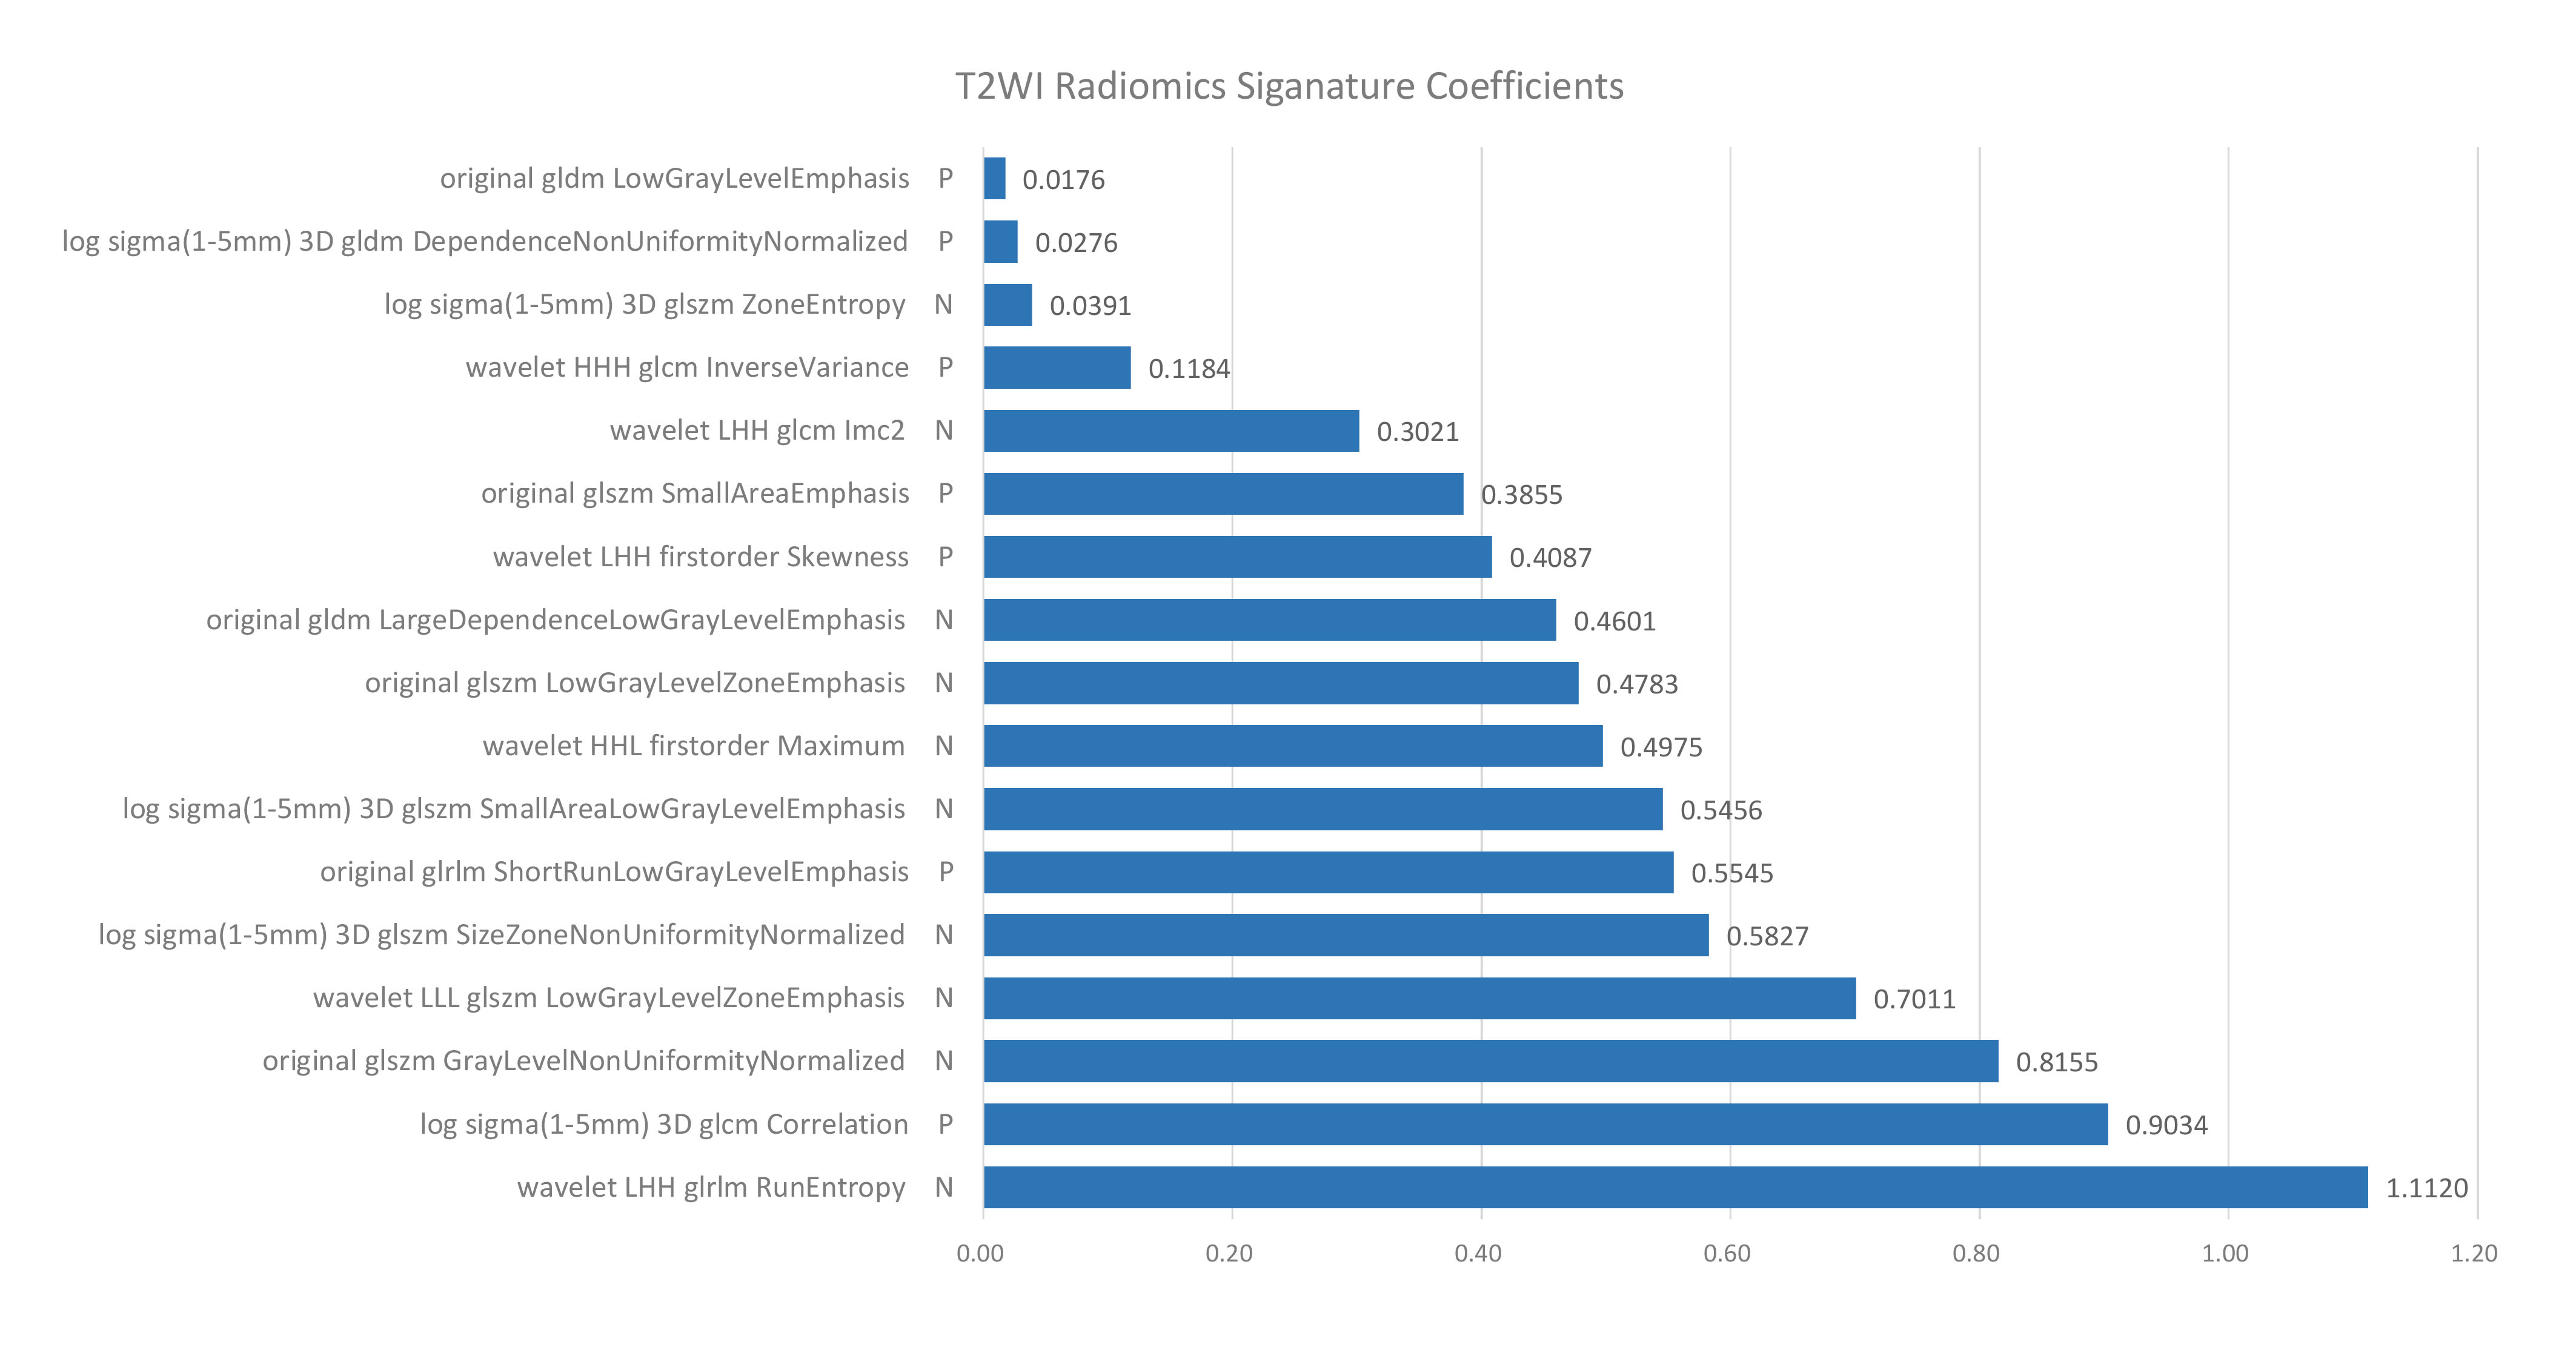
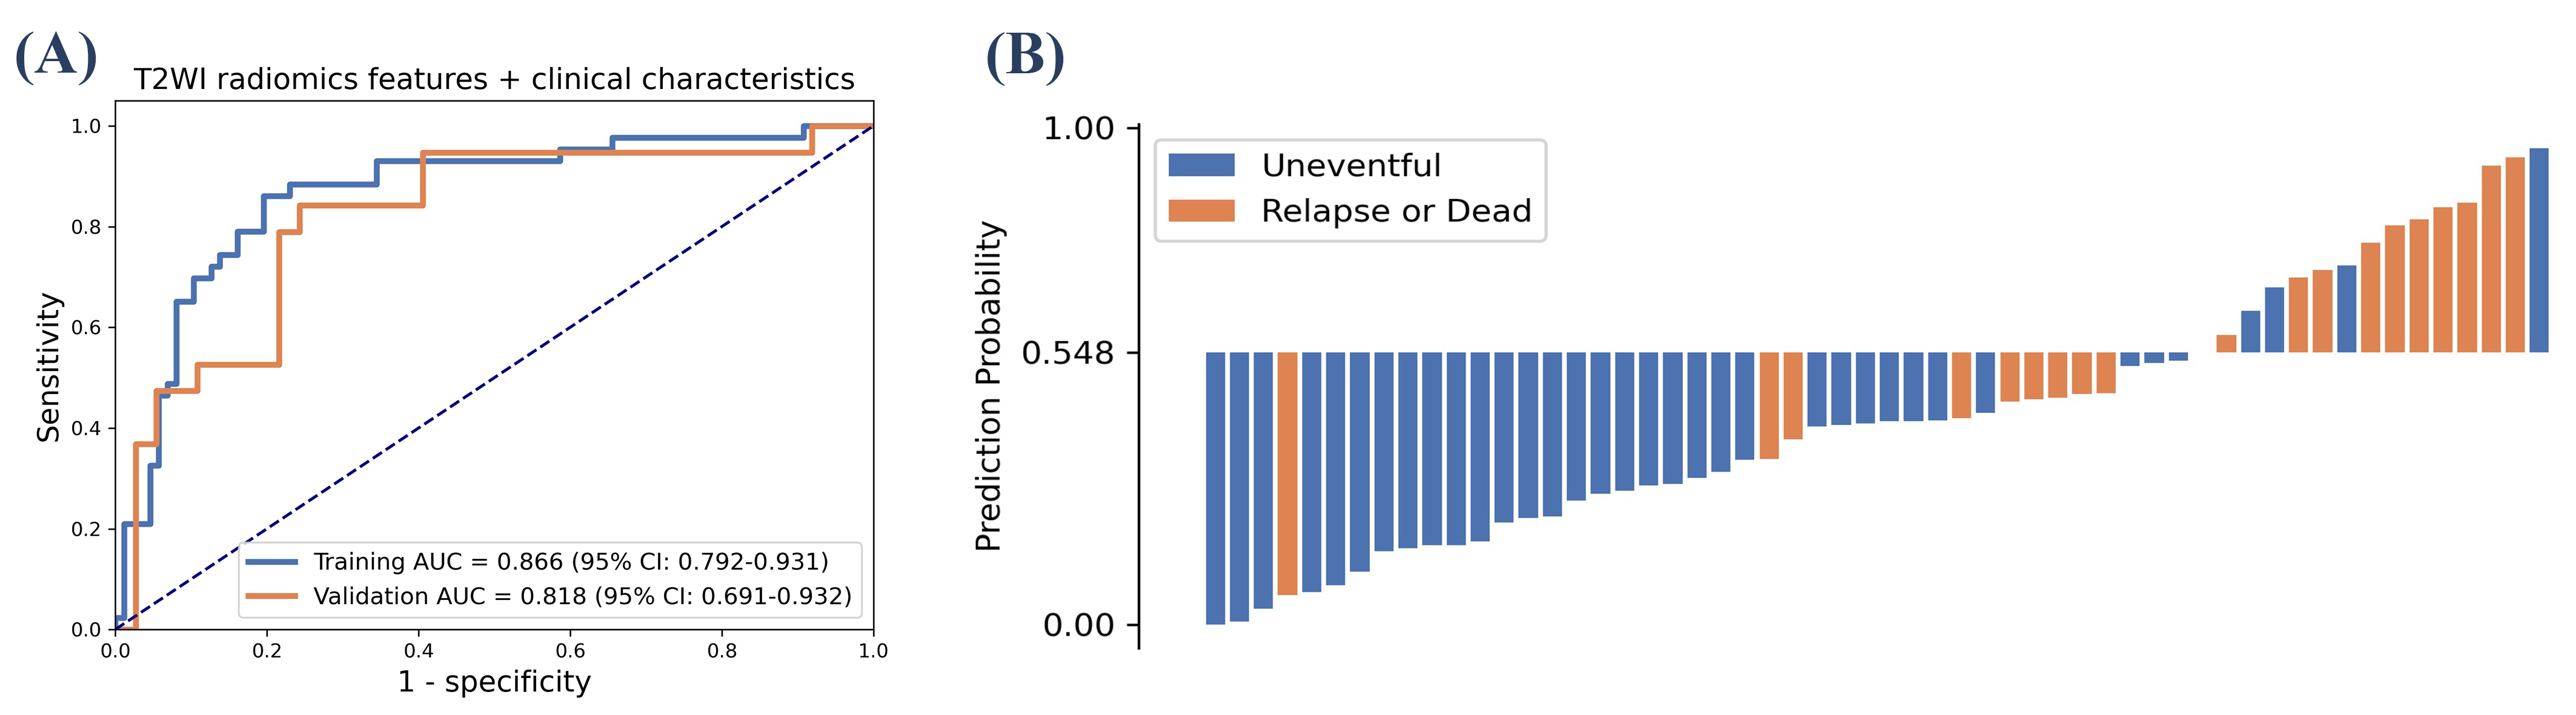
Among all radiomics models, T2W-based model achieved the best performance, with an AUC of 0.771 over the validation cohort (Table 1). The model used SVM with a linear kernel as the classifier and used 17 radiomics features whose corresponding coefficients (Figure 2) were used to calculated the rad-score. Clinical signature using age and FIGO stage achieved a validation AUC of 0.685. The final T2W radiomic-clinical nomogram perform best with a validation AUC of 0.818. The ROC curves of T2W radiomic-clinical nomogram were shown in Figure 3. DCA also indicates that the net benefit of the T2W radiomic-clinical nomogram is the best when the threshold is within the range between 0.1 to 0.8 (Figure 4).Discussion
Ovarian cancer is the most lethally cancer in gynecologic tumors. The well-known established criteria on MR mainly include morphological signs (septa, components, size, etc.) to discriminate malignant tumors from benign ones; however, it is difficult to categorize EOC. And researches focusing on the outcome prediction is alarmingly limited. In this study, we tried to extract the preoperative MR-based radiomic signatures to predict the prognosis noninvasively. The selected texture features with higher weights, indicate high heterogeneity of the tumor body may indicate a poor prognosis. Among all MR sequences, T2W signature achieved the best discrimination, which may be attributed to its good contrast of different soft tissue. Clinical features age and FIGO were also important clinical characteristic for ovarian cancer. Therefore, the nomogram combining T2W-based signatures and the clinical features was constructed and yielded the highest accuracy in the validation cohort. However, this is a retrospective study in a single center with relatively small studied sample and the treatment of all enrolled patients varied, which limit the final follow-up results.Conclusion
In a conclusion, our present results declared that MR-based radiomics analysis showed the high accuracy in prognostic estimation for EOC patients and could help to predict therapeutic outcome prior to treatment.Acknowledgements
This project is supported by National Natural Science Foundation of China (61731009).References
1. Prahm, K. P. et al. The prognostic value of dividing epithelial ovarian cancer into type I and type II tumors based on pathologic characteristics. Gynecologic Oncology. 2015;136(2):205-211.
2. Richardson, D. L. et al. Paclitaxel With and Without Pazopanib for Persistent or Recurrent Ovarian Cancer A Randomized Clinical Trial. Jama Oncology. 2018; 4(2):196-202.
3. Marth, C., Reimer, D. & Zeimet, A. G. Front-line therapy of advanced epithelial ovarian cancer: standard treatment. Annals of Oncology. 2017;28:36-39.
4. Bowtell, D. D. et al. Rethinking ovarian cancer II: reducing mortality from high-grade serous ovarian cancer. Nature Reviews Cancer. 2015;15(11):668-679.
5. Oliver, K. E. et al. An evaluation of progression free survival and overall survival of ovarian cancer patients with clear cell carcinoma versus serous carcinoma treated with platinum therapy: An NRG Oncology/Gynecologic Oncology Group experience. Gynecologic Oncology. 2017;147(2):243-249.
6. Pan, S. S. et al. A Nomogram Combined Radiomic and Semantic Features as Imaging Biomarker for Classification of Ovarian Cystadenomas. Frontiers in Oncology. 2020.
7. Song, Y. et al. FeAture Explorer (FAE): A tool for developing and comparing radiomics models. Plos One. 2020;15(8).
8. Van Griethuysen, J. J. M., Fedorov, A., Parmar, C., Hosny, A., Aucoin, N., Narayan, V., Beets-Tan, R. G. H., Fillon-Robin, J. C., Pieper, S., Aerts, H. J. W. L. Computational Radiomics System to Decode the Radiographic Phenotype. Cancer Research. 2017;77(21):e104–e107.
Figures