3693
Differentiation between benign and malignant breast masses using 3D amide proton transfer weighted imaging and dynamic contrast-enhanced MRI1Department of Magnetic Resonance Imaging, The First Affiliated Hospital of Zhengzhou University, Zhengzhou, China, 2Philips Healthcare, Beijing, China
Synopsis
This study evaluated the diagnostic value of dynamic contrast-enhanced MRI (DCE-MRI) combined with 3D amide proton transfer weighted imaging (APTWI) for differentiation between benign and malignant breast masses. Results indicated the quantitative MTRasym(3.5 ppm) value calculated by APTWI was significantly different between benign and malignant lesions, and the combination of APTWI and DCE-MRI improves the diagnostic performance for discriminating benign and malignant breast masses, especially category 4 masses.
Introduction
Magnetic resonance imaging is currently based on morphological, diffusion weighted imaging and dynamitic contrast-enhanced MRI (DCE-MRI) investigations for breast lesion detection and characterization1. DCE-MRI is a sensitive tool for the detection of breast cancer, however, with a relatively low specificity2-3. So it may result in unnecessary biopsies, which can increase healthcare costs and patient anxiety further4. Therefore, there is a strong demand for complementary MRI technique to increase the specificity of breast MR examinations. Amide proton transfer-weighted imaging (APTWI) is a noninvasive molecular imaging technique which can measure the concentration of free proteins and polypeptides in tissues based on the chemical exchange between amide protons and water protons, and it may reflect the microscopic information of diseased tissues and has the potential to evaluate many biological factors for breast cancer5-6. Therefore, the purpose of this study was to evaluate the diagnostic value of the combination of DCE-MRI and APTWI for differentiation between breast benign and malignant masses.Materials and Methods
Breast MRI was performed using a 3.0T system (Ingenia CX, Philips Healthcare, Best, the Nertherland) with an 7-channel phased-array breast surface coil. Detailed parameters for all sequences used listed in Table 1. 140 patients who showed breast masses on DCE-MRI were analyzed, including 140 lesions (75 malignant and 65 benign lesions).All breast benign and malignant masses were differentiated using the following three diagnostic methods: 1. the DCE-MRI type, in which we used only the DCE-MRI sequence to determine the category of mass lesions based on BI-RADS. Two radiologists each independently classified all enrolled breast mass lesions as BI-RADS category 3, 4, or 5 based on the morphologic features and time-signal intensity curve patterns7-9. Category 4 and 5 mass lesions were classified as malignant and category 3 mass lesions were classified as benign. 2. the APTWI type, where all mass lesions were diagnosed as either benign or malignant by using the MTRasym(3.5 ppm) value from the APTWI only. The ROIs for MTRasym(3.5 ppm) measurements were drawn manually on T2WI or DCE-MRI to encompass as much of the abnormality as possible while staying within the border of the lesion (Figs 1-2). 3. the DCE-MRI+APTWI type, which used the same images as for the APTWI type; however, in contrast to the DCE-MRI type and APTWI type, lesions were diagnosed as either benign or malignant based on the results of both the DCE-MRI and APTWI data. Using this method, if the sum of the BI-RADS category 3–5 and the APTWI type score (0, benign; 1, malignant) was 5 or 6, the lesion was defined as malignant; if it was 4 or less, benign.
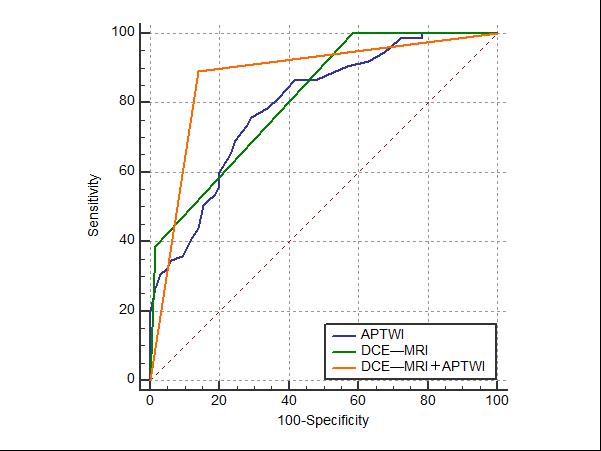
The MTRasym(3.5 ppm) value caculated by APTWI were compared between the benign and malignant lesions using the Mann–Whitney U-test. The effectiveness of the quantitative evaluation value obtained by APTWI for differentiating between benign and malignant lesions was evaluated by receiver-operating characteristic (ROC) curve analysis. The optimal thresholds for distinguishing between benign and malignant lesions were chosen at the highest possible sensitivity and specificity on the ROC curve. The diagnostic performance of three methods was assessed by calculating the sensitivity, specificity, positive predictive value (PPV), negative predictive value (NPV), and accuracy. All statistical analyses were performed using SPSS 21.0.0 and MedCalc 15.0.7 statistical softwares. P < 0.05 was considered to indicate a statistically significant difference.
Results
Both DCE-MRI and APTWI can be used to distinguish benign and malignant breast masses. And the sensitivity, specificity and accuracy of DCE-MRI were 100.0%, 41.5% and 72.9%, respectively (Table 2). Taking the MTRasym(3.5 ppm)(2.8%) as the ROC optimal cut-off point of APTWI, the sensitivity, specificity and accuracy were 76.0%, 70.8% and 73.6%, respectively. The AUC for all enrolled breast masses detected by the DCE-MRI + APTWI type (0.877) was significantly higher than that for either the DCE-MRI type (0.813, P < 0.05) or APTWI type (0.796, P < 0.05), and the sensitivity, specificity and accuracy were 89.3%, 86.1% and 87.9% respectively. In 83 category 4 lesions, the sensitivity, specificity, PPV, NPV, and accuracy of the MTRasym(3.5 ppm) with an optimal cut-off value of 2.8% was 80.4%, 78.4%, 82.2%, 76.3% and 79.5%, respectively (bold type in Table 4). The AUC for category 4 masses detected by DCE-MRI + APTWI type (0.805) was significantly greater than that for those detected by DCE-MRI type (0.500, P < 0.05).Discussion and conclusion
In this study, the DCE-MRI type method was observed to be more sensitive than the APTWI or DCE-MRI+APTWI type methods, while the specificity, positive predictive value, accuracy and AUC obtained by DCE-MRI+APTWI are significantly higher than DCE-MRI or APTWI for discrimination benign and malignant breast masses. So we speculate that the MTRasym(3.5ppm) value calculated by APTWI may be related to the physiological characteristics and serve as a complement to the information obtained by DCE-MRI in differential diagnosis of breast masses10. When we further analyze the diagnostic performance of APTWI in differentiation between benign and malignant breast masses classified by BI-RADS, the AUC of DCE-MRI+APTWI on the category 4 is significantly greater than that of DCE-MRI. In conclusion, the combination of APTWI and DCE-MRI significantly improves the diagnostic performance of DCE-MRI in differentiation between benign and malignant breast masses, especially category 4 masses.Acknowledgements
We thank the National Natural Science Foundation of China and the Henan Medical Science and Technology Research Program.References
1. Zaric O,Farr A,Poblador Rodriguez E,et al. 7T CEST MRI: A potential imaging tool for the assessment of tumor grade and cell proliferation in breast cancer [J]. Magnetic resonance imaging, 2019,59:77-87.
2. Partridge SC,Mullins CD,Kurland BF,et al. Apparent diffusion coefficient values for discriminating benign and malignant breast MRI lesions: effects of lesion type and size [J]. AJR American journal of roentgenology, 2010,194(6):1664-1673.
3. Orel SG,Schnall MD. MR imaging of the breast for the detection, diagnosis, and staging of breast cancer [J]. Radiology, 2001,220(1):13-30.
4. Matsuda M,Tsuda T,Ebihara R,et al. Enhanced Masses on Contrast-Enhanced Breast: Differentiation Using a Combination of Dynamic Contrast-Enhanced MRI and Quantitative Evaluation with Synthetic MRI [J]. Journal of magnetic resonance imaging : JMRI, 2021,53(2):381-391.
5. Zhou J,Heo HY,Knutsson L,et al. APT-weighted MRI: Techniques, current neuro applications, and challenging issues [J]. Journal of magnetic resonance imaging : JMRI, 2019,50(2):347-364.
6. Meng N,Wang XJ,Sun J,et al. Comparative Study of Amide Proton Transfer-Weighted Imaging and Intravoxel Incoherent Motion Imaging in Breast Cancer Diagnosis and Evaluation [J]. Journal of magnetic resonance imaging : JMRI, 2020,52(4):1175-1186.
7. Kim KW,Kuzmiak CM,Kim YJ,et al. Diagnostic Usefulness of Combination of Diffusion-weighted Imaging and T2WI, Including Apparent Diffusion Coefficient in Breast Lesions: Assessment of Histologic Grade [J]. Academic radiology, 2018,25(5):643-652.
8. Goto M,Ito H,Akazawa K,et al. Diagnosis of breast tumors by contrast-enhanced MR imaging: comparison between the diagnostic performance of dynamic enhancement patterns and morphologic features [J]. Journal of magnetic resonance imaging : JMRI, 2007,25(1):104-112.
9. Tozaki M,Igarashi T,Matsushima S,et al. High-spatial-resolution MR imaging of focal breast masses: interpretation model based on kinetic and morphological parameters [J]. Radiation medicine, 2005,23(1):43-50.
10. Klomp DW,Dula AN,Arlinghaus LR,et al. Amide proton transfer imaging of the human breast at 7T: development and reproducibility [J]. NMR in biomedicine, 2013,26(10):1271-1277.
Figures
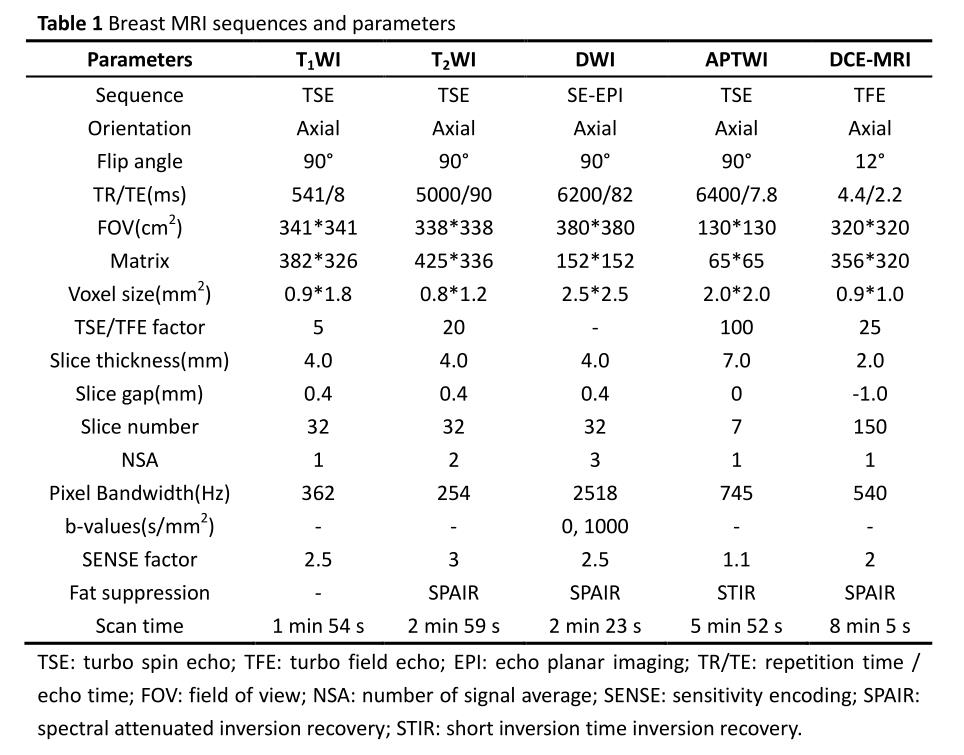
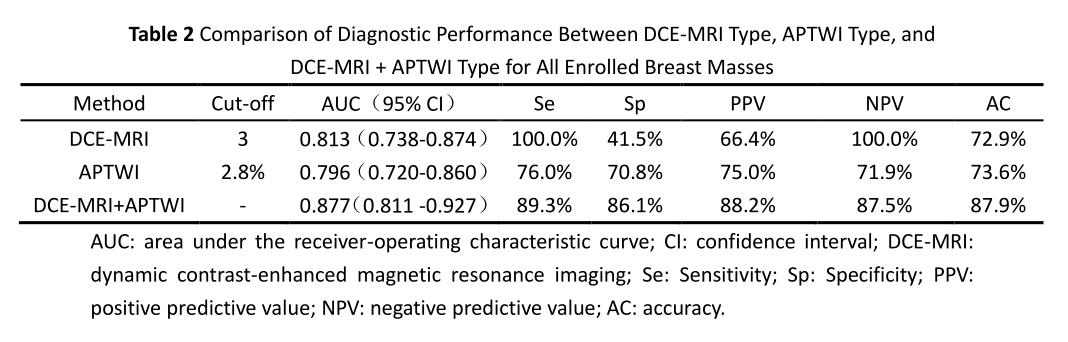
Table 2 Comparison of Diagnostic Performance Between DCE-MRI Type, APTWI Type, and DCE-MRI + APTWI Type for All Enrolled Breast Masses
AUC: area under the receiver-operating characteristic curve; CI: confidence interval; DCE-MRI: dynamic contrast-enhanced magnetic resonance imaging; Se: Sensitivity; Sp: Specificity; PPV: positive predictive value; NPV: negative predictive value; AC: accuracy
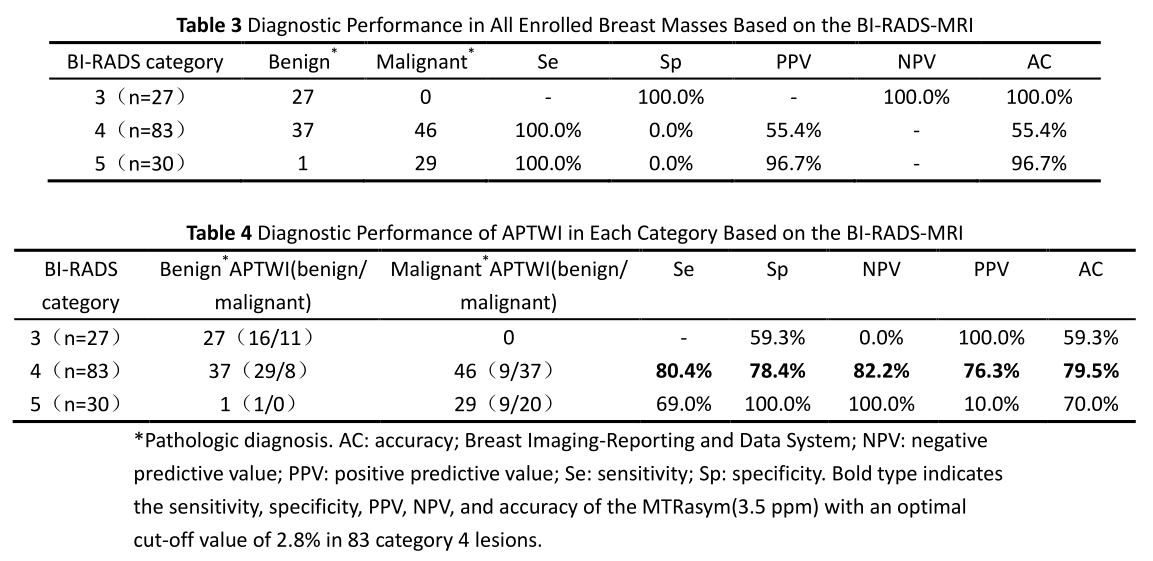
Table 3 Diagnostic Performance in All Enrolled Breast Masses Based on the BI-RADS-MRI
Table 4 Diagnostic Performance of APTWI in Each Category Based on the BI-RADS-MRI
*Pathologic diagnosis. AC: accuracy; Breast Imaging-Reporting and Data System; NPV: negative predictive value; PPV: positive predictive value; Se: sensitivity; Sp: specificity. Bold type indicates the sensitivity, specificity, PPV, NPV, and accuracy of the MTRasym(3.5 ppm) with an optimal cut-off value of 2.8% in 83 category 4 lesions.
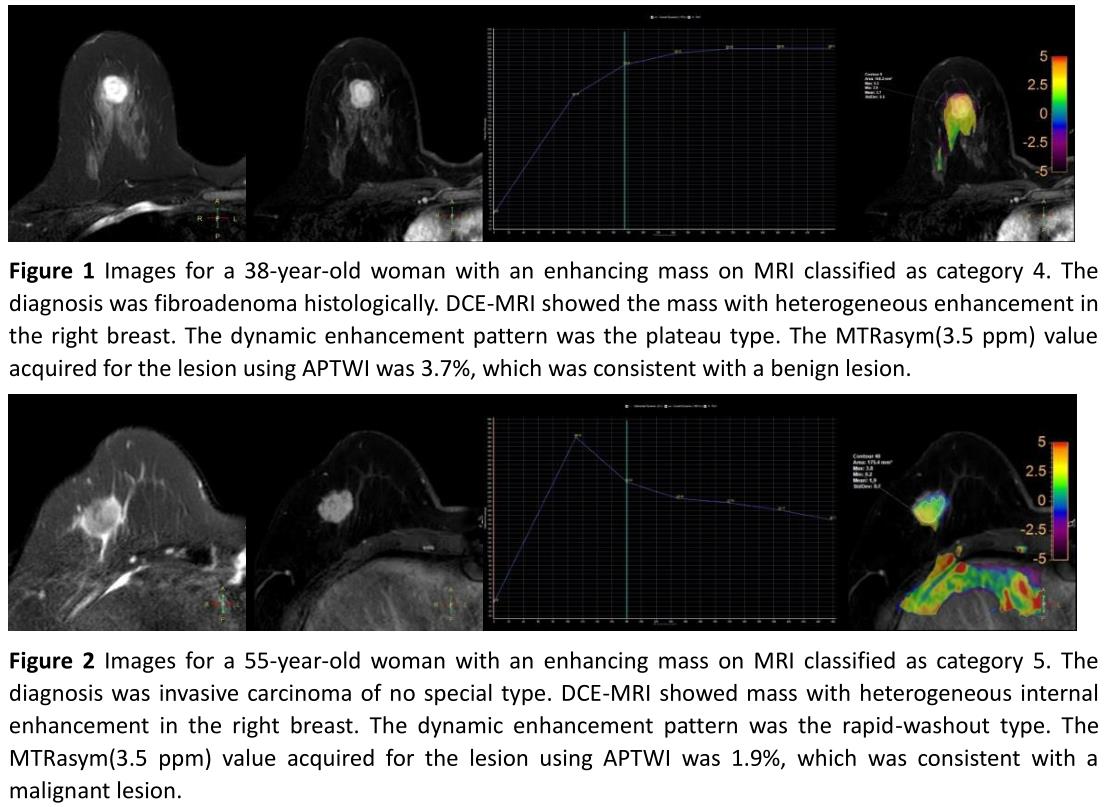
Figure 1 a 38-year-old woman, fibroadenoma in the right breast. DCE-MRI showed a mass with heterogeneous enhancement which was classified as category 4. The dynamic enhancement pattern was the plateau type. The MTRasym(3.5 ppm) value was 3.7%, which was consistent with a benign lesion.
Figure 2 a 55-year-old woman, invasive carcinoma in the right breast. DCE-MRI showed a mass with heterogeneous enhancement which was classified as category 5. The dynamic enhancement pattern was the rapid-washout type. The MTRasym(3.5 ppm) value was 1.9%, which was consistent with a malignant lesion.