3691
Effects of oscillating frequency and SNR on quantifying microstructural properties in breast tumor using oscillating gradient diffusion MRI1Key Laboratory for Biomedical Engineering of Ministry of Education, Department of Biomedical Engineering, College of Biomedical Engineering & Instrument Science, Zhejiang University, Hangzhou, China, 2Department of Radiology, Chongqing University Cancer Hospital, Chongqing, China, 3MR Collaboration, Siemens Healthineers Ltd., Shanghai, China
Synopsis
The oscillating frequency and SNR are important for accurate microstructural mapping in diffusion-time-dependent diffusion MRI, which however, are limited on clinical scanners. This study demonstrated that the dMRI acquisition protocol with frequency up to 50 Hz achieved significant higher accuracy than that with 33Hz, based on 1) Monte-carlo simulation, 2) clinical data on 37 breast tumor patients, and 3) correlation with histological data. Also, for the first time, we demonstrated the feasibility of oscillating gradient dMRI-based microstructural mapping in distinguishing breast tumor status clinically.
Introduction
Simulation and preclinical studies of diffusion-time (td) dependent diffusion MRI (dMRI) [1,2] using oscillating and pulsed gradients spin-echo (OGSE and PGSE) sequences demonstrate its unique advantages in probing tumor microstructure [3-6], and the clinical feasibility in tumor applications was previously explored [7-11]. Several tumor microstructural indices could be fitted with biophysical models [3,12,13], which however, requires relatively high oscillating frequency and high SNR. The feasibility of microstructural mapping in clinical application and its requirement on hardware setting and acquisition protocol remains unknown.This study investigated the effects oscillating frequency and SNR on the accuracy of microstructural mapping with comprehensive experiments, including 1) Monte-carlo simulation, 2) clinical data from breast tumor patients, and 3) correlation with histological data.
Methods
Thirty-seven patients with Breast Imaging Reporting and Data System (BI-RADS) 4 or 5 category lesions (aged 52±8.8 years) were enrolled with IRB approval and consent. Pathological biomarkers including estrogen receptor (ER), progesterone receptor (PR), and human epidermal growth factor receptor 2 (HER2) status and presence of lymph node (LN) invasion was obtained for every patient and the status was divided into positive (+) and negative (-).The dMRI data were acquired on a 3T Siemens scanner (MAGNETOM Prisma, Siemens Healthcare, Erlangen, Germany, maximum gradient amplitude = 80mT/m) using self-developed oscillating and pulsed gradient spin-echo (OGSE and PGSE) sequences. Two sets of parameters were implemented with the same diffusion directions = 6, FOV = 260×260 mm2, in-plane resolution = 2.6×2.6 mm2, slice thickness=4 mm, slice number=10, and PGSE of δ/△ = 10/30ms (td,eff=26.7ms, b=0.5/1/1.5ms/µm2); but different oscillating frequencies at (i) 50Hz (td,eff=5ms, b=0.25/0.5ms/µm2) and 25Hz (td,eff=10ms, b=0.5/1/1.5ms/µm2), and (ii) 33Hz (td,eff=7.5ms, b=0.25/0.5ms/µm2) and 17Hz (td,eff=15ms, b=0.5/1/1.5ms/µm2). The total acquisition was approximately 4.5 min. Routine T1-weighted imaging and diffusion-weighted imaging (DWI) were acquired.
Regions of interest (ROIs) were manually delineated in cancerous tissues based on DWI and T1 images. td-dMRI data were fitted with an limited spectrally edited diffusion IMPULSED model [3] to obtain microstructural properties including cell diameter (d), intracellular fraction (fin), and extracellular diffusivity (Dex) using nonlinear least square curve fitting in MATLAB while fixing intracellular diffusivity (Din)=1.2µm2/ms and β=0 to enhance fitting stability [3]. Apparent diffusion coefficient (ADC) was also calculated at each td. The ROI-averaged parameters were compared between the different statuses of biomarkers with Welch's t-tests. For pathological validation, six H&E stained whole-slide images (WSIs) were selected. The nucleus in each WSI was segmented via a pre-trained Conditional Generative Adversarial Networks (cGAN) [15]. The volume-weighted diameter, and cell fraction were calculated as $$$d_{pathology}=\sum_{n} d_{n}^{4}/\sum_{n} d_{n}^{3}$$$ and $$$f_{in,pathology}=\left(\sum_{n} A_{cell,n}/A_{tissue}\right)^{3/2}$$$, where dn, Acell,n represents the cell size and area of the nth cell, Atissue repersents the area of tissure.
Monte-Carlo simulations were performed in Camino [14] and cells were modeled as tightly packed impermeable spheres with d=10um, fin=0.3, Din=1.2μm2/ms and Dex=2μm2/ms. Gaussian white noise with different SNR(20,50,100) was added using MATLAB.
Results
SimulationFigure 1 shows the error between fitted microstructural properties based on simulated signal and ground truth at different SNR levels. The fitting errors in d and fin considerably increased at SNR=20 and the accuracy was improved at SNR=50/100. The higher-frequency group better estimated d while the lower frequency group better estimated fin.
Breast tumor patients
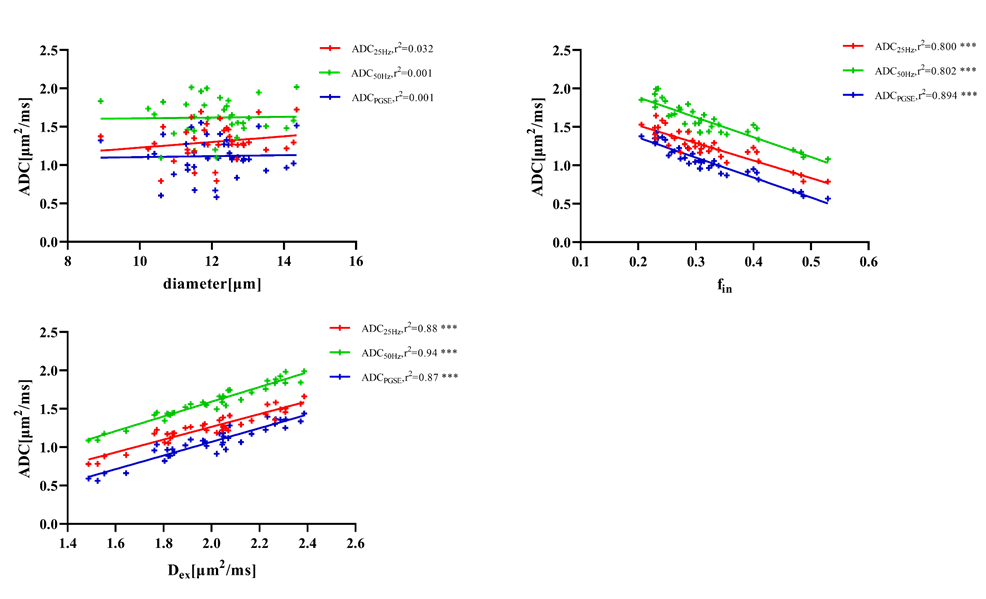
Figure 2 shows maps of ADC and microstructural properties fitted with the IMPULSED model in six representative cases. We observed higher fin and lower ADC in ER(+) and PR(+) cases and larger d in HER2(+) and LN(+) cases. For fitted properties in the high-frequency group, d was significantly higher in HER2(+) and LN(+) cases compared to negative cases, whereas Dex and ADC were significantly lower in ER(+) or PR(+) cases compared to negative cases (Figure 4). In the lower frequency group, there was no significant difference between ER,PR,HER2,and LN status in terms of d; whereas fin was significantly higher and Dex and ADC were significantly lower in PR(+) cases. Note that we found strong negative and positive correlations between fin –ADC and between Dex –ADC, respectively, in both frequency groups (Figure 5). ROC analysis revealed that d achieved the highest area-under-the-curve (AUC) values of 0.69 and 0.72 in differentiating HER-2 and LN status, while ADC50Hz performed best in differentiating ER and PR status with AUC of 0.71 and 0.77, respectively.
Pathological validation
Automated segmentation of H&E provided quantifiable cell parameters (Figure 3a). We found a significant correlation (r=0.87,p=0.02) between dfit and dpathology in the high-frequency group (Figure3b) but no correlation (r=0.08,p=0.88) in the low-frequency group (Figure3c). No significant correlation existed between fin,fit and fin,pathology.
Discussion and Conclusion
This study demonstrated that the dMRI acquisition high-oscillating-frequency (50 Hz) outperformed that with 33Hz and also important of sufficient SNR for accurate microstructural mapping, indicating the importance of using high gradient performance scanner in time-dependent dMRI. Moreover, for the first time, we demonstrated the feasibility of oscillating gradient dMRI-based microstructural mapping in distinguishing breast tumor status clinically. Results indicate that HER2(+)/HER2(-) and LN(+)/LN(-) can be differentiated using diameter index, in agreement with the increased cell size in HER-2 overexpressing breast tumors [16]. We also determined that ADC was lower in ER and PR positive cases.Acknowledgements
Ministry of Science and Technology of the People’s Republic of China (2018YFE0114600), National Natural Science Foundation of China (61801424, 81971606, 82122032), and Science and Technology Department of Zhejiang Province (202006140)References
1. Stepisnik J. Time-Dependent Self-Diffusion by Nmr Spin-Echo. Physica B 1993;183(4):343-350.
2. Gore JC, Xu JZ, Colvin DC, Yankeelov TE, Parsons EC, Does MD. Characterization of tissue structure at varying length scales using temporal diffusion spectroscopy. Nmr Biomed 2010;23(7):745-756.
3. Jiang XY, Li H, Xie JP, Zhao P, Gore JC, Xu JZ. Quantification of cell size using temporal diffusion spectroscopy. Magn Reson Med 2016;75(3):1076-1085.
4. Reynaud O, Winters KV, Hoang DM, Wadghiri YZ, Novikov DS, Kim SG. Pulsed and oscillating gradient MRI for assessment of cell size and extracellular space (POMACE) in mouse gliomas. Nmr Biomed 2016;29(10):1350-1363.
5. Panagiotaki E, Walker-Samuel S, Siow B, Johnson SP, Rajkumar V, Pedley RB, Lythgoe MF, Alexander DC. Noninvasive Quantification of Solid Tumor Microstructure Using VERDICT MRI. Cancer Res 2014;74(7):1902-1912.
6. Colvin DC, Yankeelov TE, Does MD, Yue Z, Quarles C, Gore JC. New insights into tumor microstructure using temporal diffusion spectroscopy. Cancer Res 2008;68(14):5941-5947.
7. Xu J, Jiang X, Li H, Arlinghaus LR, McKinley ET, Devan SP, Hardy BM, Xie J, Kang H, Chakravarthy AB, Gore JC. Magnetic resonance imaging of mean cell size in human breast tumors. arXiv 2019;arXiv:1905.07818.
8. Lemberskiy G, Rosenkrantz AB, Veraart J, Taneja SS, Novikov DS, Fieremans E. Time-Dependent Diffusion in Prostate Cancer. Invest Radiol 2017;52(7):405-411.
9. Iima M, Kataoka M, Honda M, Ohno AK, Ota R, Ohashi A, Urushibata Y, Feiweier T, Toi M, Togashi K. Time-Varying Diffusion Patterns in Breast Cancer Linked to Prognostic Factors. 2019; Montreal, QC, Canada.
10. Lemberskiy G, Baete S, Novikov D, Fieremans E, Zan E, Hu K, Kim S. Diffusion time-dependence of diffusivity and kurtosis in locally advanced head and neck squamous cell carcinoma before and after chemo-radiation therapy. 2019; Montreal, QC, Canada.
11. Reynaud O. Time-dependent diffusion MRI in cancer: tissue modeling and applications[J]. Frontiers in Physics, 2017, 5: 58.
12. Reynaud O, Winters K V, Hoang D M, et al. Pulsed and oscillating gradient MRI for assessment of cell size and extracellular space (POMACE) in mouse gliomas[J]. NMR in biomedicine, 2016, 29(10): 1350-1363.
13. Panagiotaki E, Walker-Samuel S, Siow B, et al. Noninvasive quantification of solid tumor microstructure using VERDICT MRI[J]. Cancer research, 2014, 74(7): 1902-1912.
14. P. A. Cook, Y. Bai, S. Nedjati-Gilani, K. K. Seunarine, M. G. Hall, G. J. Parker, D. C. Alexander, Camino: Open-Source Diffusion-MRI Reconstruction and Processing, 14th Scientific Meeting of the International Society for Magnetic Resonance in Medicine, Seattle, WA, USA, p. 2759, May 2006.
15. Isola P, Zhu J Y, Zhou T, et al. Image-to-image translation with conditional adversarial networks[C]//Proceedings of the IEEE conference on computer vision and pattern recognition. 2017: 1125-1134.
16. Sastre‐Garau X, Genin P, Rousseau A, et al. Increased cell size and Akt activation in HER‐2/neu‐overexpressing invasive ductal carcinoma of the breast[J]. Histopathology, 2004, 45(2): 142-147
Figures
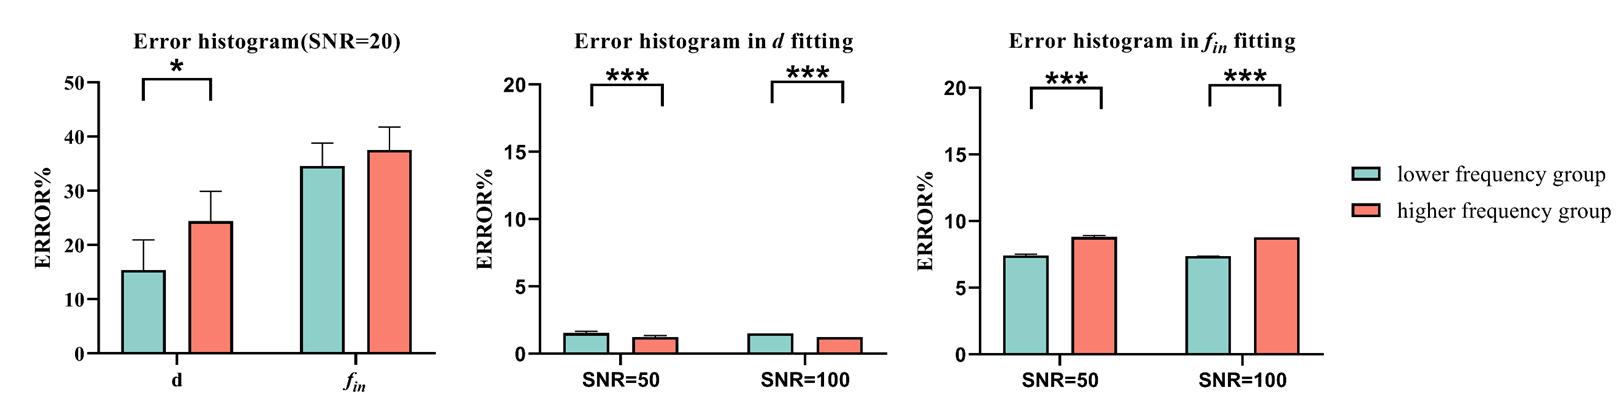
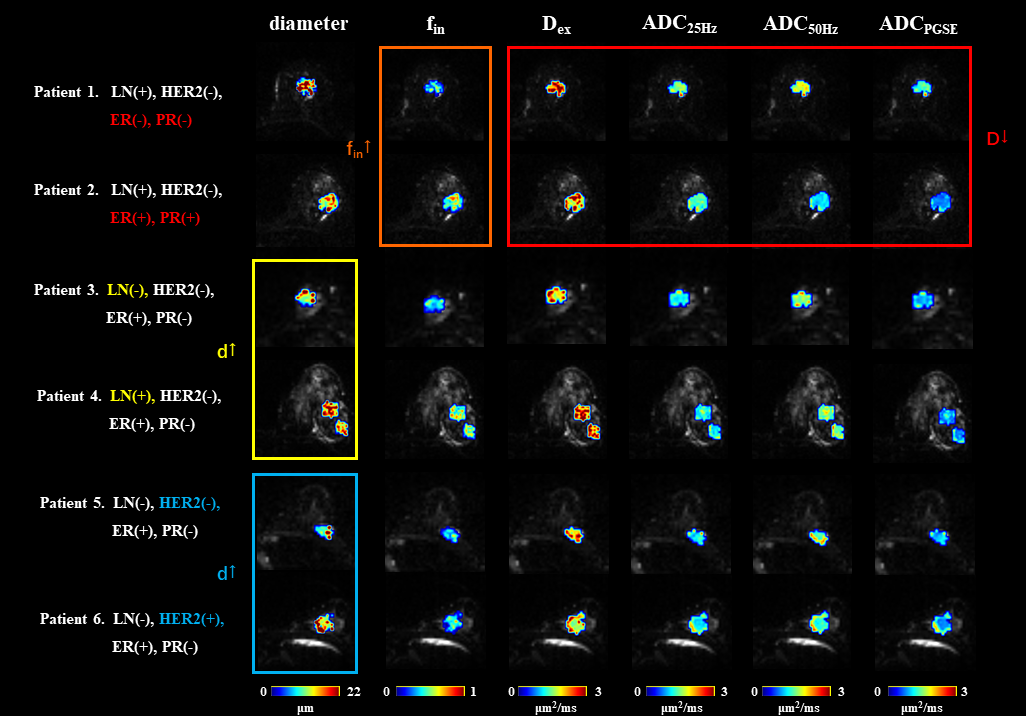
Figure2. Maps of tumor microstructural properties fitted with IMPULSED model and ADC at each diffusion-time. We selected six representative cases with positive and negative status for each of the hormone receptors (pt.1 and pt. 2), LN (pt.3 and pt.4), and HER2 (pt.5 and pt.6).
ADC, apparent diffusion coefficient; ER, estrogen receptor; PR, progesterone receptor; HER, human epidermal growth factor receptor; LN, lymph node; d, diameter; fin, intracellular fraction; Dex, extracellular diffusivity.
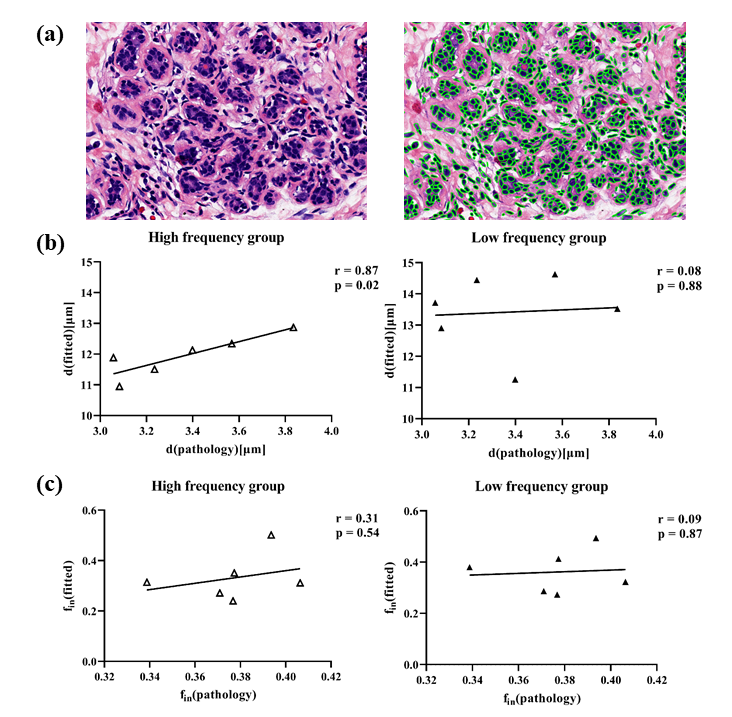
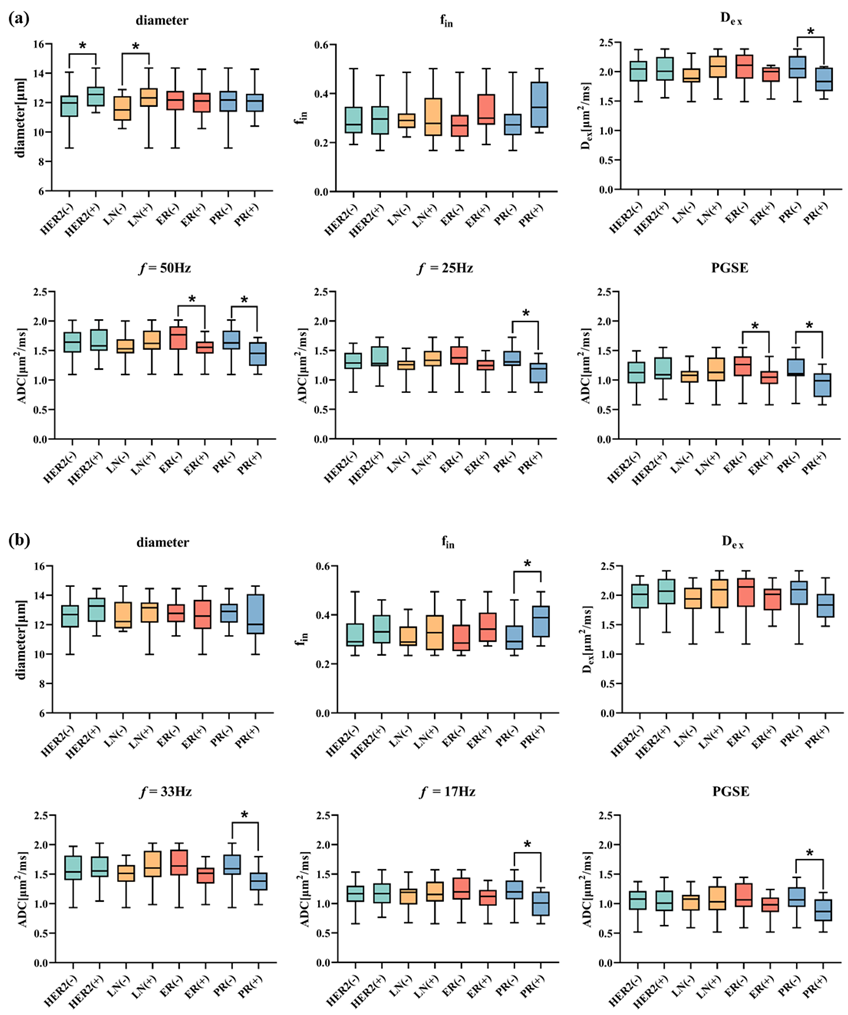
Figure4. Group comparison of microstructural properties between different biomarker statuses. (a) In the higher frequency group, d were significantly higher in HER2(+) and LN(+) cases, whereas Dex and ADC were significantly lower in ER(+) and PR(+) cases. (b) In the lower frequency group, only fin, Dex, and ADC had significant differences in PR(+) and PR(-).
f, frequency; OG, oscillating gradient; PG, pulsed gradient.