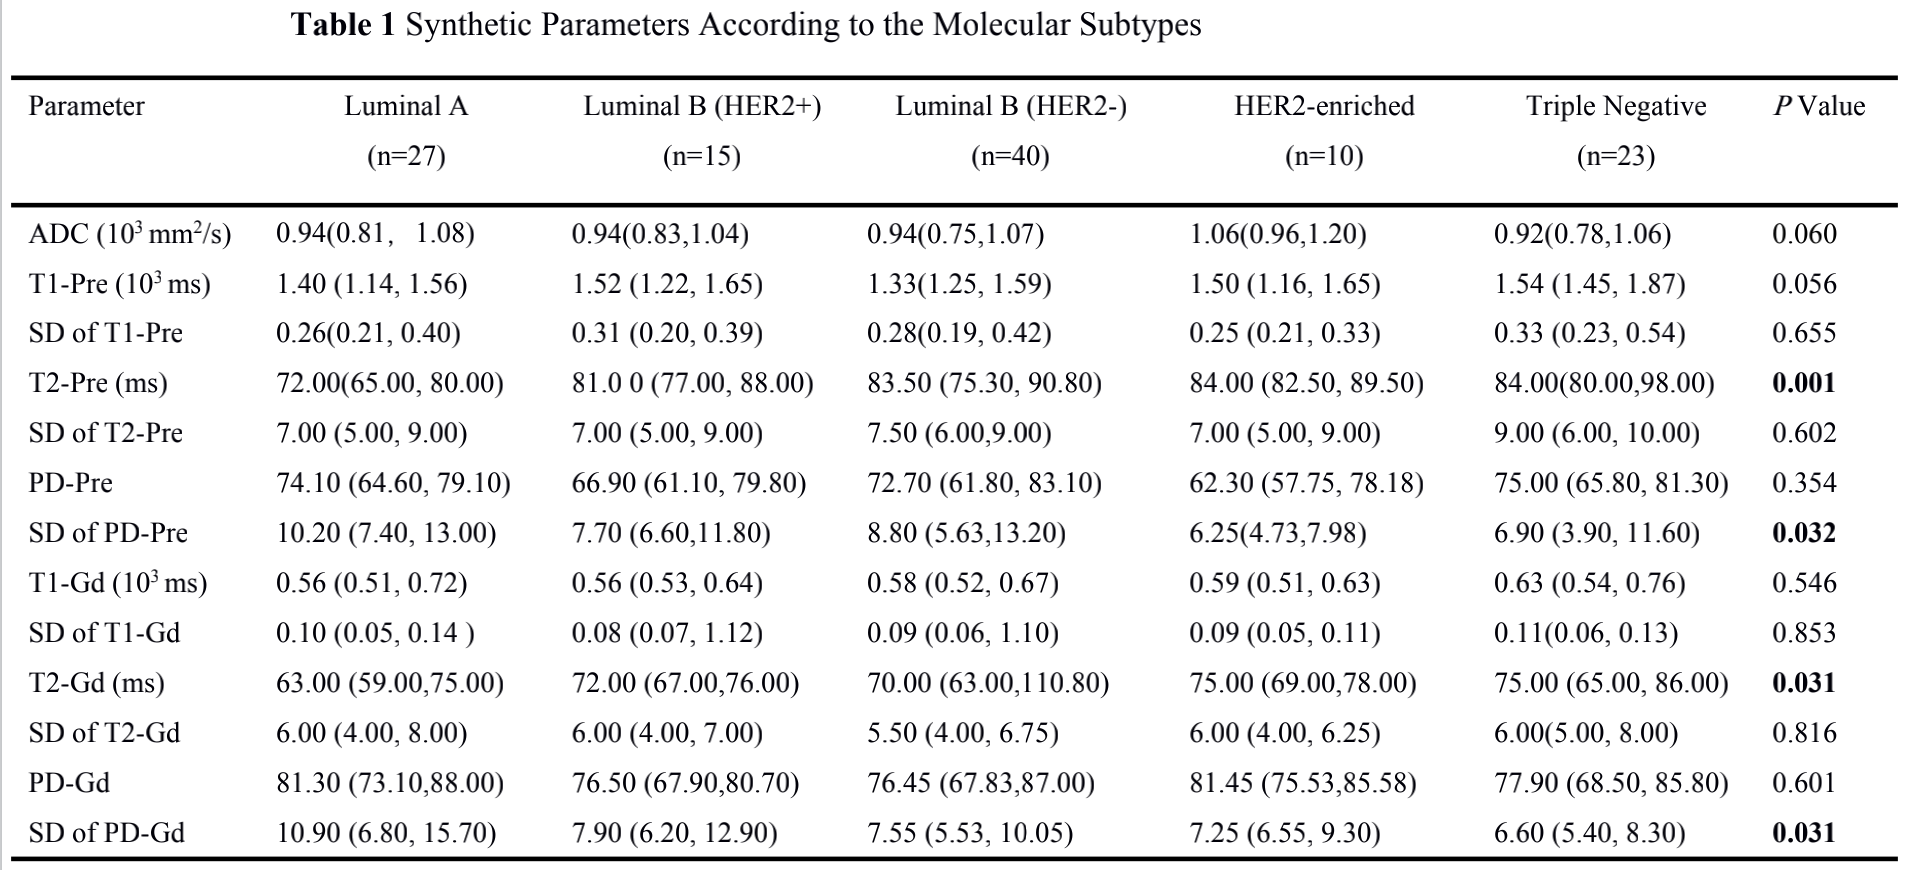
3689
Synthetic MRI with quantitative mappings for identifying HER2-enriched breast cancers and differentiating them from other molecular subtypes1Second Affiliated Hospital of Xi’an Jiaotong University, Xi'an, China, 2GE Healthcare, MR Research China, Beijing, China
Synopsis
In this study, we aim to investigate whether quantitative parameters of synthetic MRI can be used to differentiate among molecular subtypes and prognostic factors in patients with breast cancer. It was concluded that SD of PD-Pre was significantly different between HER2-enriched and non-HER2-enriched breast cancers, which displayed optimal performance than others. Quantitative T2-Pre, T2-Gd, SD of PD-Pre, and SD of PD-Gd were significantly different in the molecular subtypes and can further differentiate luminal breast cancers from non-luminal subtypes. T1-Pre, T2-Pre, and SD of PD-Gd were significantly different between triple negative (TN) and non-TN breast cancers.
Introduction
Breast cancer is a highly heterogeneous disease comprising various molecular subtypes which have led to targeted treatments1, 2, and have subsequent effects on patient clinical outcomes and can be used to help guide therapeutic interventions3, 4. Prognostic factors, including estrogen receptor (ER), progesterone receptor (PR), and human epidermal growth factor receptor 2 (HER2) status, as well as proliferation rate (Ki-67), have been applied in clinical practice1, 5. In addition, using prognostic factors surrogates, breast cancer can be divided into different molecular subtypes1, 6. However, the use of prognostic factors has been shown to be short of robustly predicting outcomes, and presents a barrier because of the invasive method7. Dynamic contrast-enhanced imaging (DCE) MRI and diffusion weighted imaging (DWI) have been applied to correlate with different molecular subtypes and molecular prognostic factors6, 8, 9. However, the results were inconsistent. Demand still exists for additional alternative methods utilizing MRI markers that can be used as prognostic factors and allow differentiation of breast cancer into molecular subtypes. Recently, the synthetic MRI technique, magnetic resonance image compilation (MAGiC) with multiecho and multidelay acquisition, has enabled quantification of T1 and T2 relaxation times and proton density (PD) image maps simultaneously, providing fast scanning and reliable information during a practically acceptable scan time10-12. The purpose of the study was to investigate whether different parameters of synthetic MRI can be used for the identification of prognostic factors and molecular subtypes of breast cancer.Material and Methods
From May 2019 to Oct 2020, 115 patients (mean age, 50 years; age range, 31–75 years) were retrospectively included in our study. All breast lesions were confirmed by biopsy or surgical pathology. All patients underwent a bilateral breast MR imaging examination with a 3-T MR Imager (Signa Pioneer, GE Healthcare, Milwaukee, USA) using a dedicated 8-channel array coil. The scan sequences included routine axial (AX) T2-weighted and T1-weighted imaging, DWI, DCE, and synthetic MRI (MAGiC). MAGiC (version 100.1.1) is an implementation of synthetic MRI image processing on the GE 3-T machine, which can automatically calculate these values and construct quantitative maps of T1, T2, and PD. Specifically, two echoes (TE1: 20 ms, TE2: 99.8 ms), 4 different delay times (170, 670, 1840, and 3840 ms respectively), Bandwidth=25kHz, number of average=1, FOV=34cm×34cm, slice thickness/gap=5/1mm, 31 axial slices, echo train length=16, matrix=320×224, SENSE acceleration factor=2, and scanning time = 6.01mins. The post-contrast MAGiC was performed immediately after the DCE-MRI scan. Parameters involving T1, T2, PD and their standard deviations (SD) in the breast lesions before (T1-Pre, T2-Pre, PD-Pre, SD of T1-Pre, SD of T2-Pre, SD of PD-Pre) and after (T1-Gd, T2-Gd, PD-Gd, SD of T1-Gd, SD of T2-Gd, SD of PD-Gd) contrast agent injection were obtained. Associations between quantitative parameters ER, PR, HER2, Ki-67 status and molecular subtypes (Luminal A, luminal B, HER2-positive, TN) were assessed using independent Student’s t-test or Wilcoxon rank sum. The diagnostic performance was evaluated using area under the receiver operating characteristic (ROC) curves (AUC).Results
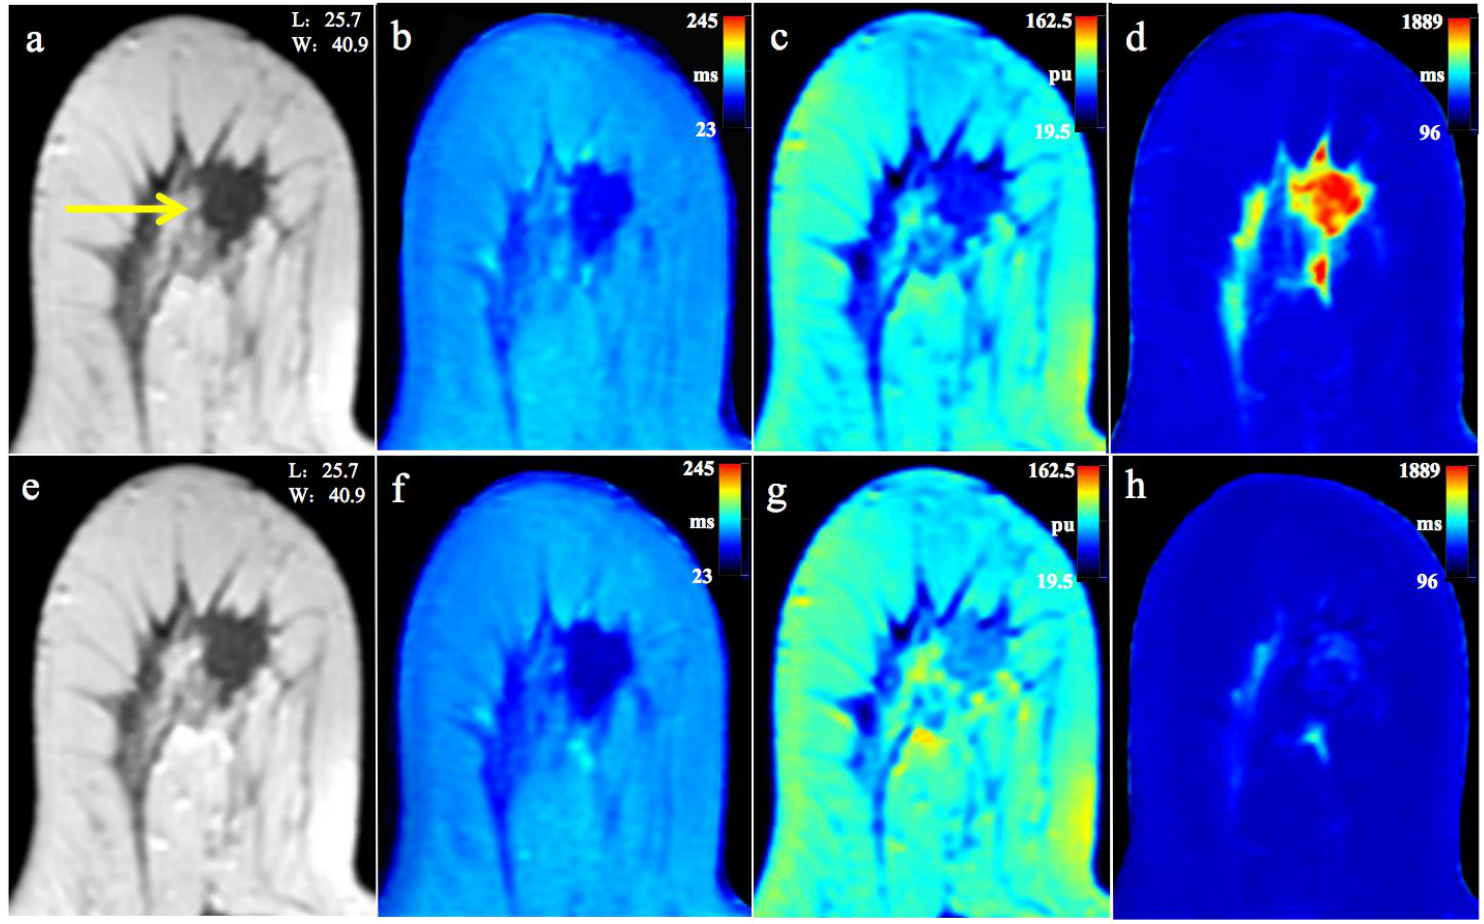
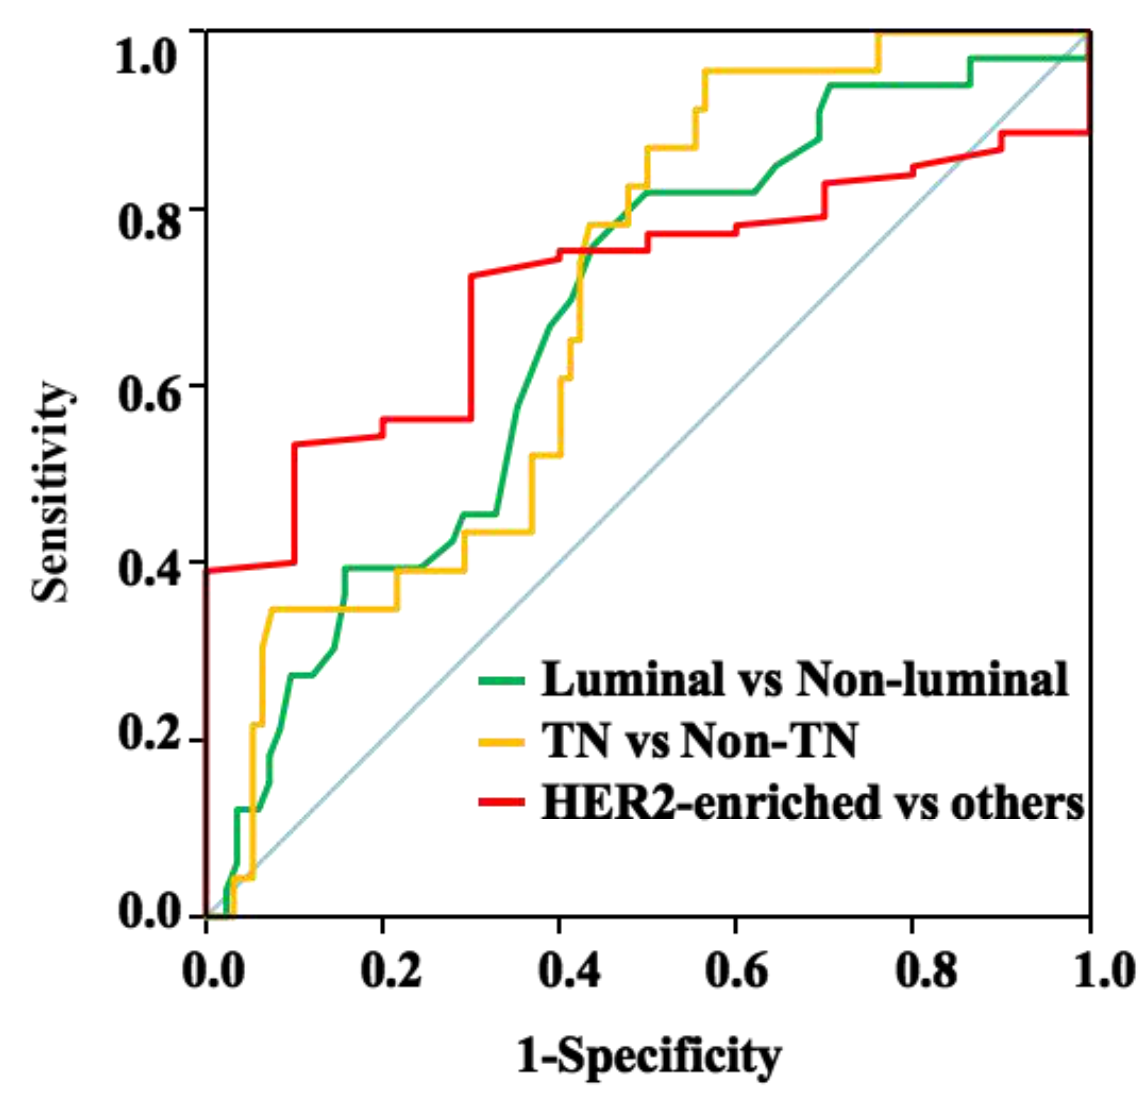
Quantitative T1-Pre, T2-Pre, PD-Pre, T2-Gd, SD of PD-Pre, and SD of PD-Gd can be used as quantitative imaging biomarkers for the different receptor status and proliferation rate of breast cancer. Among them, T2-Pre, T2-Gd, SD of PD-Pre, and SD of PD-Gd were significantly different in the molecular subtypes (Table 1) and can further differentiate luminal breast cancers from non-luminal subtypes. T1-Pre, T2-Pre, and SD of PD-Gd were significantly different between triple negative (TN) and non-TN breast cancers. SD of PD-Pre was significantly different between HER2-enriched and non-HER2-enriched breast cancers (Table 2, Figure 1), which displayed optimal performance with AUC, sensitivity, specificity, positive predictive value, and negative predictive value (0.711, 90.0%, 53.3%, 15.5%, and 98.2%, respectively). (Table 3, Figure 2).Discussion and Conclusion
Our study demonstrated that T1-Pre, PD-Pre, T2-Pre, T2-Gd, SD of PD-Pre, and SD of PD-Gd can be used as quantitative imaging biomarkers for differentiating breast cancers of different receptor statuses and proliferation rates. Further analysis of the molecular subtypes established significance in differentiating luminal breast cancers from non-luminal subtypes, with T1-Pre, T2-Pre, T2-Gd, SD of PD-Pre and SD of PD-Gd; TN from non-TN tumors, and with T1-Pre, T2-Pre and SD of PD-Gd; HER2-enriched from the non-HER2-enriched tumors with SD of PD-Pre. However, the significant overlap of synthetic MRI values among different receptor statuses and molecular subtypes exists, which reduces the accuracy of the quantitative parameters used. Du et al13 reported the largest AUC for T2 in differentiating between luminal A and other subtypes, similar to our results. On the other hand, Du et al13 reported that T1 and T2 were correlated with TN tumors, which is in agreement with our results. Furthermore, we found that SD of PD-Pre was significantly lower in HER2-enriched tumors than in non-HER2-enriched tumors. One of the major limitations in our study is the number of patients was small and the number of breast cancers with different subtypes was unbalanced. Hence future study with a bigger cohort of subjects is warranted. To conclude, synthetic MRI may provide a non-invasive tool for assessing the molecular subtypes and heterogeneity of breast cancer tumors.Acknowledgements
No acknowledgement found.References
1. Goldhirsch A, Wood WC, Coates AS, Gelber RD, Thürlimann B, Senn HJ, et al. Strategies for subtypes-dealing with the diversity of breast cancer: highlights of the St. Gallen international expert consensus on the primary therapy of early breast cancer 2011. Ann Oncol 2011;22:1736–1747.
2. Perou CM, Sørlie T, Eisen MB, van de Rijn M, Jeffrey SS, Rees CA, et al. Molecular portraits of human breast tumours. Nature 2000;406:747–752.
3. Kim JH, Ko ES, Lim Y, Lee KS, Han BK, Ko EY, et al. Breast cancer heterogeneity: MR imaging texture analysis and survival outcomes. Radiology 2017;282:665–675
4. Wu SG, He ZY, Li Q, Li FY, Lin Q, Lin HX, et al. Predictive value of breast cancer molecular subtypes in Chinese patients with four or more positive nodes after postmastectomy radiotherapy. Breast 2012;21:657–661.
5. Kyndi M, Sørensen FB, Knudsen H, Overgaard M, Nielsen HM, Overgaard J, et al. Estrogen receptor, progesterone receptor, HER-2, and response to postmastectomy radiotherapy in high-risk breast cancer: the Danish breast cancer cooperative group. J Clin Oncol 2008;26:1419–1426.
6. Horvat JV, Bernard-Davila B, Helbich TH, Zhang M, Morris EA, Thakur SB, et al. Diffusion-weighted imaging (DWI) with apparent diffusion coefficient (ADC) mapping as a quantitative imaging biomarker for prediction of immunohistochemical receptor status, proliferation rate, and molecular subtypes of breast cancer. J Magn Reson Imaging 2019;50:836–846.
7. Guiu S, Michiels S, André F, Cortes J, Denkert C, Di Leo A, et al. Molecular subclasses of breast cancer: how do we define them? The IMPAKT 2012 Working Group Statement. Ann Oncol 2012;23:2997–3006.
8. Youk JH, Son EJ, Chung J, et al. Triple-negative invasive breast cancer on dynamic contrast-enhanced and diffusion-weighted MR imaging: comparison with other breast cancer subtypes. Eur Radiol 2012;22:1724–1734.
9. Agner SC, Rosen MA, Englander S, et al. Computerized image analysis for identifying triple-negative breast cancers and differentiating them from other molecular subtypes of breast cancer on dynamic contrast-enhanced MR images: a feasibility study. Radiology 2014;272:91–99
10. Krauss W, Gunnarsson M, Nilsson M, Thunberg P. Conventional and synthetic MRI in multiple sclerosis: a comparative study. Eur Radiol 2018;28:1692-1700.
11. Tanenbaum LN, Tsiouris AJ, Johnson AN, Naidich TP, DeLano MC, Melhem ER, et al. Synthetic MRI for clinical neuroimaging: Results of the magnetic resonance image compilation (MAGiC) prospective, multicenter, multireader trial. AJNR Am J Neuroradiol 2017;38:1103–1110.
12. Gao W, Zhang S, Guo J, Wei X, Li X, Diao Y, et al. Investigation of synthetic relaxometry and diffusion measures in the differentiation of benign and malignant breast lesions as compared to BI-RADS. J Magn Reson Imaging 2021;53:1118–1127.
13. Du S, Gao S, Zhang L, Yang X, Qi X, Li S. Improved discrimination of molecular subtypes in invasive breast cancer: comparison of multiple quantitative parameters from breast MRI. Magn Reson Imaging 2021;77:148–158.
Figures