3685
A time-saving and optimized IVIM protocol for diagnosis of prostate cancer1Department of Radiology,Taihe hospital, Hubei University of Medicine, Hubei, China, 2GE Healthcare, Beijing, China, 3Biomedical Engineering College, Hubei University of Medicine, Hubei, China
Synopsis
It is of importance to acquire diffusion-weighted images with high image quality in a short time whereas higher b value and a greater number of b values reduce image quality and prolong scan time. In this study, we aimed to build an optimized protocol for IVIM in diagnosis of prostate cancer.We observed mean of all ADC, D, D* and f derived from IVIM with 5 b-value scheme showed almost the same diagnosis efficiency to IVIM with 13 b-value scheme, suggesting sensitivity and specificity were not different between different b-value scheme.
Introduction
The incidence of prostate cancer (PCA) has increased by 42% worldwide since 2007[1] while that in east Asia has been underestimated and might be actually similar to that in western countries [2]. Intra-voxel incoherent movement (IVIM) with a broadly distributed b values can distinguish tissue diffusion from perfusion information [3]. Due to the limitation of scan time, it is challenged to apply multiple b values in clinical practice. It is of importance to acquire diffusion-weighted images with high image quality in a short time whereas higher b value and a greater number of b values reduce image quality and prolong scan time. Therefore, we aimed to build an optimized protocol for IVIM via investigation of the value of parameters (f, D, D* values)derived from IVIM models with 13 b values and 5 b values.Materials and methods
A total of 26 patients, including 13 prostate cancer (PC) and 13 benign prostatic hyperplasia (BPH),enrolled in this study. All participants underwent rFOV-DWI (TR/TE =6000/77.7 , FOV=20×20 cm2, matrix size =80×100 , slice thickness =4) with two optimization schemes of b values (A scheme: 0, 100, 400, 800, 1500s/mm2, B scheme: 0, separately 6 b values between 25-200 and between 300-1500 s/mm2).Three regions of interests (ROI) were placed in the largest lesion area among slices in avoidance of hemorrhage, necrosis, calcification and urethra. All ROIs were firstly positioned on DWI with b= 0 s/mm2 and then copied to post-processed standard ADC map, perfusion fraction (f) map, diffusion (D) map and pseudo diffusion (D*) map. In addition, ROC curve was plotted to ensure the same performance of two b-value schemes in differentiation of PC and BPH.Results
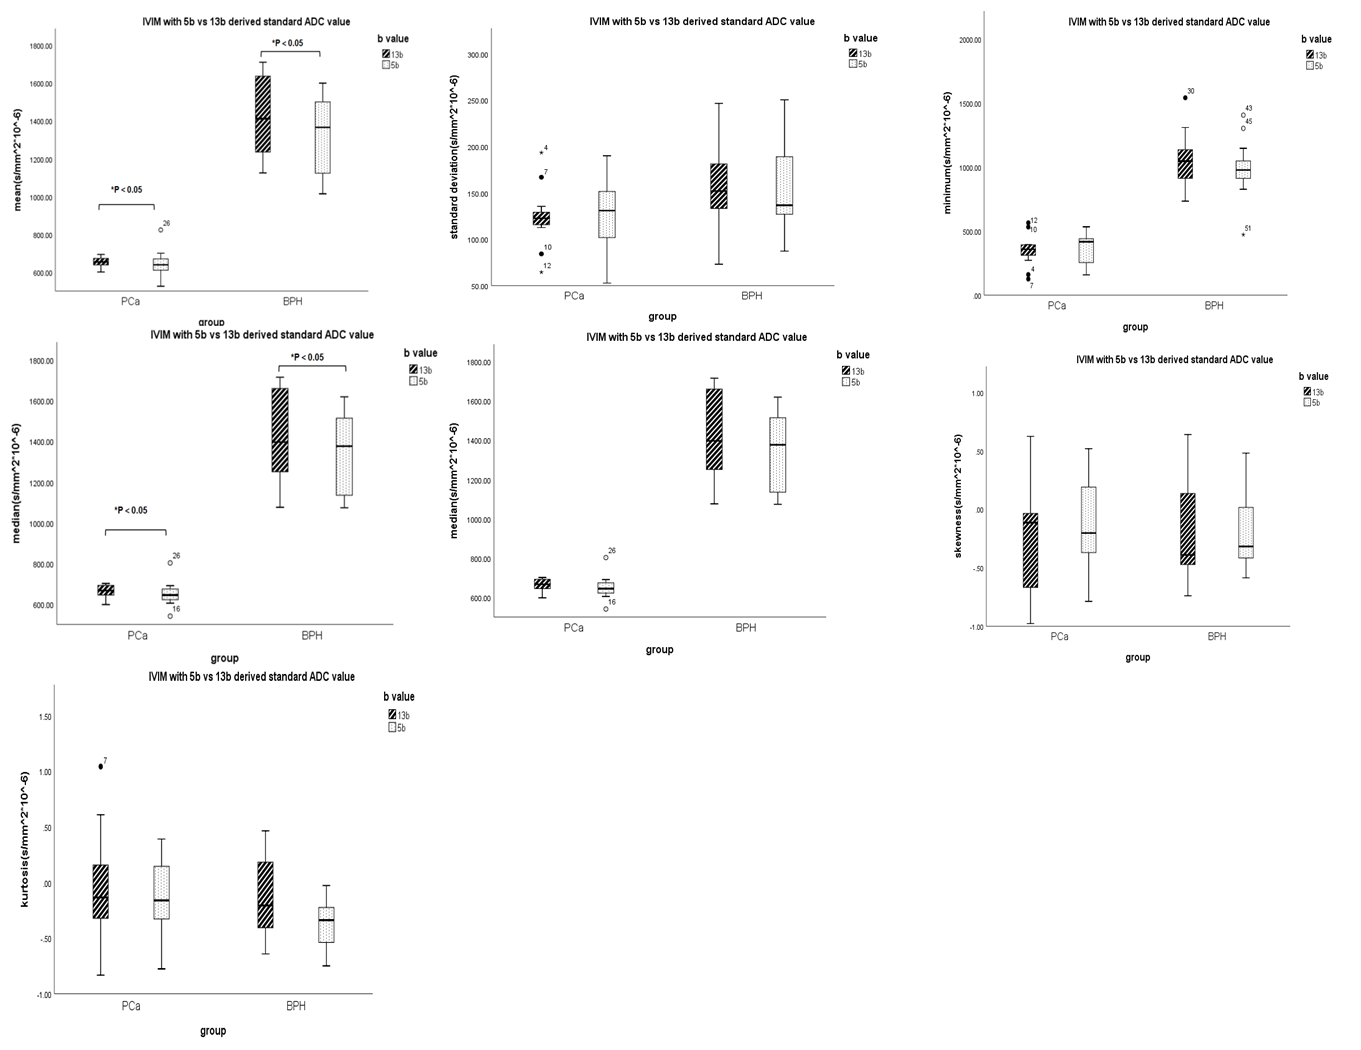
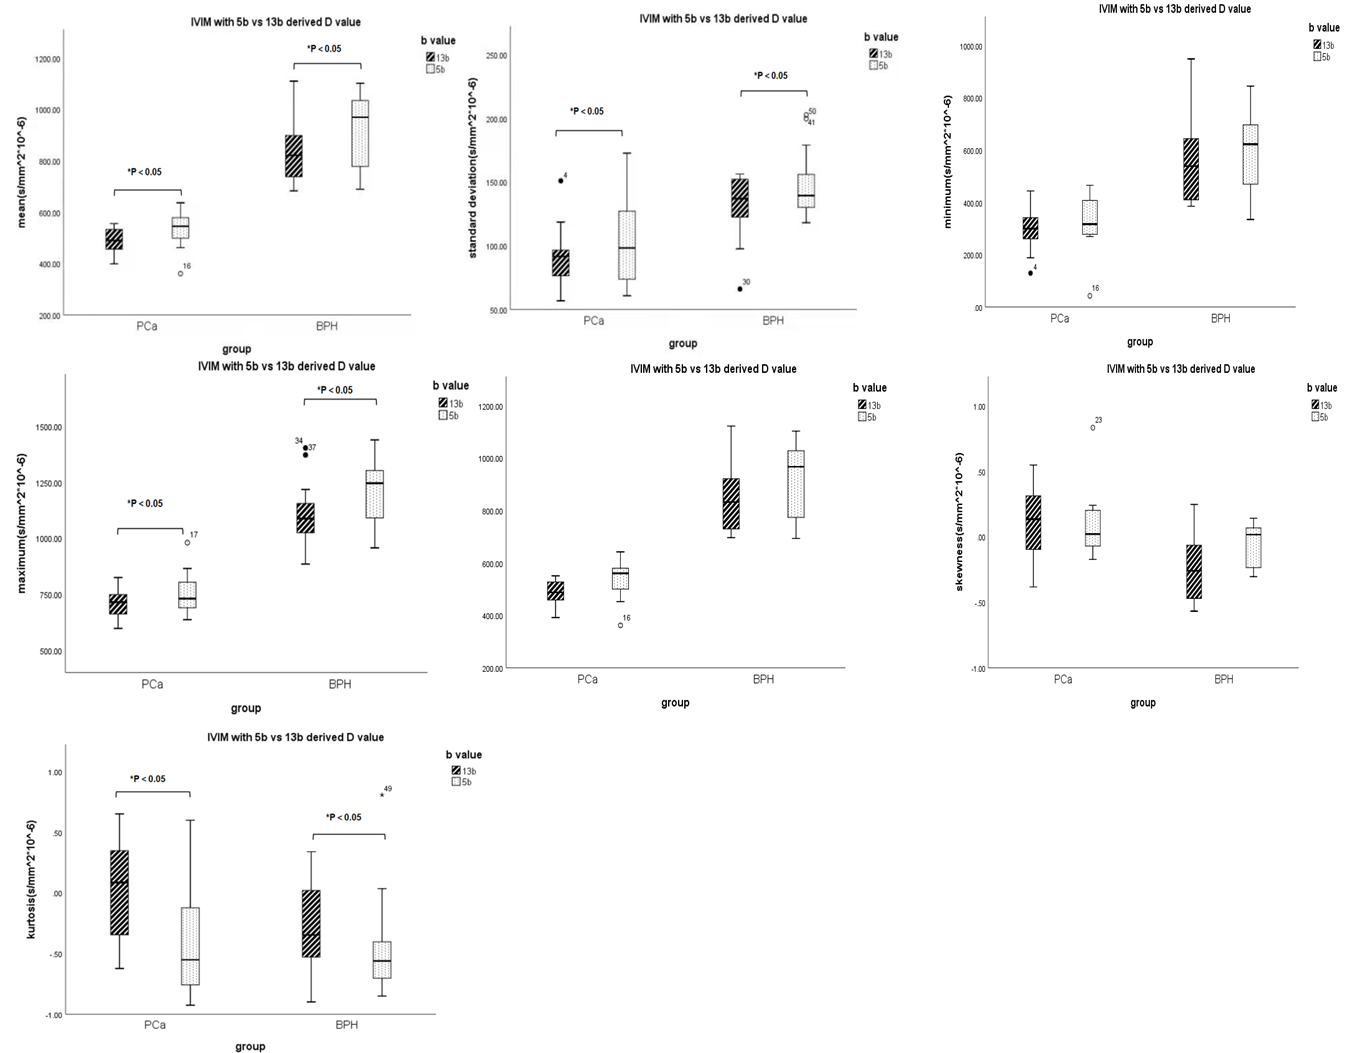
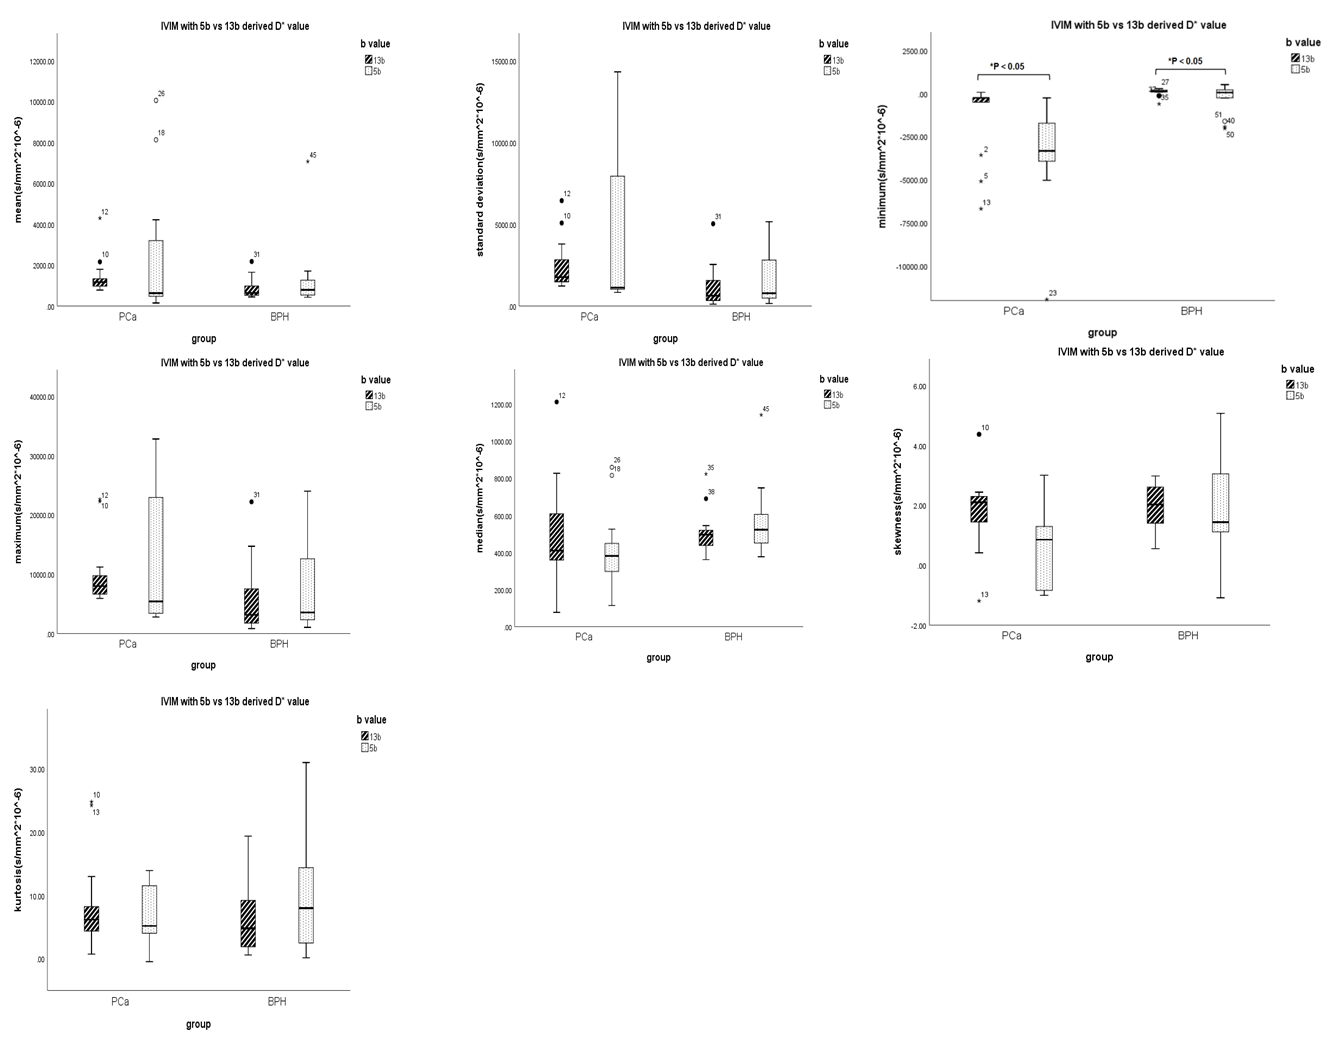
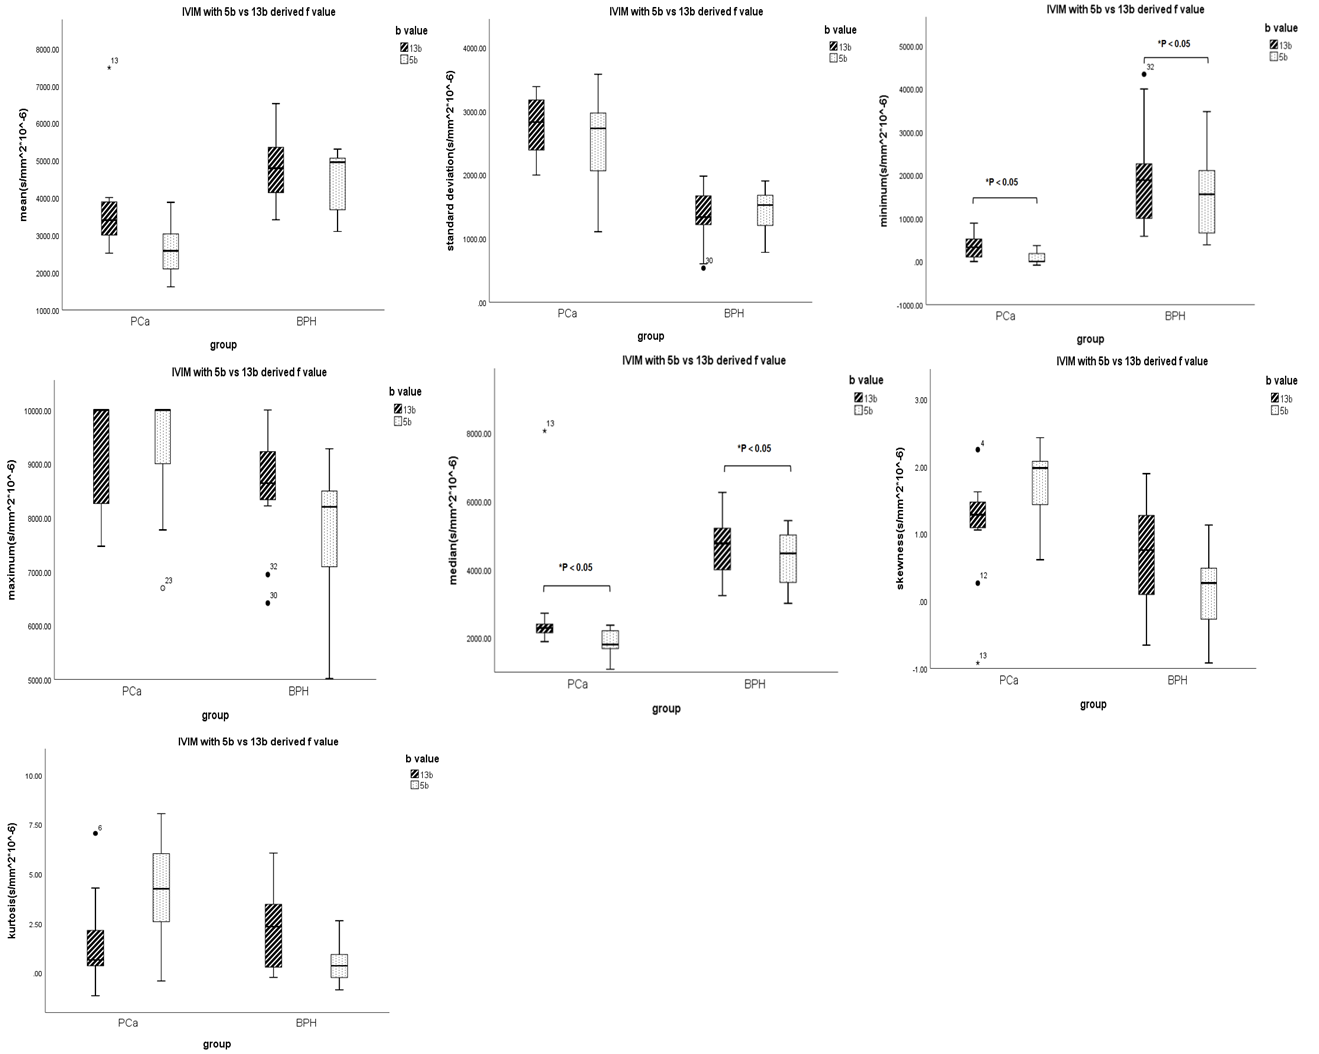
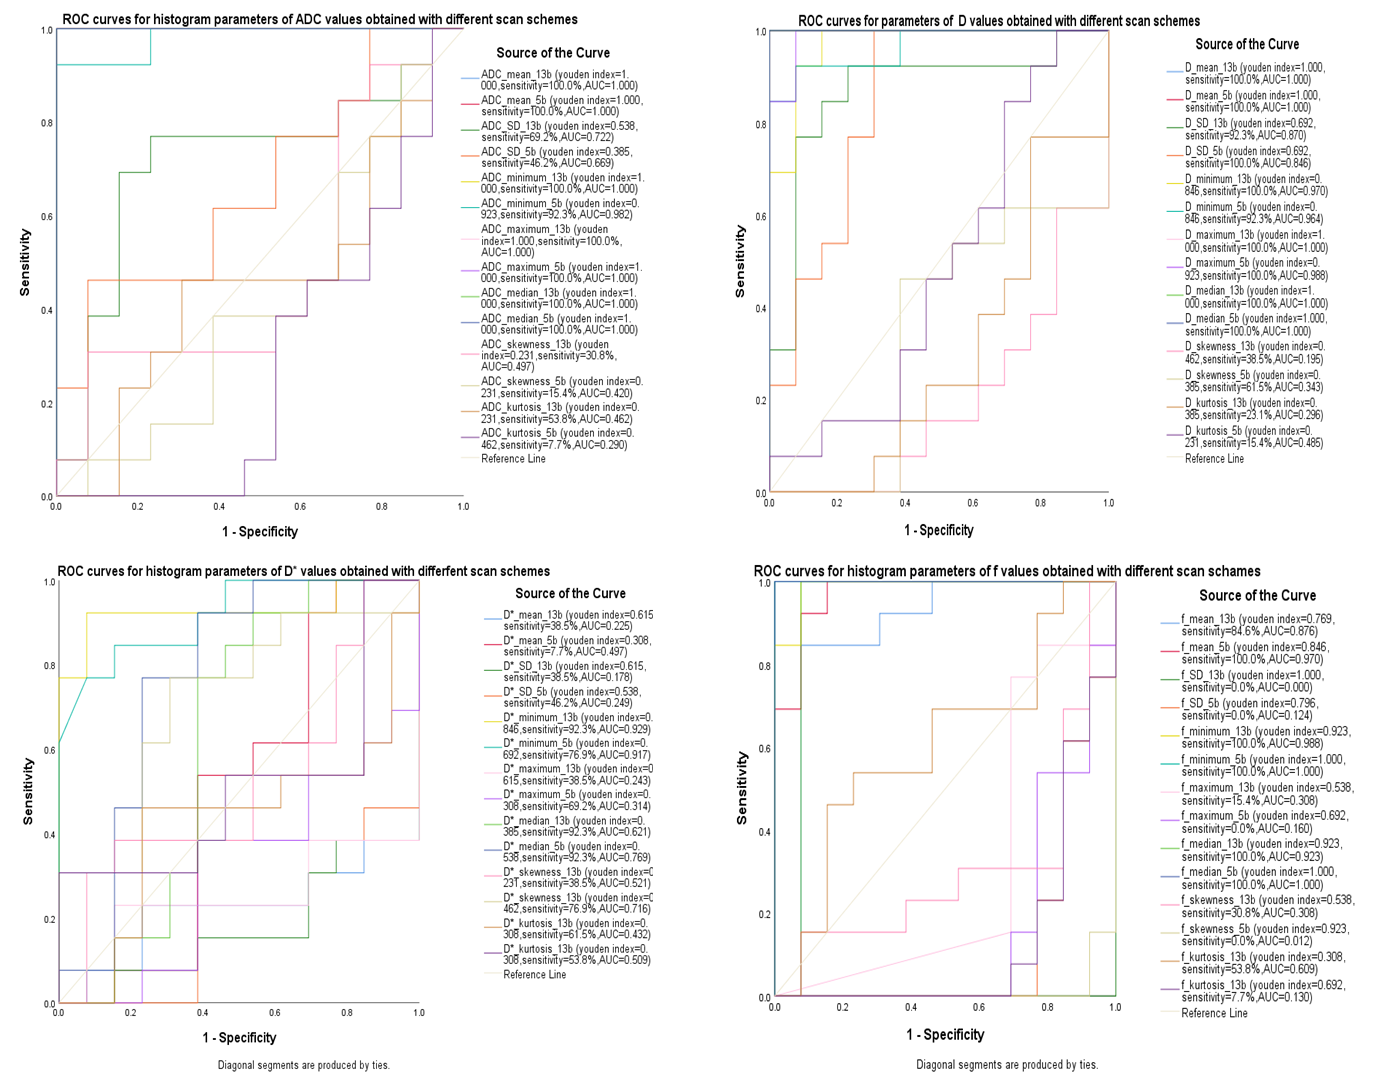
There were significant different mean and median between ADC map, mean , SD , maximum and kurtosis between D map, minimum between D* map, minimum and median between f map computed by IVIM with two different b-value schemes (p < 0.05) (Figure 1,2, 3, 4). AUC of 13b and 5b showed ADC and D had the highest diagnostic efficiency (Figure 5). IVIM with 5 b-value scheme generates many histogram-analyzed parameters with same differentiation performance with IVIM with 13 b-value scheme, including SD , minimum, maximum, skewness ,kurtosis of ADC map, minimum, median, skewness of D map, mean, SD, maximum, median, skewness ,kurtosis of D* map, and mean, SD, maximum, skewness, kurtosis of f map.Discussion
We observed significant different mean ADC and D but not D* and f between IVIM with two different b-value schemes. In addition, mean of all ADC, D, D* and f derived from IVIM with 5 b-value scheme showed almost the same diagnosis efficiency to IVIM with 13 b-value scheme, suggesting sensitivity and specificity were not different between different b-value scheme.Standard ADC and diffusion coefficient (D) derived from IVIM with two different b-value schemes showed significantly different but similar sensitivity in differentiation of PC and BPH while D* and f showed no difference but obvious distinct sensitivity. Standard ADC value is highly influenced vessel flow and cannot truly separate diffusion from perfusion as previous studies mentioned [4-5]. We speculated that significant different standard ADC values and D may attribute to obvious different tissue structures (vascular growth more in PC and increased cell density in BPH).In contrast, both f and D* between two scan schemes showed no difference, butdiagnostic performance was obvious distinct, indicating IVIM is sensitive to microvascular perfusion conditions. In other words, f and D* derived from IVIM with 5 b-value scheme was sufficient to distinguish BPH from PC.Many IVIM studies used the number of b values ranging from 4 to ten more [6-7]. A study even reported that 8 b-values is the optimal scheme for IVIM [8]. No optimal b-value scheme came to agreement. In addition, there was no consistent cutoff of ADC values for differentiation between BPH and PC. However, our results suggested that IVIM with 5 b-values had potential in clinical diagnosis of prostate cancer with prognostic performance equal to 13-b scheme. This proposed 5 b-value scheme not only reduced pressures on radiologist for shorter scan time but also improved patient tolerance, and subsequently elevate image quality. Since small sample size is the limitation for our study, to recruit different subtypes of prostate cancer in our study is our future work.Conclusion
IVIM with 5 b-values can not only save scanning time but also have potential in clinical diagnosis of prostate cancer with prognostic performance equal to 13-b scheme.Acknowledgements
References
[1]Global Burden of Disease Cancer Collaboration; Fitzmaurice C, Abate D, et al. Global, Regional, and National Cancer Incidence, Mortality, Years of Life Lost, Years Lived With Disability, and Disability-Adjusted Life-Years for 29 Cancer Groups, 1990 to 2017: A Systematic Analysis for the Global Burden of Disease Study. JAMA Oncol 2019;5(12):1749–1768.
[2]Monn MF, Tatem AJ, Cheng L (2016) Prevalence and management of prostate cancer amongEast Asian men: Current trends and future perspectives. Urol Oncol 34:58.e1-9. https ://doi.org/10.1016/j.urolo nc.2015.09.003
[3]Le Bihan D, Breton E, Lallemand D, et al. MR imaging of intravoxel incoherent motions: application to diffusion and perfusion in neurologic disorders. Radiology, 1986, 161(2): 401-407
[4]Pang Y, Turkbey B, Bernardo M, et al. Intravoxel incoherent motion MR imaging for prostate cancer: an evaluation of perfusion fraction and diffusion coefficient derived from different b-value combinations. Magn Reson Med. 2013;69(2):553-562. doi:10.1002/mrm.24277
[5]Beyhan M, Sade R, Koc E, Adanur S, Kantarci M. The evaluation of prostate lesions with IVIM DWI and MR perfusion parameters at 3T MRI. Radiol Med. 2019;124(2):87-93. doi:10.1007/s11547-018-0930-3.
[6]Döpfert J, Lemke A, Weidner A, Schad LR. Investigation of prostate cancer using diffusion-weighted intravoxel incoherent motion imaging. MagnReson Imaging. 2011;29(8):1053 1058. doi:10.1016/j.mri.2011.06.001
[7]Lemke A, Stieltjes B, Schad LR, Laun FB. Toward an optimal distribution of b values for intravoxel incoherent motion imaging. MagnReson Imaging. 2011;29(6):766-776. doi:10.1016/j.mri.2011.03.004.
[8]Malagi AV, Das CJ, Khare K, Calamante F, Mehndiratta A. Effect of combination and number of b values in IVIM analysis with post-processing methodology: simulation and clinical study. MAGMA. 2019;32(5):519-527. doi:10.1007/s10334-019-00764-0
Figures