3683
Application of DKI in the assessment of early renal injury in patients with DM
You-Zhen Feng1, Zhong-Yuan Cheng1, Long Qian2, and Xiang-Ran Cai1
1Medical Imaging Center, the First Affiliated Hospital of Jinan University, Guangzhou, China, 2MR Research,GE Healthcare, Beijing, China
1Medical Imaging Center, the First Affiliated Hospital of Jinan University, Guangzhou, China, 2MR Research,GE Healthcare, Beijing, China
Synopsis
Apply DKI technology to the assessment of early renal function changes in diabetic patients. These results indicate that the microstructure of kidney tissue may have changed in diabetic patients without clinically impaired renal function. In addition, the results of correlation analysis between DKI parameters and clinical laboratory indicators of renal function (HBA1, Uscr, and eGFR) show that there is a linear correlation between most of the parameters, which objectively confirms the feasibility of DKI parameters to reflect changes in renal function.
Introduction
The clinical symptoms of early diabetic kidney injury are hidden, and the urine microalbuminuria is mainly used to evaluate the renal function [1-4]. However, it is susceptible to the interference of many factors such as infection, fever, exercise, and genetics [5]. In recent years, the new diffusion-weighted technology DKI has gradually been applied to kidney-related research and has achieved good results.In addition, our previous study on DKI kidney injury with hyperuricemia [6] showed that DKI can detect early kidney injury in patients with hyperuricemia. Therefore, DKI can provide more information about the microstructure of the tissue, as a non-invasive examination method to evaluate and monitor changes in kidney tissue.Methods
A total of 80 subjects, including 53 patients with type 2 diabetes (DM group) and 23 healthy volunteers (control group) were enrolled in this study from July 2018 to August 2020. DM patients were diagnosed according to 2017 China Type 2 Diabetes Prevention Guidelines. The ACR of the DM group was less than 300 mg/g, and the control group was under 30 mg/g. All participants underwent DKI scanning performed by a 3.0 T magnetic resonance scanner, with three different b value( 0, 500 s/mm2, 1000s/mm2 ) and 30 diffusion-sensitive gradient field directions. The corresponding parameter values of cortical and medullary DKI (cortex, FAc, MDc, MKc; medulla, FAm, MDm, MKm) were recorded and clinical related data of all patients were collected as well. The independent sample T test was used to compare the DKI parameter values between control and DM group.In addition, Pearson correlation analysis was employed to assess the correlation between the DKI parameters and HBA1C, Cycs, UALB, Uscr, ACR and eGFR.Results and Discussion
The MK value is positively correlated with the complexity of the tissue structure in the region of interest.[7,8]. In this study, the decrease in the MK values of renal cortex and medulla in the DM group may indicate early kidney injury in diabetes, decreased tissue complexity, and reduced water molecule free diffusion restriction. We speculate that the decrease in Mkc and MKm values in the DM group is mainly related to the early renal hyperfiltration in diabetic patients. A series of pathophysiological changes caused by the kidney in a hyperfiltration state are related to the increase of proximal renal tubular cells and the volume of the lumen [9-13], the free diffusion space of water is relatively increased, and the degree of restriction is reduced. Not only that, the increased reabsorption of glucose and sodium by the proximal renal tubules causes an increase in the load of the proximal tubules and an increase in the oxygen consumption of the corresponding tissues [14], leading to the occurrence of local tissue hypoxia and further complicating the local tissues. Suffering damage, such as local tissue loosening, shedding, and lumen expansion, etc., may lead to damage to the directional tubular structure that hinders the diffusion of water molecules, the tendency of water molecules to diffuse toward freedom, and the deviation from the Gaussian model is reduced. On the other hand, in the early stages of diabetes, it can also cause inflammatory reactions [15], endothelial cell proliferation [16], glomerular mesangial proliferation [17] and interstitial fibrosis and other pathological changes, which make the kidneys of the DM group Compared with the control group, the overall effect of the MK value of the cortex and renal medulla showed a decreasing trend.The anatomical differences between the renal cortex and medulla lead to the renal cortex appear isotropic, while the medulla is more anisotropic, and the FA value of the renal cortex is lower than that of the medulla; this also leads to significant pathophysiological changes in the renal cortex and medulla when they encounter diseases. The early stage of DM patients mainly manifests as the renal hyperfiltration state, while the transplanted kidney is mainly affected by the rejection of the body and the dysfunction occurs. The early changes of hyperuricemia are mainly the inflammatory reaction of the renal interstitium [18]. In the early stage of DM, the small arteries of the ball are expanded, and the renal blood flow and glomerular filtration rate increase, resulting in a state of hyperperfusion and hyperfiltration of the glomeruli [19-21].
The MD value is easily affected by factors such as tissue microperfusion and fluid flow in the tubules [7,8]. Early DM triggered inflammatory reactions [52], interstitial fibrosis, etc. [22], which caused an increase in water molecule diffusion barriers, which may be one of the reasons for the decrease in MD values in the DM group. In addition, part of the glomerular filtration function of patients in the DM group is impaired, the appearance of microalbuminuria and the filtration of macromolecular substances will also cause the MD value to decrease.
Conclusion
DKI can detect early renal function changes in patients with DM. The decrease of MKc and MKm values in the DM group may be related to the renal hyperfiltration state in the early stage of diabetes. The decrease of FAm and MDm values of medulla could indicate the continuous progress of renal damage.Acknowledgements
None.References
[1] Atkins R C, Briganti E M, Lewis J B, et al.Proteinuria reduction and progression to renal failure in patients with type 2 diabetes mellitus and overt nephropathy[J].Am J Kidney Dis,2005, 45 (2): 281-287. [2] Bjornstad P, Cherney D Z, Maahs D M, et al.Diabetic Kidney Disease in Adolescents With Type 2 Diabetes: New Insights and Potential Therapies[J].Curr Diab Rep,2016, 16 (2): 11. [3] Kim S S, Kim J H, Kim I J.Current Challenges in Diabetic Nephropathy: Early Diagnosis and Ways to Improve Outcomes[J].Endocrinol Metab (Seoul),2016, 31 (2): 245-253. [4] Pofi R, Di Mario F, Gigante A, et al.Diabetic Nephropathy: Focus on Current and Future Therapeutic Strategies[J].Curr Drug Metab,2016, 17 (5): 497-502. [5] Fufaa G D, Weil E J, Nelson R G, et al.Association of urinary KIM-1, L-FABP, NAG and NGAL with incident end-stage renal disease and mortality in American Indians with type 2 diabetes mellitus[J].Diabetologia,2015, 58 (1): 188-198. [6] Cheng Z Y, Feng Y Z, Liu X L, et al.Diffusional kurtosis imaging of kidneys in patients with hyperuricemia: initial study[J].Acta Radiol,2020, 61 (6): 839-847. [7] Jensen J H, Helpern J A, Ramani A, et al.Diffusional kurtosis imaging: the quantification of non-gaussian water diffusion by means of magnetic resonance imaging[J].Magn Reson Med,2005, 53 (6): 1432-1440. [8] Jensen Jh H J.MRI quantification of non-Gaussian water diffusion by kurtosis analysis[J].NMR Biomed,2010, 23 (7): 698–710. [9] Hostetter T H.Hypertrophy and hyperfunction of the diabetic kidney[J].J Clin Invest,2001, 107 (2): 161-162. [10] Abbate M, Zoja C, Corna D, et al.In progressive nephropathies, overload of tubular cells with filtered proteins translates glomerular permeability dysfunction into cellular signals of interstitial inflammation[J].J Am Soc Nephrol,1998, 9 (7): 1213-1224. [11] Rasch R, Dørup J.Quantitative morphology of the rat kidney during diabetes mellitus and insulin treatment[J].Diabetologia,1997, 40 (7): 802-809. [12] Seyer-Hansen K, Hansen J, Gundersen H J.Renal hypertrophy in experimental diabetes. A morphometric study[J].Diabetologia,1980, 18 (6): 501-505. [13] Karnib H H, Ziyadeh F N.The cardiorenal syndrome in diabetes mellitus[J].Diabetes Res Clin Pract,2010, 89 (3): 201-208. [14] Palm F, Cederberg J, Hansell P, et al.Reactive oxygen species cause diabetes-induced decrease in renal oxygen tension[J].Diabetologia,2003, 46 (8): 1153-1160. [15] Abbate M, Remuzzi G.Proteinuria as a mediator of tubulointerstitial injury[J].Kidney Blood Press Res,1999, 22 (1-2): 37-46. [16] Osterby R, Asplund J, Bangstad H J, et al.Neovascularization at the vascular pole region in diabetic glomerulopathy[J].Nephrol Dial Transplant,1999, 14 (2): 348-352. [17] Rasch R, Nörgaard J O.Renal enlargement: comparative autoradiographic studies of 3H-thymidine uptake in diabetic and uninephrectomized rats[J].Diabetologia,1983, 25 (3): 280-287. [18] Sánchez-Lozada L G, Tapia E, López-Molina R, et al.Effects of acute and chronic L-arginine treatment in experimental hyperuricemia[J].American Journal of Physiology Renal Physiology,2007, 292 (4): F1238-1244. [19] Premaratne E, Verma S, Ekinci E I, et al.The impact of hyperfiltration on the diabetic kidney[J].Diabetes Metab,2015, 41 (1): 5-17. [20] Helal I, Fick-Brosnahan G M, Reed-Gitomer B, et al.Glomerular hyperfiltration: definitions, mechanisms and clinical implications[J].Nat Rev Nephrol,2012, 8 (5): 293-300. [21] Jerums G, Premaratne E, Panagiotopoulos S, et al.The clinical significance of hyperfiltration in diabetes[J].Diabetologia,2010, 53 (10): 2093-2104. [22] Grabias B M, Konstantopoulos K.The physical basis of renal fibrosis: effects of altered hydrodynamic forces on kidney homeostasis[J].Am J Physiol Renal Physiol,2014, 306 (5): F473-485.Figures
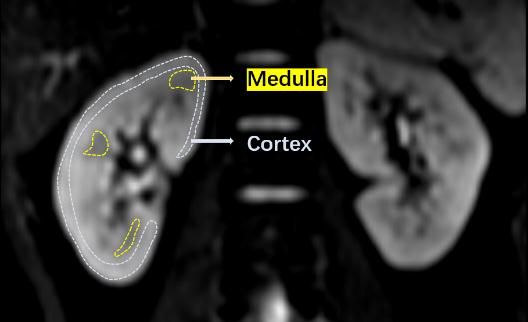
Fig. 1 Schematic diagram of the ROI
delineation method of the subject's kidney cortex and medulla
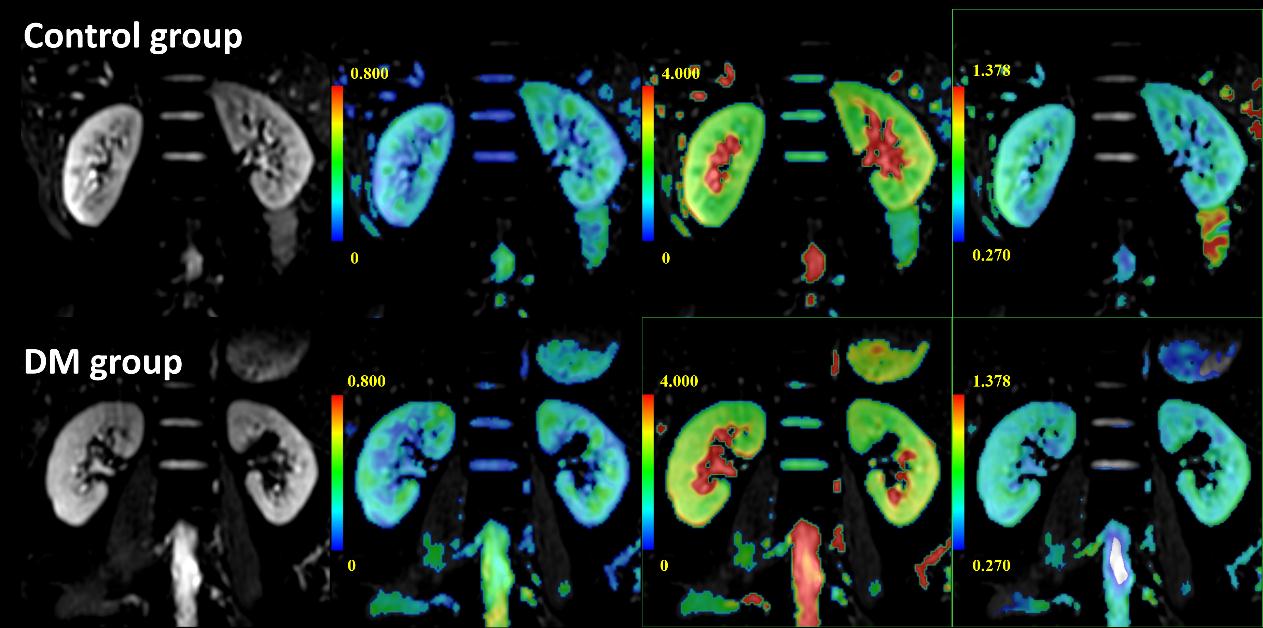
Fig. 2 The top row from
left to right shows the original kidney DKI map (b=0) and pseudo-color maps of
FA, MD and MK in a healthy volunteer (male, 53 years old); the bottom row shows
DM patients (male, 52) from left to right. Years old) Kidney kidney DKI
original image (b=0) and FA, MD and MK pseudo-color images.
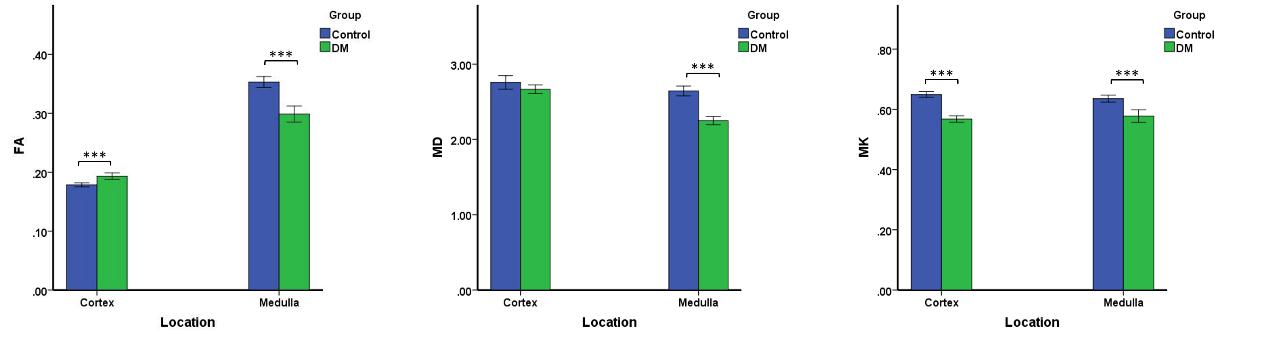
Fig.3 Comparison of FA, MD and MK between
Control and DM group of renal medulla and cortex. *P < 0.01, **P
< 0.001, and ***P < 0.0001.
DOI: https://doi.org/10.58530/2022/3683