3682
The Comparison of Enhancing-part and Whole-lesion of ROI Measurements in MR Histogram Analysis of Clear Cell RCC and None Clear Cell RCC1Radiology, Department of Radiology, Taichung Veterans General Hospital, Taiwan, Taichung, Taiwan, 2Ph.D. Program of Electrical and Communications Engineering, Feng Chia University, Taichung, Taiwan, Taichung, Taiwan, Taiwan, 3Department of Automatic Control Engineering, Feng Chia University, Taichung, Taiwan, Taichung, Taiwan, 4Department of Medical Imaging, Taichung Tzu Chi Hospital, Buddhist Tzu Chi Medical Foundation, Taichung, Taiwan, Taichung, Taiwan, 5School of Medicine, Tzu Chi University, Hualien, Taiwan, Taichung, Taiwan, 6Department of Medical Imaging Radiological Science, Central Taiwan University of science and Technology, Taichung, Taiwan, Taichung, Taiwan, 7Institute of Clinical Medicine, National Yang-Ming University, Taiwan, Taichung, Taiwan, 8School of Medical Imaging and Radiological Sciences, Chung Shan Medical University, Taiwan, Taichung, Taiwan, 9Department of Veterinary Medicine, National Chung Hsing University, Taiwan, Taichung, Taiwan, 10Division of Urology, Department of Surgery, Taichung Veterans General Hospital, Taiwan, Taichung, Taiwan, 11Department of Applied Chemistry, National Chi Nan University, Taiwan, Taichung, Taiwan
Synopsis
Tumor necrosis, hemorrhage, and cystic change may influence the result of MR histogram analysis between ccRCC and ncRCC. We conducted EP ROI and WL ROI measurements of these two tumors. Five most important metrics were found in differentiation, including three EP ROI metrics on the T1 A and V phase, and the T2W images, and two WL ROI metrics on the DWI b800 images and the T2W images. Both EP ROI and WL ROI played a role in the diagnosis ccRCC and ncRCC. The addition of these two ROI measurements of histogram analysis to routine MRI evaluation may benefit diagnosis.
INTRODUCTION
Renal cell carcinoma (RCC) was frequently classified into two groups: clear cell RCC (ccRCC) and none clear cell RCC (ncRCC). Due to more targeted therapy could be applied to ccRCC 1,2, the RCC subtyping provided significant clinical information and helped to guide therapy. Multiparametric MRI had been reported to help differentiate the RCCs subtype in several research studies 3-5, including the conventional MRI parameters; the dynamic contrast-enhanced (DCE) images; and the diffusion-weighted images (DWI).MR histogram analysis was a quantitative method that offer an evaluation of volumetric tumor diffusion feature and heterogeneity by analyzing the distribution of voxel signal intensity in the image 6,7. In quantitative analysis, regions of interest (ROI) selection is an important step. As previously reported 8,9, the largest image of the tumor area was ordinarily selected to conduct ROI. However, the heterogeneity of the tumor would fluctuate the MR histogram analysis, and tumoral necrosis or hemorrhage could influent the results. The most distinguishable ROI selection between ccRCC and ncRCC was still controversial. This study evaluated two different types of ROI measurement in MRI histogram parameters and tried to figure out which measurement can help most to differential ccRCC from ncRCC.
METHODS
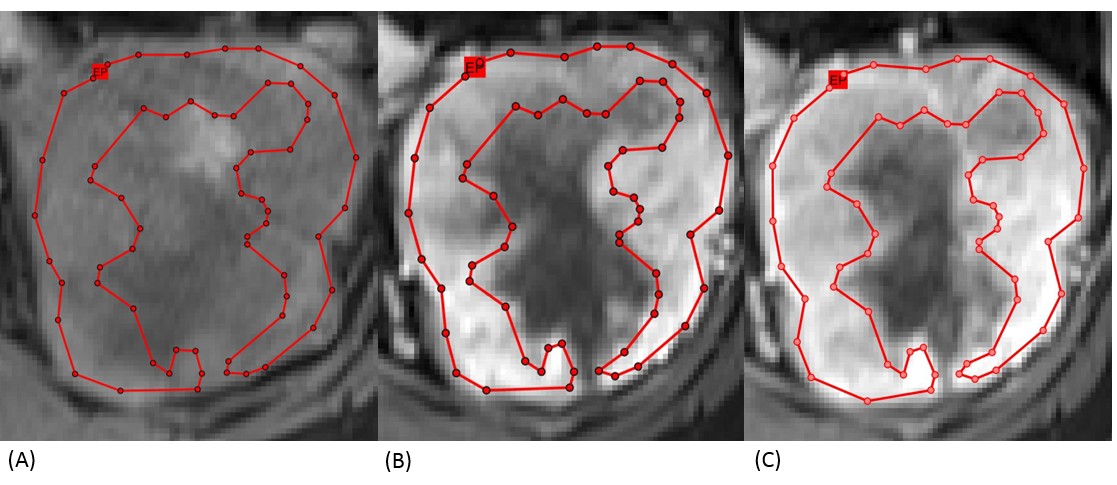
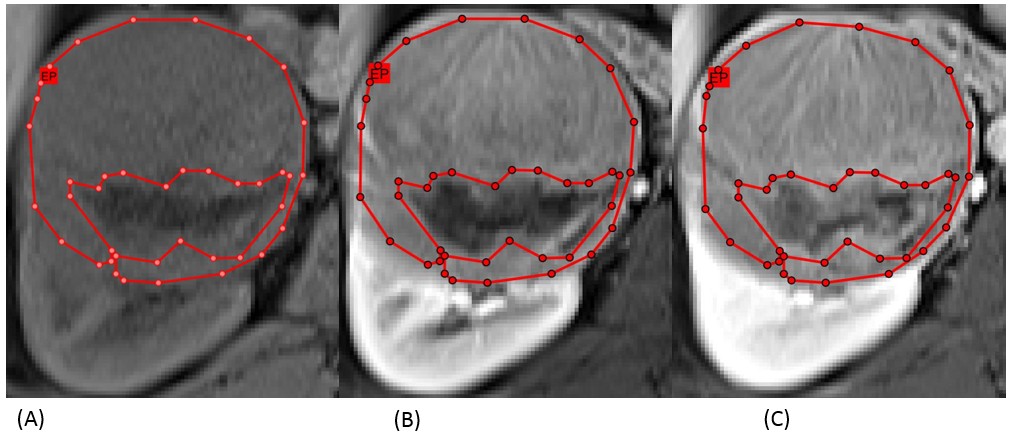
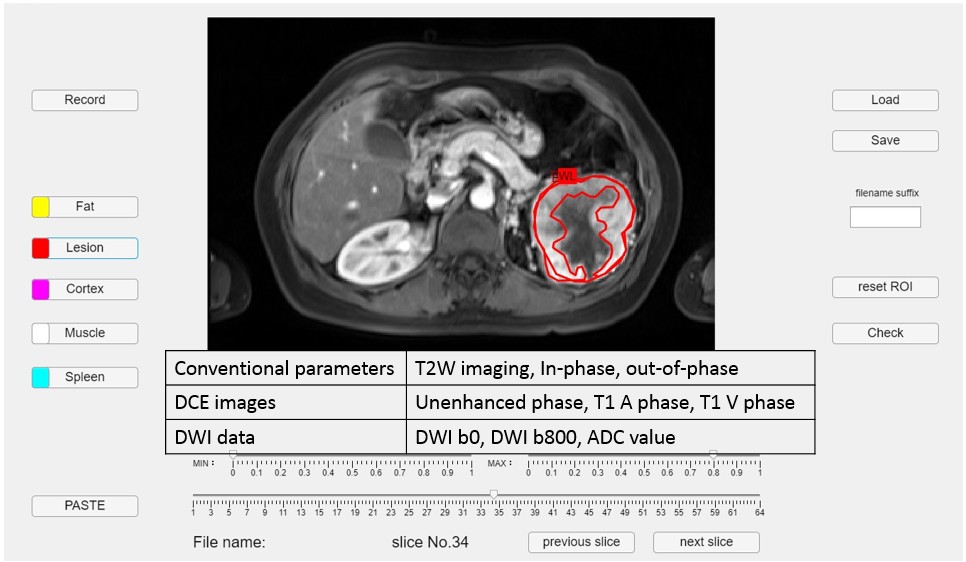
We retrospectively reviewed 11 patients with ccRCC and 12 patients with ncRCC pathologically proven. All patients performed MRI with nine pulse sequences and the details of these sequences were demonstrated in Figure 3. Whole-lesion (WL) ROI was drawn on the largest image of the entire tumor area to obtain histogram parameters, including mean intensity, standard deviation (SD), 10th, 25th, 50th, 75th, 90th percentiles, skewness, kurtosis, and entropy. After carefully comparing the DCE images, including the unenhanced phase, the arterial (T1 A phase), and the venous (T1 V phase) images, we draw the enhancing-part (EP) ROI manually to exclude the area of hemorrhage, necrosis, or cystic change. Figures 1 and 2 demonstrate the conduction of EP ROI in ccRCC and ncRCC. The histogram analysis was performed by a radiologist with 7 years of experience in genitourinary diagnostic imaging. The graphical user interface (GUI) used for ROI selection with MATLAB program was shown in Figure 3.The Mann-Whitney U test was used to compare the parameters between WL ROI and EP ROI in differential ccRCC and ncRCC. The results were considered statistically significant when the p-value was < 0.05. All parameters which showed significant P value underwent receiver-operating characteristic (ROC) curve analysis to generate the area under the curve (AUC) and optimal cut-off value. Only the parameters which showed a high-class separation capacity i.e. AUC > 0.7, were selected.
RESULTS
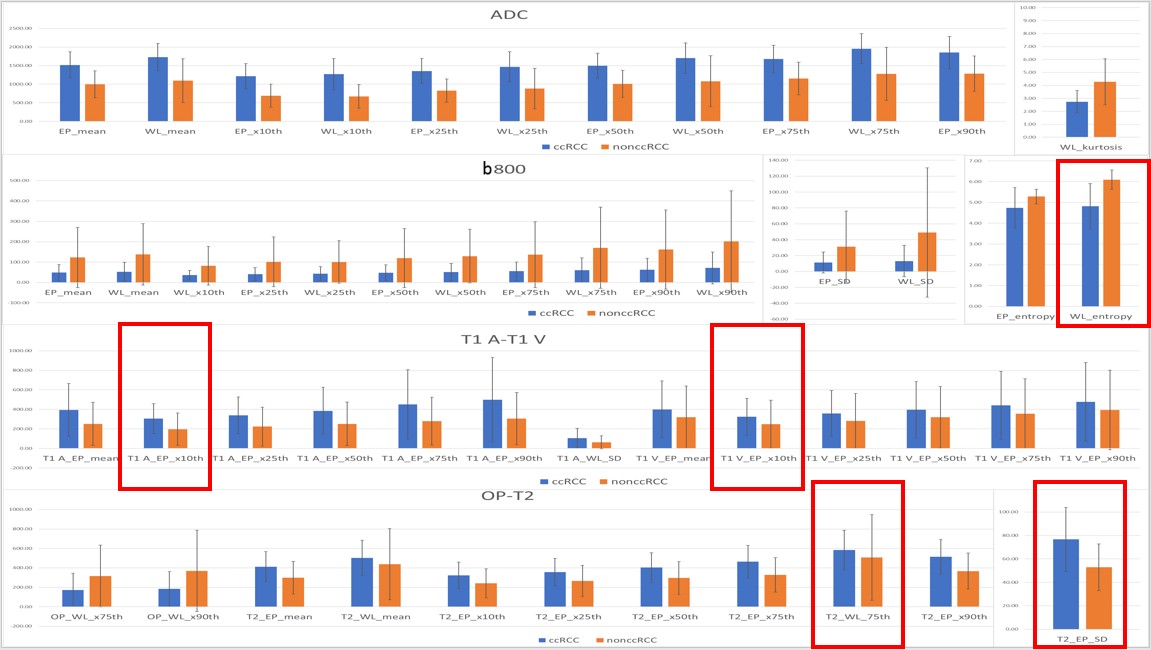
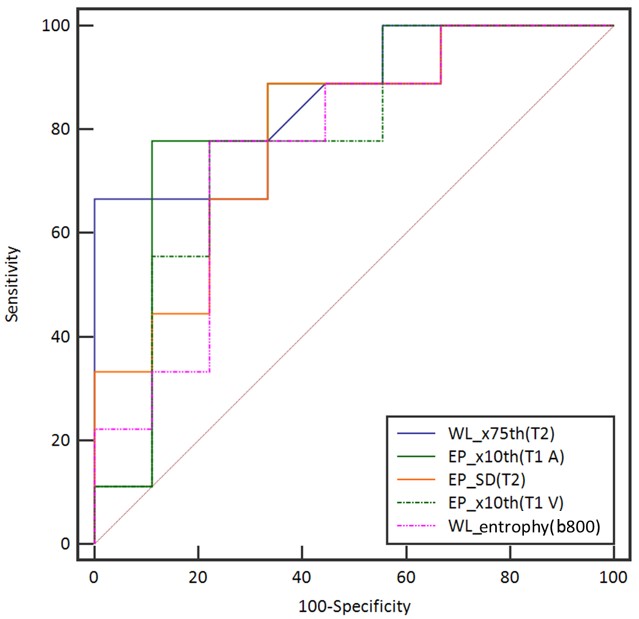
After Mann–Whitney analysis, the metrics with significant P values were identified in Figure 4. This generated a total of 51 metrics across all the sequences to be significant in differentiating ccRCC from ncRCC (nine on T2W imaging, fifteen on DWI b800, twelve on the ADC maps, seven on the T1 A phase images, six on the T1 V phase images, two on the out-of-phase sequences). EP ROI exhibited 32 metrics across all the sequences and WL ROI exhibited 19 metrics across all the sequences.The best performing histogram metrics in differentiating ccRCC from ncRCC for each sequence included (AUC > 0.7): 10th percentiles (0.81) of EP ROI on the T1 A phase images, 10th percentiles (0.78) of EP ROI on the T1 V phase images, SD (0.78) of EP ROI on the T2W images, entropy (0.76) of WL ROI on the DWI b800 images, and 75th percentiles (0.75) of WL ROI on the T2W images. The ROC curves for histogram parameters in differentiating ccRCC and ncRCC are shown in Figure 5.
DISCUSSION
In our study, we found the five most important metrics in differentiating ccRCC from ncRCC, including the MR sequences of T2W images, the DCE images, and DWI data. These results are in agreement with those from both Kay et al. 10 and Mytsyk et al. 11, suggesting that ccRCC typically has a high signal intensity in T2W images, avid contrast enhancement, and higher ADC value.In the histogram parameters analysis, the most optimal metrics are 10th percentiles of EP ROI on the T1 A and V phase images. These results indicate the selection of EP ROI rather than WL ROI providing true information of perfusion and angiogenesis of the lesions, which bring the most diagnostic value. However, the entropy of WL ROI on the DWI b800 images also showed excellent abilities for differential. The possible explanation was that ncRCC was prone to bleeding. The WL ROI of ncRCC contained heterogeneous signal intensity caused by bleeding on DWI images made entropy more prominent under this condition. In these five metrics with high-class separation capacity, we found two metrics related to WL ROI and three metrics related to EP ROI, which meant that EP ROI was not superior to WL ROI for diagnosis.
CONCLUSION
Both EP ROI and WL ROI had a certain degree of diagnostic value in the MR histogram analysis for differentiating ccRCC from ncRCC. Five MR histogram metrics showed excellent diagnostic performance (AUC > 0.7). The addition of these two ROI measurements of histogram analysis to routine MRI evaluation of renal mass may benefit for diagnosisAcknowledgements
No acknowledgement found.References
1. Posadas, E. M., Limvorasak, S., & Figlin, R. A. (2017). Targeted therapies for renal cell carcinoma. Nature reviews. Nephrology, 13(8), 496–511. https://doi.org/10.1038/nrneph.2017.82
2. Ahrens, M., Scheich, S., Hartmann, A., Bergmann, L., & IAG-N Interdisciplinary Working Group Kidney Cancer of the German Cancer Society (2019). Non-Clear Cell Renal Cell Carcinoma - Pathology and Treatment Options. Oncology research and treatment, 42(3), 128–135. https://doi.org/10.1159/000495366 3. Lopes Vendrami, C., Parada Villavicencio, C., DeJulio, T. J., Chatterjee, A., Casalino, D. D., Horowitz, J.M., Oberlin, D.T., Yang, G.Y., Nikolaidis, P., & Miller, F.H. (2017). Differentiation of Solid Renal Tumors with Multiparametric MR Imaging. RadioGraphics, 37(7), 2026–2042. https://doi.org/10.1148/rg.2017170039
4. Hötker, A. M., Mazaheri, Y., Wibmer, A., Karlo, C. A., Zheng, J., Moskowitz, C. S., Tickoo, S. K., Russo, P., Hricak, H., & Akin, O. (2017). Differentiation of Clear Cell Renal Cell Carcinoma From Other Renal Cortical Tumors by Use of a Quantitative Multiparametric MRI Approach. AJR Am J Roentgenol 208(3), W85–W91. https://doi.org/10.2214/AJR.16.16652
5. Johnson, B. A., Kim, S., Steinberg, R. L., de Leon, A. D., Pedrosa, I., & Cadeddu, J. A. (2019). Diagnostic performance of prospectively assigned clear cell Likelihood scores (ccLS) in small renal masses at multiparametric magnetic resonance imaging. Urologic oncology, 37(12), 941–946. https://doi.org/10.1016/j.urolonc.2019.07.023
6. Li, H., Li, A., Zhu, H., Hu, Y., Li, J., Xia, L., Hu, D., Kamel, I. R., & Li, Z. (2019). Whole-Tumor Quantitative Apparent Diffusion Coefficient Histogram and Texture Analysis to Differentiation of Minimal Fat Angiomyolipoma from Clear Cell Renal Cell Carcinoma. Academic radiology, 26(5), 632–639. https://doi.org/10.1016/j.acra.2018.06.015
7. Han, X., Suo, S., Sun, Y., Zu, J., Qu, J., Zhou, Y., Chen, Z., & Xu, J. (2017). Apparent diffusion coefficient measurement in glioma: Influence of region-of-interest determination methods on apparent diffusion coefficient values, interobserver variability, time efficiency, and diagnostic ability. Journal of magnetic resonance imaging : JMRI, 45(3), 722–730. https://doi.org/10.1002/jmri.25405
8. Wang, H. Y., Su, Z. H., Xu, X., Sun, Z. P., Duan, F. X., Song, Y. Y., Li, L., Wang, Y. W., Ma, X., Guo, A. T., Ma, L., & Ye, H. Y. (2016). Dynamic Contrast-enhanced MR Imaging in Renal Cell Carcinoma: Reproducibility of Histogram Analysis on Pharmacokinetic Parameters. Scientific reports, 6, 29146. https://doi.org/10.1038/srep29146
9. Goyal, A., Razik, A., Kandasamy, D., Seth, A., Das, P., Ganeshan, B., & Sharma, R. (2019). Role of MR texture analysis in histological subtyping and grading of renal cell carcinoma: a preliminary study. Abdominal radiology (New York), 44(10), 3336–3349. https://doi.org/10.1007/s00261-019-02122-z
10. Kay, F. U., Canvasser, N. E., Xi, Y., Pinho, D. F., Costa, D. N., Diaz de Leon, A., Khatri, G., Leyendecker, J. R., Yokoo, T., Lay, A. H., Kavoussi, N., Koseoglu, E., Cadeddu, J. A., & Pedrosa, I. (2018). Diagnostic Performance and Interreader Agreement of a Standardized MR Imaging Approach in the Prediction of Small Renal Mass Histology. Radiology, 287(2), 543-553. https://doi.org/10.1148/radiol.2018171557
11. Mytsyk, Y., Dutka, I., Borys, Y., Komnatska, I., Shatynska-Mytsyk, I., Farooqi, A. A., Gazdikova, K., Caprnda, M., Rodrigo, L., & Kruzliak, P. (2017). Renal cell carcinoma: applicability of the apparent coefficient of the diffusion-weighted estimated by MRI for improving their differential diagnosis, histologic subtyping, and differentiation grade. Int Urol Nephrol, 49(2), 215-224. https://doi.org/10.1007/s11255-016-1460-3
Figures