3678
Quantitative Susceptibility Mapping as an Alternative to CT for Localizing Gold Intraprostatic Fiducial Markers1ARC Training Centre for Innovation in Biomedical Imaging Technology, The University of Queensland, St Lucia, Australia, 2Centre for Advanced Imaging, The University of Queensland, St Lucia, Australia, 3Department of Radiation Oncology, Calvary Mater Hospital, Newcastle, Australia, 4School of Information and Physical Sciences, University of Newcastle, Newcastle, Australia, 5High Field MR Center, Department of Biomedical Imaging and Image-Guided Therapy, Medical University of Vienna, Vienna, Austria, 6Department of Neurology, Medical University of Graz, Graz, Austria, 7Siemens Healthcare Pty Ltd, Brisbane, Australia, 8School of Information Technology and Electrical Engineering, The University of Queensland, St Lucia, Australia
Synopsis
Gold fiducial markers (FMs) for prostate radiotherapy are commonly localized using Computed Tomography (CT), though interest in MR-only workflows is growing. One current limitation with magnitude-based MR-only workflows is the ability to distinguish FMs from blood products and calcifications because all appear as signal voids. Quantitative Susceptibility Mapping (QSM) separates sources based on their susceptibility, and may be a potential solution. We apply the QSMxT pipeline to gradient-echo images of a prostate cancer patient with FMs and a calcification. We found that QSM provided a contrast that could differentiate the FMs from calcifications to a degree comparable to CT.
Introduction
Intraprostatic gold fiducial markers (FMs) ensure the accurate and precise application of image-guided radiation therapy for prostate cancer patients1. Currently, FMs are localized using Computed Tomography (CT). However, MR-only radiotherapy has potential as a simplified workflow that eliminates the need for a CT scan and potentially inaccurate CT-MRI registrations, reduces costs and patient exposure to ionizing radiation, and improves patient comfort2. Multi-sequence MRI datasets have been demonstrated to localize FMs with a similar precision to CT3, though misclassification of FMs with blood products using conventional MRI is too prevalent for the benefit to outweigh the risk4. A recent MRI technique, Quantitative Susceptibility Mapping (QSM), may have potential in unambiguously localizing FMs based on their magnetic susceptibility and morphology, where conventional MRI contains only signal voids and has little discriminative power. To date, QSM has mostly been applied to brain imaging applications5, though with the development of more robust QSM processing tools, its potential in clinical applications across the body is emerging. In this abstract, we apply an open-source, automated and robust QSM processing pipeline, QSMxT6 (https://github.com/QSMxT/QSMxT), to an acquisition of a prostate cancer patient with FMs and a calcification, comparing the results to CT.Methods
Data were acquired from a patient with prostate cancer using a bipolar gradient echo (GRE) sequence at 1.4 mm3 isotropic resolution, with equispaced TEs=2.46/4.92/7.39/9.84/12.3/14.8/17.22 ms, TR=25 ms, TA=9:53, and FA=45°. Data were acquired using a MAGNETOM Skyra 3T scanner (Siemens Healthcare, Erlangen, Germany) with a 32-channel spine coil and 18-channel body coil on software version VE11. Phased array channels were combined using the pre-scan normalize plus adaptive combine approach7. QSM was reconstructed using QSMxT6, which uses TGV-QSM8 for the phase unwrapping, background field correction, and dipole inversion steps. Two-pass reconstruction was enabled using phase-based masking, with a threshold parameter of 20% and a mask-filling strength of 1 dilation step. A T2* map was produced using NumART2Star9, and Susceptibility Weighted Imaging (SWI) was produced using CLEAR-SWI10.A CT scan of the same patient was also acquired for comparison with a slice thickness of 2 mm, an image matrix size of 512x512, and kVp=120 kV. Data were acquired using a Siemens SOMATOM Confidence CT scanner (Siemens Healthcare, Erlangen, Germany) on software version VB10A. CT was registered to the MRI scan manually using ITK-SNAP11.
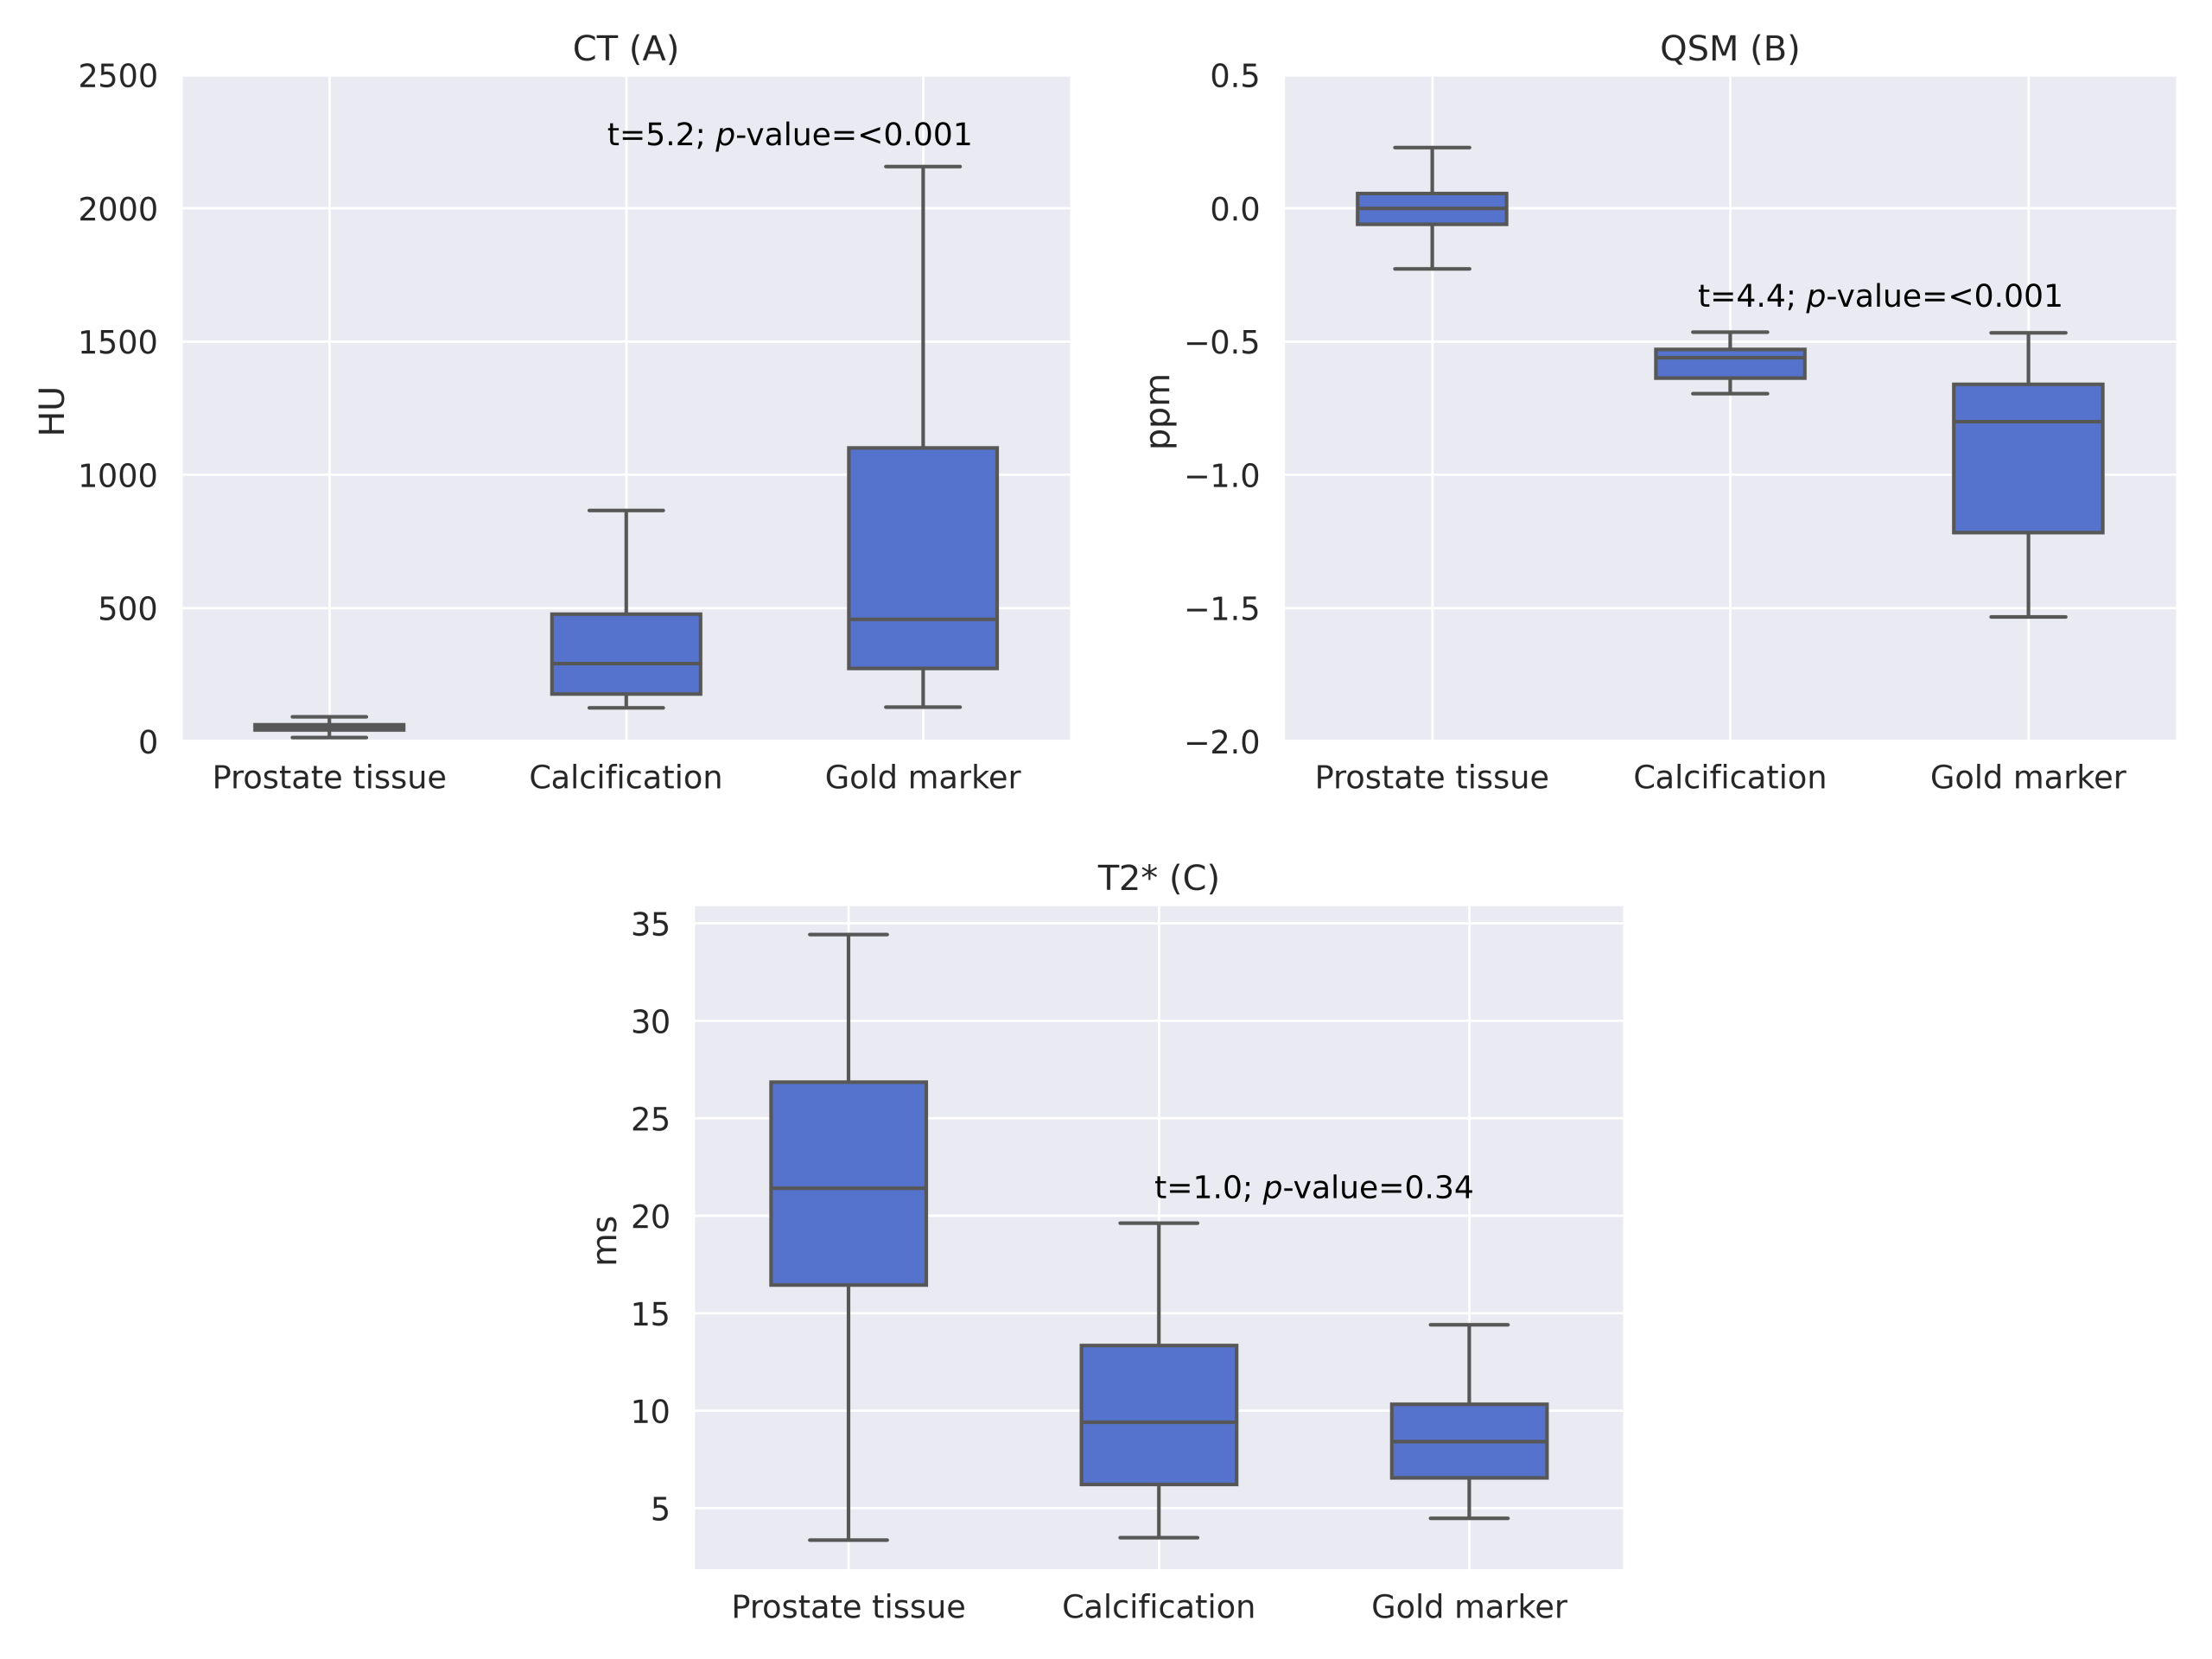
For quantitative analysis of the CT numbers, magnetic susceptibility and T2* times of the prostate tissue, FMs and calcification, rough segmentations were first made on the QSM and CT images using ITK-SNAP. The FM and calcification segmentations were then refined such that only voxels deviating over five standard deviations from the prostate tissue values were included in each segmentation. For T2* measurements, the QSM segmentations were used and further refined such that only plausible T2* values (positive and less than twice the final echo time) were included. Boxplots were then generated and a Welch’s t-test was conducted for statistical comparison between groups.
Results
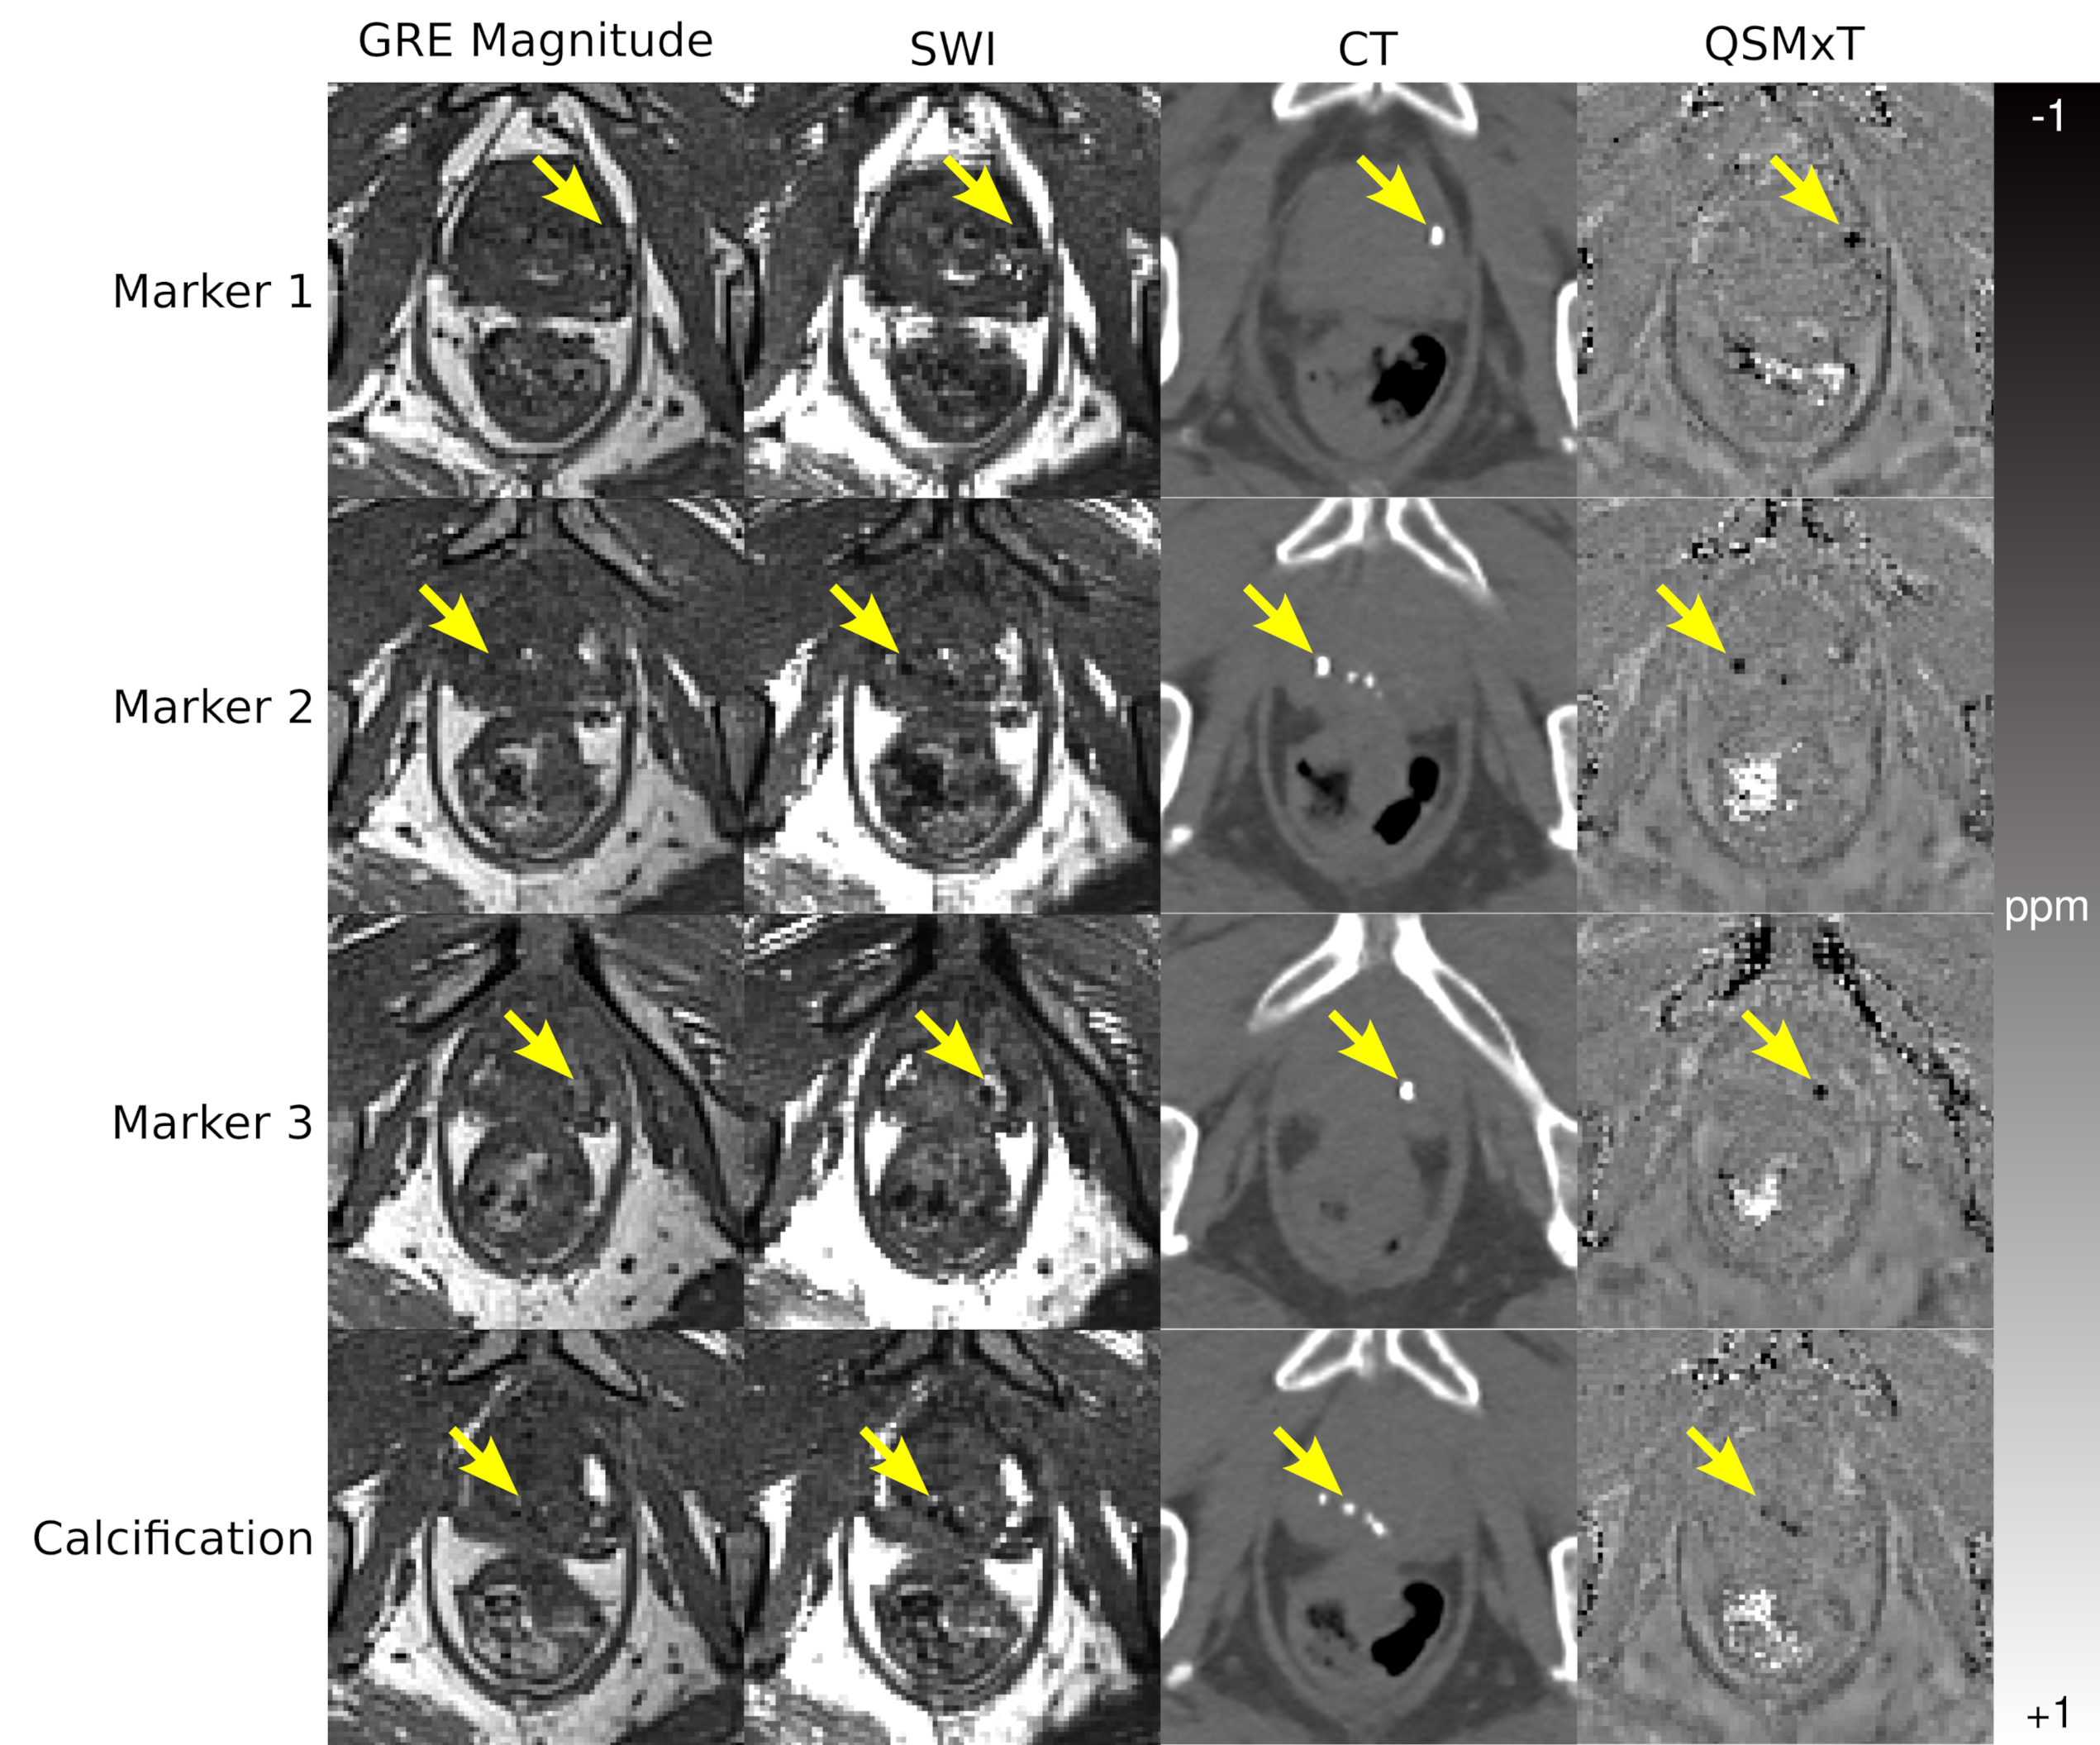
While the GRE magnitude does not show the FMs or calcification clearly, and the SWI has poor contrast between prostate tissue and susceptibility sources, the CT images and QSMxT reconstruction depict the sources with comparable clarity and contrast (see Figure 1).The quantitative results indicate that the CT and susceptibility measurements in each region both have improved contrast compared with T2* measurements, allowing prostate tissue, calcifications and FMs to be distinguished quantitatively (see Figure 2). Further, the Welch t-test computed between the calcification and FM regions was significant for the CT images and QSM, with no significant difference found in the T2* map (see Figure 2, overlaid text).
Discussion and conclusions
The results indicate that QSM can distinguish clinically relevant sources in the prostate to a degree comparable to CT, where standard magnitude-based imaging, SWI, and T2* maps do not, with further distinction achieved using quantitative susceptibility information derived using segmentations. Although the patient imaged does not have prostatic blood deposits, they would appear hyperintense and could be clearly identified and distinguished from calcifications and FMs.The findings from this study indicate that an MR-only workflow for prostate radiotherapy may be feasible using an appropriate MRI sequence coupled with a robust QSM pipeline. This will enable a more streamlined clinical workflow for prostate radiotherapy, as well as reduced costs, reduced patient exposure to ionizing radiation, and improved patient comfort. Future work will involve acquiring data from more patients to investigate localization accuracy and precision using QSM.
Acknowledgements
This research was funded by the Australian Research Council Training Centre for Innovation in Biomedical Imaging Technology (IC170100035). Additional support was provided by the National Imaging Facility and QCIF. SR acknowledges funding from the Marie Skłodowska-Curie Action MS-fMRI-QSM 794298.References
1. S. Straub et al., ‘Potential of quantitative susceptibility mapping for detection of prostatic calcifications’, Journal of Magnetic Resonance Imaging, vol. 45, no. 3, pp. 889–898, 2017, doi: 10.1002/jmri.25385.
2. T. Nyholm, M. Nyberg, M. G. Karlsson, and M. Karlsson, ‘Systematisation of spatial uncertainties for comparison between a MR and a CT-based radiotherapy workflow for prostate treatments’, Radiation Oncology, vol. 4, no. 1, p. 54, Nov. 2009, doi: 10.1186/1748-717X-4-54.
3. M. Maspero et al., ‘Evaluation of gold fiducial marker manual localisation for magnetic resonance-only prostate radiotherapy’, Radiation Oncology, vol. 13, no. 1, p. 105, Jun. 2018, doi: 10.1186/s13014-018-1029-7.
4. N. M. Ung and L. Wee, ‘Fiducial registration error as a statistical process control metric in image-guidance radiotherapy with fiducial markers’, Phys. Med. Biol., vol. 56, no. 23, pp. 7473–7485, Nov. 2011, doi: 10.1088/0031-9155/56/23/009.
5. A. Deistung, F. Schweser, and J. R. Reichenbach, ‘Overview of quantitative susceptibility mapping’, NMR in Biomedicine, vol. 30, no. 4, p. e3569, 2017.
6. A. W. Stewart et al., ‘QSMxT: Robust masking and artifact reduction for quantitative susceptibility mapping’, Magnetic Resonance in Medicine, 2021, doi: 10.1002/mrm.29048.
7. Jellúš Vladimír, Kannengiesser Stephan AR. Adaptive coil combination using a body coil scan as phase reference in ISMRM 22nd Annual Meeting & Exhibition, Milan, Italy 2014. cds.ismrm.org/.../4406.pdf.
8. C. Langkammer et al., ‘Fast quantitative susceptibility mapping using 3D EPI and total generalized variation’, NeuroImage, vol. 111, pp. 622–630, May 2015, doi: 10.1016/j.neuroimage.2015.02.041.
9. K. Eckstein. MRIResearchTools. github.com/korbinian90/MriResearchTools.jl.
10. K. Eckstein et al., ‘Improved susceptibility weighted imaging at ultra-high field using bipolar multi-echo acquisition and optimized image processing: CLEAR-SWI’, NeuroImage, vol. 237, p. 118175, Aug. 2021, doi: 10.1016/j.neuroimage.2021.118175.
11. P. A. Yushkevich et al., ‘User-guided 3D active contour segmentation of anatomical structures: Significantly improved efficiency and reliability’, NeuroImage, vol. 31, no. 3, pp. 1116–1128, Jul. 2006, doi: 10.1016/j.neuroimage.2006.01.015.
Figures