3669
Texture Analysis of Synthetic MRI Combined with DWI and ADC for Characterization of Lesions of the Prostate
Hao Cheng1, Pu-Yeh Wu2, Ming Liu3, Chunmei Li1, and Min Chen1
1Department of Radiology, Beijing Hospital, National Center of Gerontology, Institute of Geriatric Medicine, Chinese Academy of Medical Sciences, Beijing, China, 2GE Healthcare, Beijing, China, 3Department of Urology, Beijing Hospital, National Center of Gerontology, Institute of Geriatric Medicine, Chinese Academy of Medical Sciences, Beijing, China
1Department of Radiology, Beijing Hospital, National Center of Gerontology, Institute of Geriatric Medicine, Chinese Academy of Medical Sciences, Beijing, China, 2GE Healthcare, Beijing, China, 3Department of Urology, Beijing Hospital, National Center of Gerontology, Institute of Geriatric Medicine, Chinese Academy of Medical Sciences, Beijing, China
Synopsis
We extracted 104 texture features from relaxation maps of synthetic MRI, DWI and ADC in each of 603 prostate lesions from 297 patients, and compared the diagnostic performance of models based on texture features with mean quantitative values in discriminating PCa from benign lesions and in discriminating csPCa from clinically insignificant lesions. Models of synthetic MRI+DWI+ADC has the highest diagnostic performance in discriminating PCa from SH and noncancerous PZ, and in discriminating csPCa from SH+Gl6 and noncancerous PZ+Gl6. This suggested that texture analysis of synthetic MRI combined with diffusion images can provide better performance in the characterization of prostate lesions.
Introduction
Prostate cancer (PCa) is the second most frequent cancer and the fifth leading cause of cancer death among men in 2020[1]. Current national guidelines in Europe highlight the primacy of multiparametric MRI in the management of men with suspected PCa[2]. However, due to the lack of objective and quantitative parameters, the interobserver agreement is still greatly influenced by different levels of reader experience in interpreting prostate MRI[3]. Recently, a novel MRI technique, synthetic MRI, has been proposed to provide absolute quantification of T1, T2, and PD maps simultaneously in a single scan[4, 5]. One previous study has shown that relaxation maps derived from synthetic MRI were helpful for discriminating prostate cancer from other benign pathologies[6]. Additionally, a series of studies have shown that texture analysis of apparent diffusion coefficient (ADC) may be a valuable tool in predicting PCa[7-9]. However, whether texture analysis of relaxation maps of synthetic MRI combined with diffusion-weighted imaging (DWI) and ADC can provide better performance comparing to mean relaxation values in the characterization of prostate lesions remains unknown.Methods
297 patients (69 ± 8 years) with prostate lesions and corresponding histological results were included in this retrospective study. All MR examinations were performed on a 3.0 T MRI scanner (SIGNA Pioneer; GE Healthcare, Milwaukee, WI). Synthetic MRI with two echo times (14/92 ms) and four saturation delay times (170/670/1840/3840 ms), and DWI with b values of 50 and 1400 s/mm2 were acquired. ADC maps were automatically generated from DWI images on the scanner console. A software SyMRI (SyntheticMR, Linköping, Sweden) was used to generate quantitative relaxation maps from synthetic MRI raw data. Four kinds of pathological types were identified, including PCa, stromal hyperplasia (SH), glandular hyperplasia (GH), and noncancerous peripheral zone (PZ). Clinically significant cancers (csPCa) were defined as Gleason score ≥ 7, while clinically insignificant lesions were further divided into SH+Gleason 6 cancers (Gl6), GH+Gl6, and noncancerous PZ+Gl6. We extracted 104 texture features from relaxation maps of synthetic MRI, DWI and ADC. The differences of texture features between PCa and other benign entities were assessed using the independent sample t-test or Mann–Whitney U-test. Three multivariate regression models were built based on texture features from synthetic MRI, DWI+ADC, and synthetic MRI+DWI+ADC. We then performed ROC analysis to compare the diagnostic performance of these three models together with mean quantitative values in differentiating PCa vs benign lesions, and csPCa vs clinically insignificant lesions.Results
A total of 603 lesions were identified. Pathological results revealed there were 108 PCa, 180 SH, 186 GH, and 129 noncancerous PZ. In 108 PCa lesions, 11 lesions were Gl6 and 97 lesions were csPCa. One representative result was shown in Figure 1. Table 1 and 2 summarized the diagnostic performance comparison results in differentiating PCa vs benign lesions, and csPCa vs clinically insignificant lesions, respectively. The AUC of the model of synthetic MRI+DWI+ADC was the highest in discriminating PCa from noncancerous PZ, SH, and GH (Figure 2). The same model also had the highest AUC in discriminating csPCa from noncancerous PZ+Gl6, SH+Gl6, and GH+Gl6 (Figure 3). PCa vs noncancerous PZ: The AUCs of three models were higher than that of mean values of them (all P < 0.0001), and the AUC of the model of synthetic MRI+DWI+ADC was higher than that of the model of synthetic MRI and DWI+ADC (P = 0.0008 and P = 0.0104). PCa vs SH: The AUCs of the model of synthetic MRI and synthetic MRI+DWI+ADC were higher than that of mean values of them (P = 0.0003 and P = 0.0006). The AUC of the model of synthetic MRI+DWI+ADC was higher than that of the model of synthetic MRI and DWI+ADC (P = 0.0248 and P = 0.0027). PCa vs GH: The AUC of the model of DWI+ADC was higher than that of mean values of ADC (P = 0.0277), and the AUC of the model of synthetic MRI+DWI+ADC was significantly higher than that of the model of DWI+ADC (P = 0.0266). csPCa vs Noncancerous PZ+Gl6: Three models had higher AUC than mean values of them (all P < 0.0001), and the model of synthetic MRI+DWI+ADC had a higher AUC than the model of synthetic MRI (P = 0.0005). csPCa vs SH+Gl6: The model of synthetic MRI and synthetic MRI+DWI+ADC had higher AUC than mean values of them (P = 0.0024 and P = 0.0001), and the model of synthetic MRI+DWI+ADC had a higher AUC than the model of synthetic MRI and DWI+ADC (P = 0.0021 and P = 0.0170). csPCa vs GH+Gl6: The model of synthetic MRI had higher AUC than its mean values (P = 0.0181).Discussion and Conclusions
This study compared texture analysis of synthetic MRI, DWI+ADC and synthetic MRI+DWI+ADC with mean values of them in discriminating PCa with other benign lesions, and in discriminating csPCa with other clinically insignificant lesions. We found that the AUC of the model of synthetic MRI+DWI+ADC is generally higher than AUCs of other models and mean quantitative values. These results suggested that texture analysis of synthetic MRI combined with DWI and ADC can provide better performance in the characterization of lesions of the prostate.Acknowledgements
No acknowledgement found.References
1. Sung, H., et al., Global Cancer Statistics 2020: GLOBOCAN Estimates of Incidence and Mortality Worldwide for 36 Cancers in 185 Countries. CA Cancer J Clin, 2021. 71(3): p. 209-249.2. Richenberg, J., et al., The primacy of multiparametric MRI in men with suspected prostate cancer. Eur Radiol, 2019. 29(12): p. 6940-6952.
3. Muller, B.G., et al., Prostate Cancer: Interobserver Agreement and Accuracy with the Revised Prostate Imaging Reporting and Data System at Multiparametric MR Imaging. Radiology, 2015. 277(3): p. 741-50.
4. Warntjes, J.B., et al., Rapid magnetic resonance quantification on the brain: Optimization for clinical usage. Magn Reson Med, 2008. 60(2): p. 320-9.
5. Bobman, S.A., et al., Cerebral magnetic resonance image synthesis. AJNR Am J Neuroradiol, 1985. 6(2): p. 265-9.
6. Cui, Y., et al., Diagnosis and Grading of Prostate Cancer by Relaxation Maps From Synthetic MRI. J Magn Reson Imaging, 2020. 52(2): p. 552-564.
7. Xiong, H., X. He, and D. Guo, Value of MRI texture analysis for predicting high-grade prostate cancer. Clin Imaging, 2021. 72: p. 168-174.
8. Baek, T.W., et al., Texture analysis on bi-parametric MRI for evaluation of aggressiveness in patients with prostate cancer. Abdom Radiol (NY), 2020. 45(12): p. 4214-4222.
9. Hameed, M., et al., The clinical utility of prostate cancer heterogeneity using texture analysis of multiparametric MRI. Int Urol Nephrol, 2019. 51(5): p. 817-824.
Figures
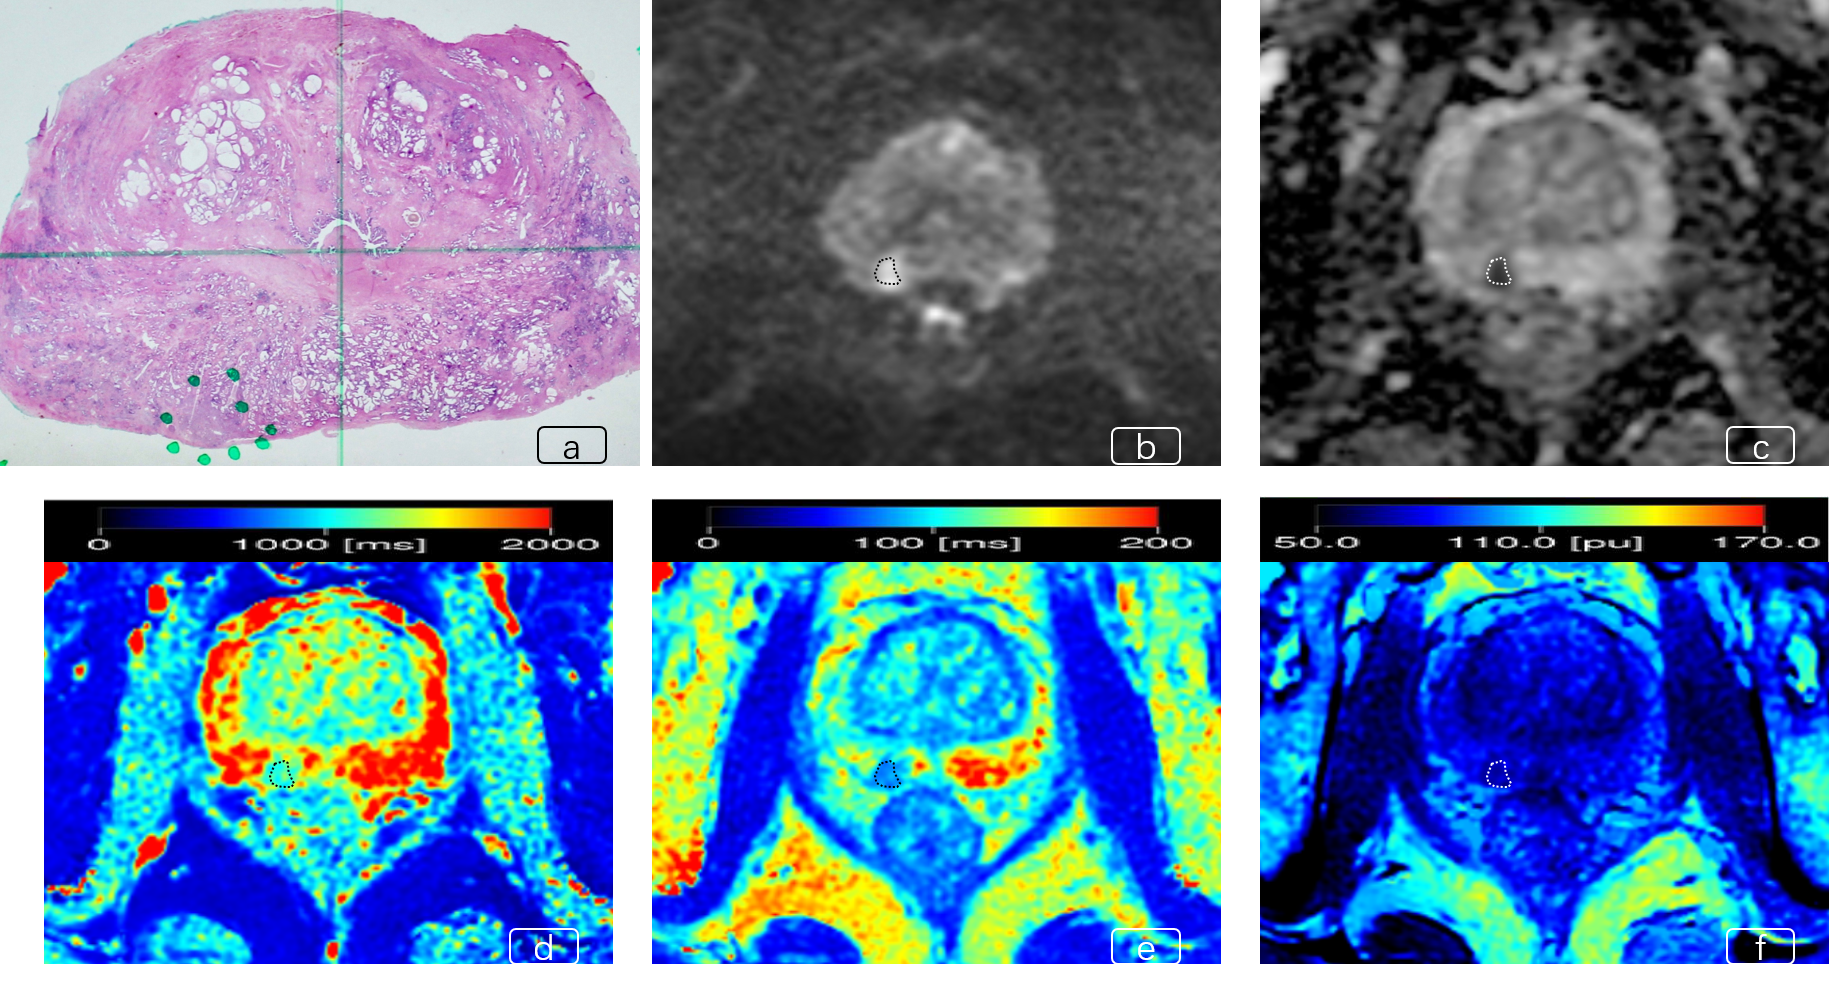
Figure 1. A 64-year-old man with PCa. (a) whole-mount section shows the PCa lesion is located in the right PZ with Gleason score of 3 + 4, (b) DWI (b=1400) shows a markedly hyperintense signal, (c) ADC, (d) T1, (e) T2, and (f) PD show focal hypointense signal
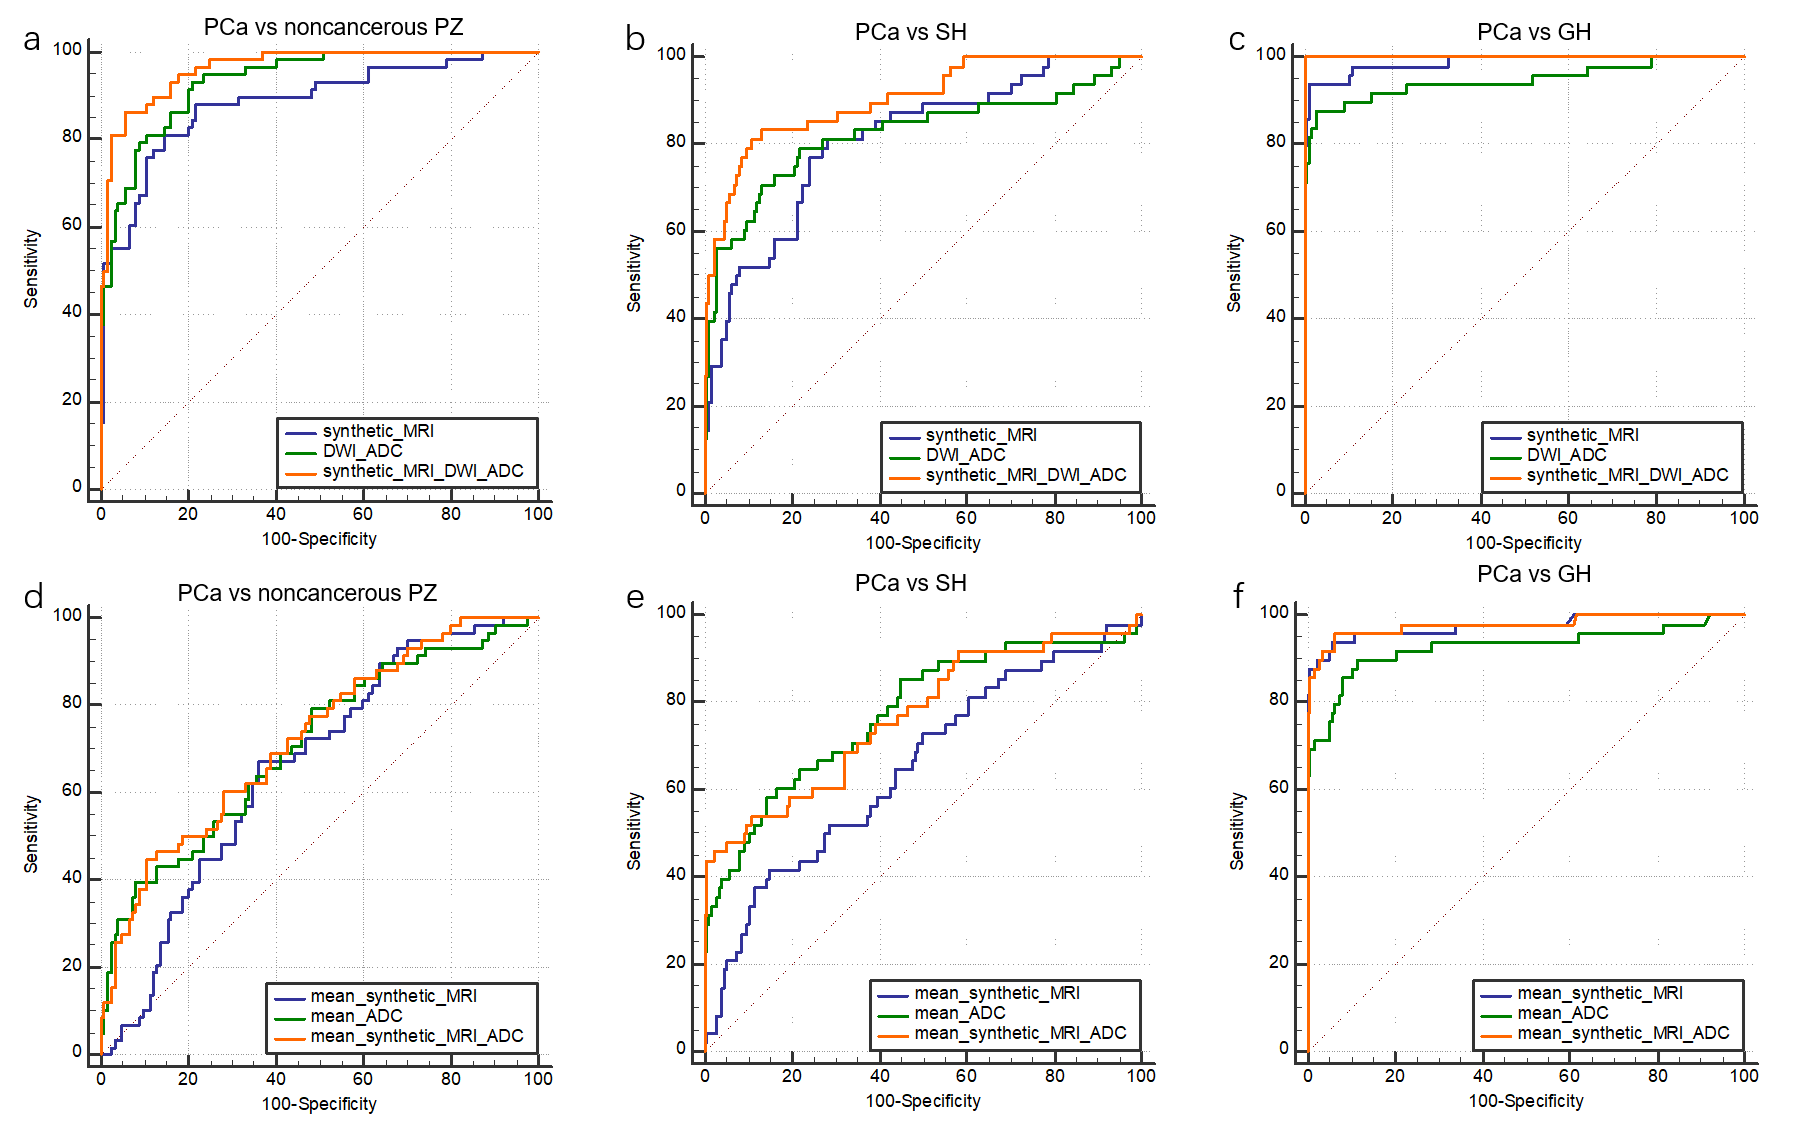
Figure 2. ROC curves demonstrate the
diagnostic effectiveness of PCa of the texture analysis of (a) synthetic MRI, (b) DWI+ADC, and (c) synthetic
MRI+DWI+ADC, and mean values of (d) synthetic MRI, (e) ADC, (f)
synthetic MRI+ADC.
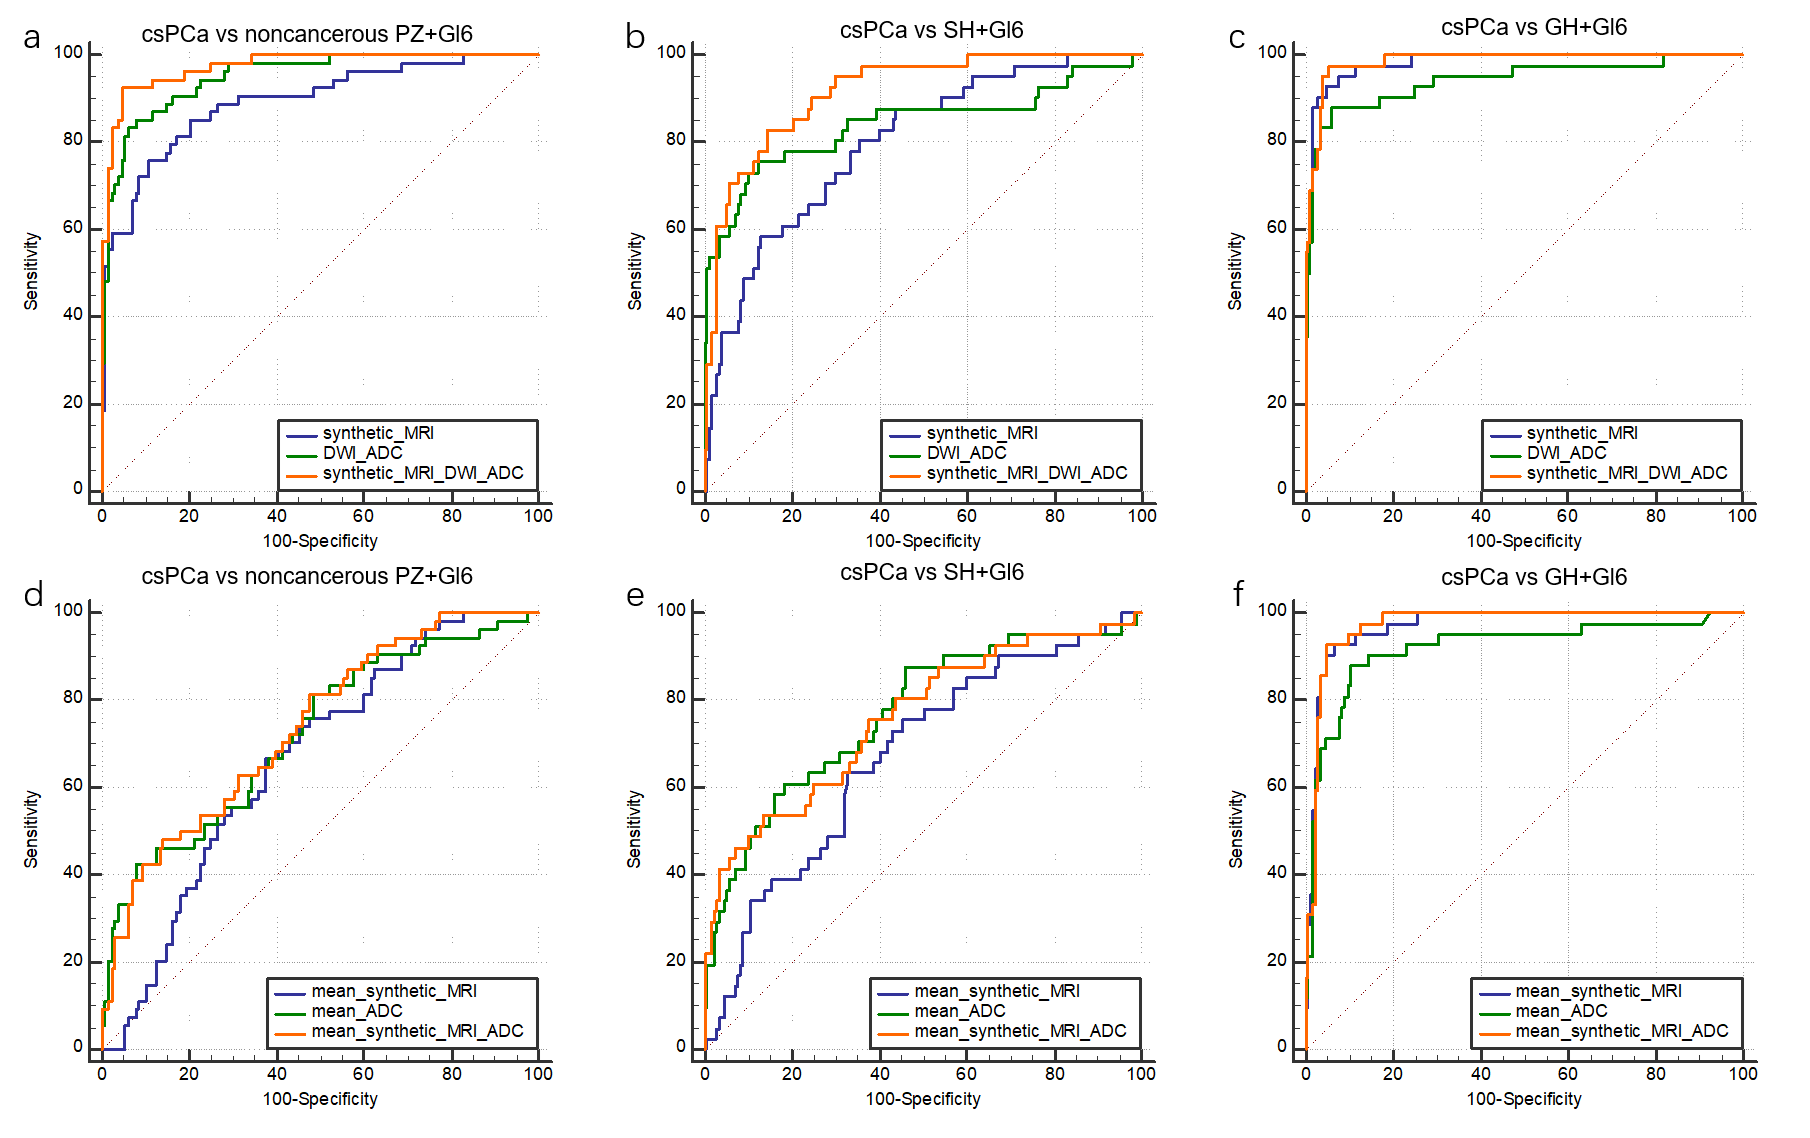
Figure 3. ROC curves demonstrate the diagnostic effectiveness of csPCa of the texture analysis of (a) synthetic MRI, (b) DWI+ADC, and (c) synthetic MRI+DWI+ADC, and mean values of (d) synthetic MRI, (e) ADC, (f) synthetic MRI+ADC.
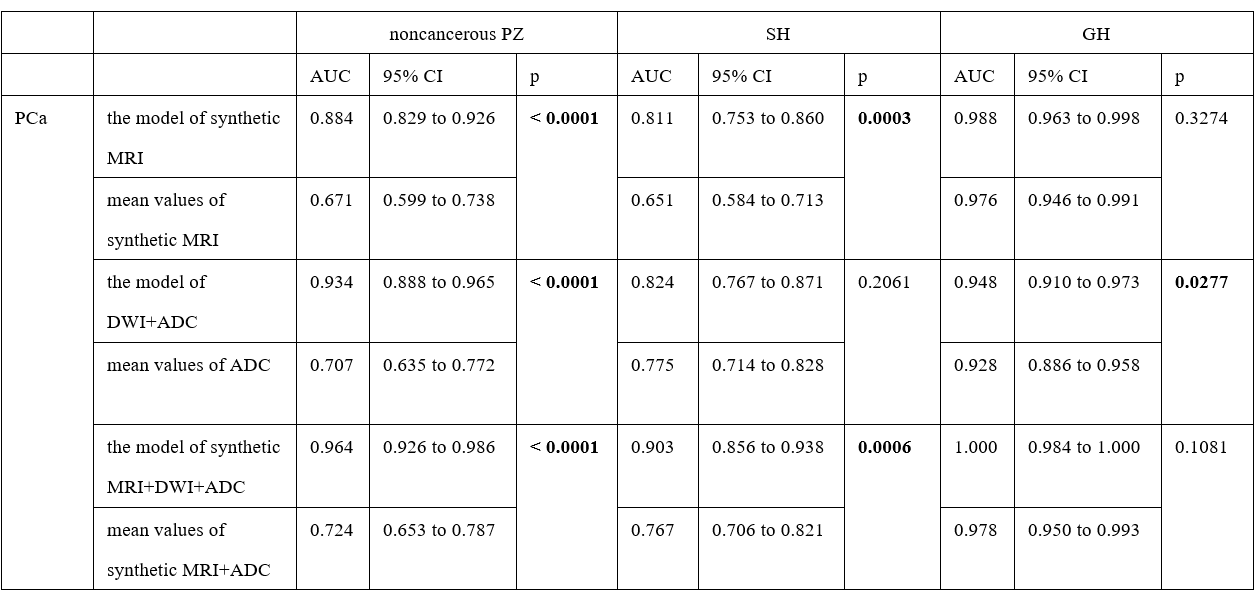
Table 1. Diagnostic performance of texture analysis of synthetic MRI, DWI+ADC, and synthetic MRI+DWI+ADC and mean values of them in predicting PCa.
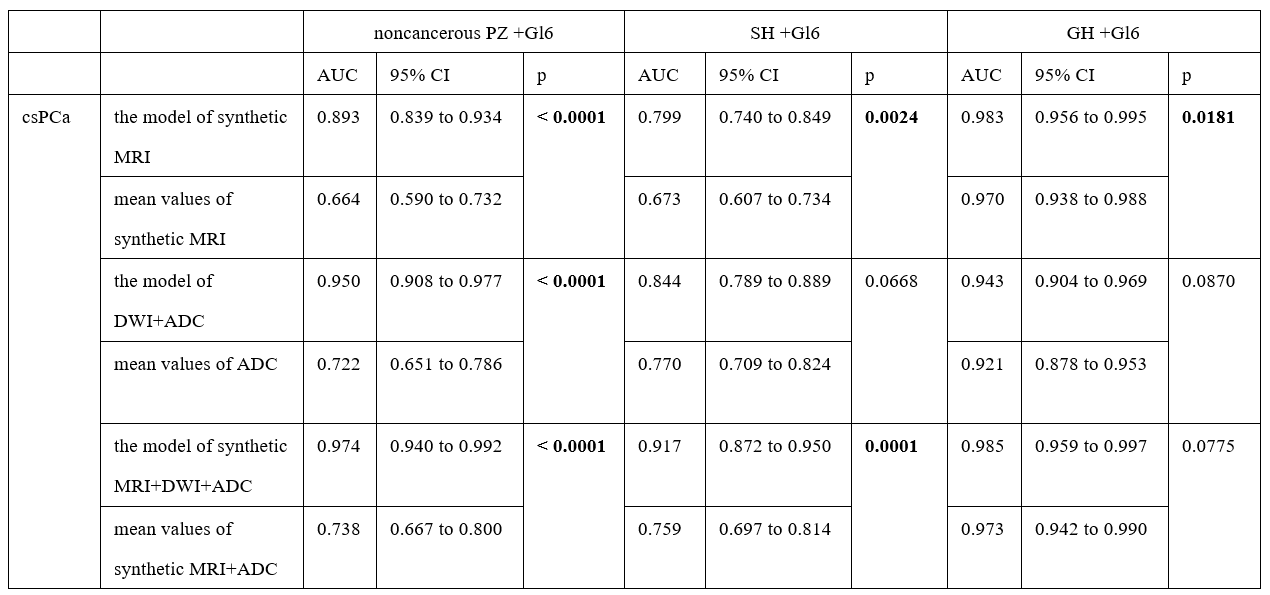
Table 2. Diagnostic performance of texture analysis of synthetic MRI, DWI+ADC, and synthetic MRI+DWI+ADC and mean values of them in predicting csPCa.
DOI: https://doi.org/10.58530/2022/3669