3666
Diffusion kurtosis imaging with multiple quantitative parameters for predicting microsatellite instability status in endometrial carcinoma
Wan Dong1, Shifeng Tian1, Lihua Chen2, and Ailian Liu2
1Radiology, the First Affiliated Hospital of Dalian Medical University, Dalian, China, 2the First Affiliated Hospital of Dalian Medical University, Dalian, China
1Radiology, the First Affiliated Hospital of Dalian Medical University, Dalian, China, 2the First Affiliated Hospital of Dalian Medical University, Dalian, China
Synopsis
Immunohistochemistry is considered the most common method to determine the MSI status of EC, but this method is usually performed after surgery. Here, diffusion kurtosis imaging (DKI) with multiple quantitative parameters was used to predict microsatellite instability (MSI) status of endometrial carcinoma (EC). Results showed that there were good efficiency of DKI to distinguish MSI status of EC (The AUC of MK, Ka, MD, and Dr values was 0.763,0.729,0.731, 0.748, respectively).
Introduction
MSI is considered to be one of the pathogenesis of endometrial carcinoma (EC) [1]. At present, immunohistochemical is the common method to determine the MSI status of EC so that to detect the expression of four mismatch repair proteins in tumor tissues of patients with EC, including MLH-1, MSH-2, MSH-6 and PMS-2[2]. This method is mostly obtained after postoperative analysis, so it is expected that some methods can predict MSI status of EC before surgery. The diffusion kurtosis imaging (DKI) sequence is an extension of the diffusion weighted imaging (DWI) and the diffusion tensor imaging (DTI) sequence, which is a MR imaging technique based on the non-Gaussian distribution model of water molecules[3-5]. This study intends to explore the value of multiple quantitative parameters of DKI sequence in predicting MSI status of EC, with the hope to provide new ideas for preoperatively, non-invasively predicting MSI status, and to expand the application of DKI sequence in uterine diseases.Materials and Methods
Data of 38 patients with EC were collected in the study, including 12 in the MSI group (age from 47 to 82 years old, with an average of 64.1±9.8) and 26 in the MSS group (age from 35 to 78 years old, with an average of 56.7±12.8). All patients have undergone 1.5T MRI (GE Signa HDxt, America) examination in our hospital within 2 weeks before the operation, and the scanning sequence contained DKI. The scanning parameter settings were as follows: using single excited spin echo plane echo (SE-EPI) sequence, TR/TE=3000/98 ms, matrix=128×128, NEX=2.0, FOV=32 cm×32 cm, slice thickness = 0.5cm, with 0, 1000 s/mm2 and 2000 s/mm2 of b values. The scanning time was about 3'. The quantitative values were independently measured by two radiologists. The workstation Function software package was used to post-process the original DKI images to obtain pseudo-color images (Fig. 1). Referring to the T2WI images, the largest section of the lesion and its upper and lower 1-2 levels were selected, and the regions of interest (ROIs) were manually drawn in the tumor parenchymal area. The intra-class correlation coefficient was used to test the consistency between measurements by the two radiologists. The Mann Whitney U test was used to analyze the difference between the values of DKI parameters of MSI and MSS. The ROC curve was used to test potency of the predictive value in distinguishing the two statuss of EC.Results
Measurements by the two radiologists were in good agreement (ICC=0.985). The MK, Ka, Kr, FA, FAk, MD, Da, and Dr values of MSI group were 1.074±0.162, 1.253±0.229, 0.886±0.205, 0.207±0.041, 0.397±0.129, 0.890±0.158 μm2/ms, 1.083±0.218 μm2/ms and 0.793±0.133 μm2/ms; of MSS group were 0.956 (0.889,1.002), 1.048±0.211, 0.831±0.099, 0.188±0.061, 0.334 (0.241,0.410), 1.043±0.217 μm2/ms, 1.235±0.229 μm2/ms and 0.946±0.215 μm2/ms. The MK and Ka values of MSI group were significantly higher than those of MSS group (P<0.05), and the MD and Dr values were significantly lower than that of MSS group (P<0.05) (Tab. 1). The AUC of MK, Ka, MD, and Dr values in predicting MSI status of EC were 0.763, 0.729, 0.731, 0.748, respectively. The sensitivity were 58.3%, 50.0%, 65.4%, 61.5%, and the specificity were 96.2%, 92.3%, 75.0%, 83.3%, respectively (Fig. 2).Discussion and Conclusion
The MK and Ka values of MSI group were significantly higher than those of MSS group, and the MD and Dr values were significantly lower than that of MSS group. And the ROC curve indicated that they had favorable accuracy and specificity. All in all, as a non-enhanced functional imaging of MR, DKI can provide multiple quantitative parameters for non-invasive predicting MSI status of EC, such as MK, Ka, MD, and Dr and it has certain clinical application value.Acknowledgements
No acknowledgementReferences
[1] Brooks RA, Fleming GF, Lastra RR, et al. Current recommendations and recent progress in endometrial cancer. CA Cancer J Clin, 2019, 69(4):258-279.[2] Timmerman S, Van Rompuy AS, Van Gorp T, et al. Analysis of 108 patients with endometrial carcinoma using the PROMISE classification and additional genetic analyses for MMR-D. Gynecol Oncol, 2020, 157(1):245-251.[3] Haopeng P, Xuefei D, Yan R, et al. Diffusion kurtosis imaging differs between primary central nervous system lymphoma and high-grade glioma and is correlated with the diverse nuclear-to-cytoplasmic ratio: a histopathologic, biopsy-based study. Eur Radiol, 2020, 30(4):2125-2137.[4] Bickelhaupt S, Jaeger PF, Laun FB, et al. Radiomics Based on Adapted Diffusion Kurtosis Imaging Helps to Clarify Most Mammographic Findings Suspicious for Cancer. Radiology, 2018, 287(3):761-770.[5] Yoon JH, Lee JM, Lee KB, et al. Comparison of monoexponential, intravoxel incoherent motion diffusion-weighted imaging and diffusion kurtosis imaging for assessment of hepatic fibrosis. Acta Radiol, 2019, 60(12):1593-1601.Figures
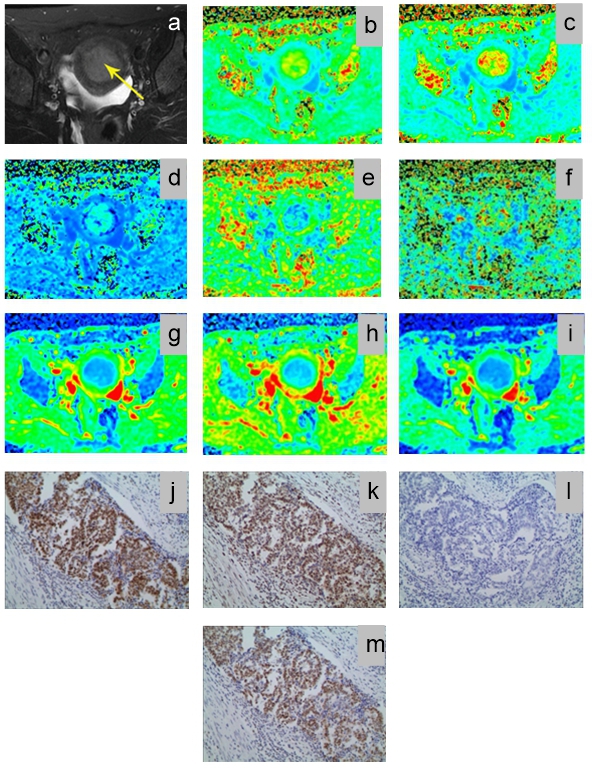
Fig. 1. A 51-year-old patient with poorly differentiated endometrioid adenocarcinoma. 1a, The lesion is showed on T2WI (yellow arrow). 1b~1i, The pseudo-color images of MK, Ka, Kr, FA, FAk, MD, Da, and Dr of the DKI sequence. Their quantitative values are 1.295, 1.525, 1.115, 0.168, 0.355, 0.673 μm2/ms, 0.786 μm2/ms and 0.616 μm2/ms, respectively. 1j~1m, Pictures of immunohistochemical staining, showing strong staining of MLH-1 (1j), strong staining of MSH-2 (1k), loss of expression of MSH-6 (1l), strong staining of PMS-2 (1m)
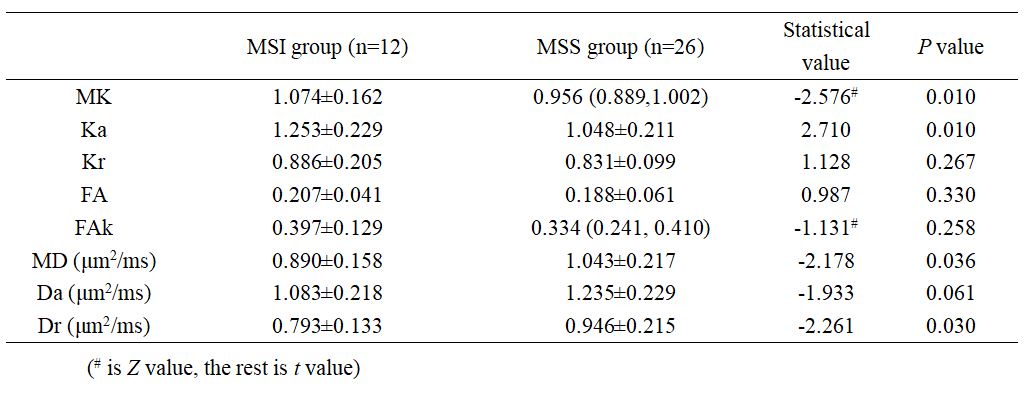
Tab.1.The parameter values and comparison results between the two groups of cases
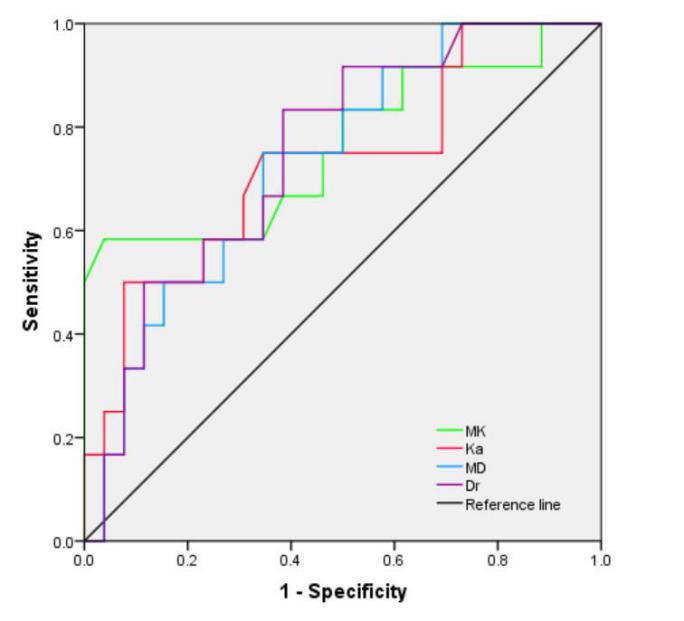
Fig. 2. AUC, threshold, sensitivity and specificity of each parameter
DOI: https://doi.org/10.58530/2022/3666