3665
Optimize and Evaluate the Efficacy of Pairwise AE Model in Predicting the Prognosis of Concurrent Chemo-radiotherapy for Cervical Cancer1The Fourth Hospital of Hebei Medical University, Shi Jiazhuang, China, 2MR Scientific Marketing , Siemens Healthineers Ltd., Beijing, China
Synopsis
To overcome the small data set problems in clinical situations, this paper proposed a pairwise auto encoder (AE) model, which can learn more relationship information among samples to enhance the generalization ability, in predicting the prognosis of concurrent chemo-radiotherapy for LACC and demonstrated potential in this field.
Introduction:
To do an accurately predict prognosis of concurrent chemo-radiotherapy for locally advanced cervical cancer (LACC) is extremely important, because base which a personalized therapeutic schedule can be made to maximize the benefit of the treatment and prolong the survival time to the maximum. In recent years, machine learning demonstrated high potential in differential diagnosis and therapeutic evaluation of LACC. But this method often acquires big data in avoiding over-fitting problem, which limit the clinical application of these techniques. In this paper, we proposed a method, called pair-wise machine learning model, that based on the similarity between typical cases (template) and the other cases to overcome the small data problem. So, the purpose of this study is to establish and optimize a machine learning model based on paired-case in predicting the prognosis of concurrent chemo-radiotherapy for LACC based on radiomics signatures coming from apparent diffusion coefficient (ADC) maps.Materials and Methods:
From September 2016 to January 2020, 135 patients (age: 32-77, mean age: 53±9)were included in this retrospective study. The categories of pathological staging include ⅠB3 21 cases, IIA2 37 cases, IIB 2 cases, IIIA 5 cases, IIIB 6 cases, IIIC 59 cases, IVA 5 cases. All the patients’ examination were performed on a same 3T scanner (MAGNETOM Skyra, Siemens Healthcare, Erlangen, Germany) pre- and post-therapy. According to the 5 years’ follow-up results, the patients were divided into recurrent metastasis group and non-recurrent metastasis group. The whole tumor’s volume was delineated based on a high b value images (b= s/mm2) using a software itk-snap (http://www.itksnap.org/), if necessary, a T1 contrast-enhancement or T2WI images will be referenced to improve the accuracy. Radiomics signatures were extracted using an open source tool named Pyradiomics (https://pyradiomics.readthedocs.io/ ). In the paired-case based machine learning model, to further improve the accuracy and robustness of the model in a small sample set, we selected the typical recurrent metastasis cases and non- recurrent metastasis cases as templates, and paired them with other samples to calculate the differences. The differences among the same group of data were called “positive cases,” and the differences among different groups called “negative cases.” Finally, according to the classification results of positive and negative cases and the label categories, a new sample category was established by voting. According to the accuracy, sensitivity, and specificity of the model in the test set, the optimal combination of the model was determined. The analysis model was developed based on Sklearn (https://scikit-learn.org/) and FeAture Explorer (FAE, v0.2.5, https://github.com/salan668/FAE).Results:
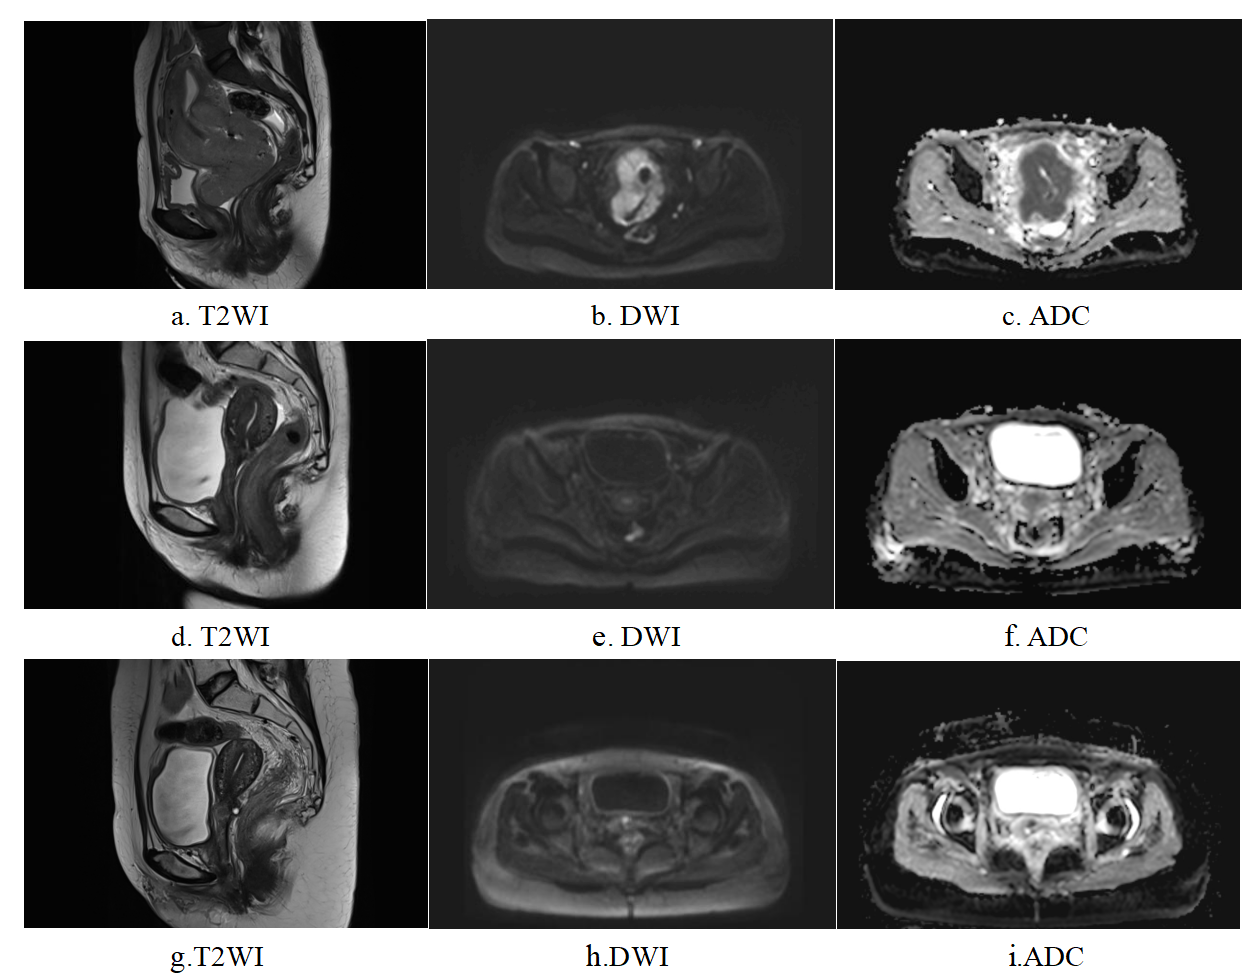
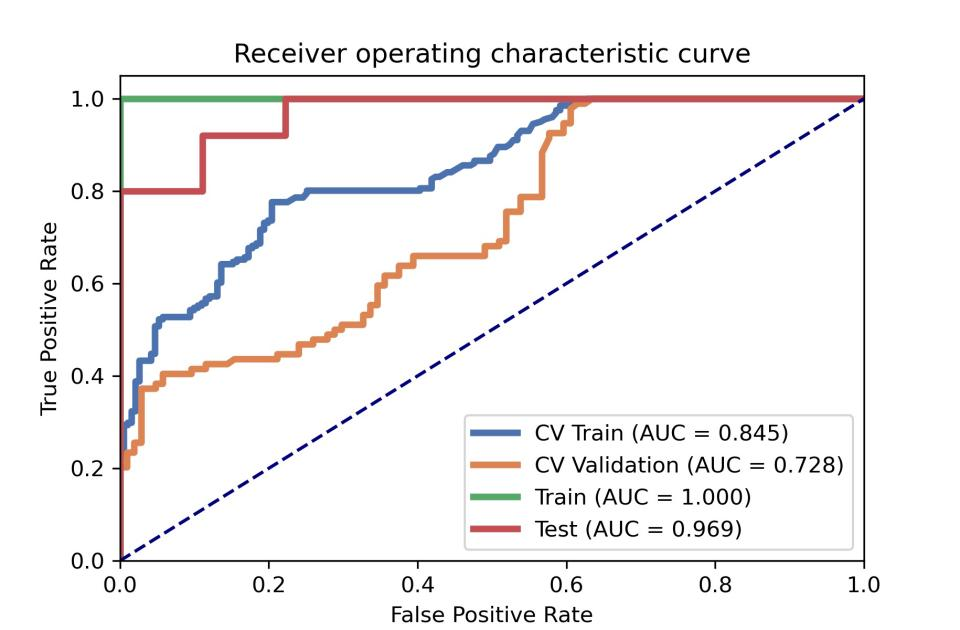
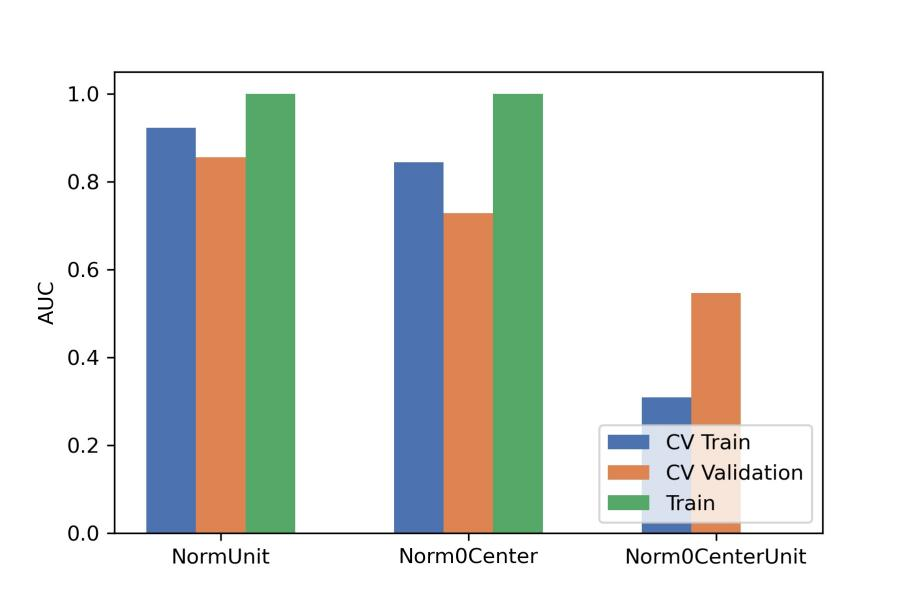
After the comparison and analysis of combinations of data normalization schemes, features dimensionality reduction schemes, and features screening schemes, we chose NormUnit, pearson correlation coefficients (PCC) , recursive feature elimination (RFE) to pre-process the features in model establishing(Figure 3-5). When the number of features was 15, the model showed highest prediction efficiency. The area under the receiver operating curve (AUC) of the training group, validation group and test group were 0.845 (0.807-0.884), 0.728 (0.651-0.794) and 0.969 (0.898-1.000), respectively, and the corresponding accuracies were 0.786, 0.672 and 0.912. The positive predictive and negative predictive values were 0.800 and 0.592, 0.958 and 0.456, and 0.772, 0.592 and 0.958, respectively. (Figure 2 and Table 2).The typical patient’s information shows in Figure 1.Discussion:
In clinical situations, collection of data sets are usually need a long time to observation and usually fewer than hundreds of data points, especially for some rare diseases, collecting data is difficult, expensive and sometimes invasive. How to learning from a small data set is important to suppress over fitting[1]. To deal with the problem of lack of training data, semi-supervised learning and transfer learning have been applied [3, 4]. However, small data set problems are different from these two settings. Semi-supervised learning aims to make use of unlabeled data for training, typically given a small amount of labeled data with a large amount of unlabeled data, but in small data set problems, both labeled and unlabeled data are few. Transfer learning aims to make use of other data from related domains for training. However, it is difficult to measure whether a data set is related or not and hard to guarantee no negative transfer. This paper proposed a pairwise auto encoder (AE) model in predicting the prognosis of concurrent chemo-radiotherapy for LACC and demonstrated potential in this field. The reason may be that more relationship information among samples can be learned, which can enhance the generalization ability of the model [5]. The value of this model was confirmed by excellent performance on this small data set. At the same time, in order to guarantee the accuracy of the experimental results, we set up strict inclusion criteria.Conclusion:
The experimental results demonstrated that the pairwise AE model proposed in this paper seems can improve the accuracy and robustness of the model in predicting the prognosis of concurrent chemo-radiotherapy for LACC based on radiomics signatures coming from apparent diffusion coefficient (ADC) maps.Acknowledgements
No acknowledgement found.References
[1] Dougherty, Edward R., Lori A. Dalton, and Francis J. Alexander. "Small data is the problem." 2015 49th Asilomar Conference on Signals, Systems and Computers. IEEE, 2015.
[2] Chang, Che-Jung, et al. "A forecasting model for small non-equigap data sets considering data weights and occurrence possibilities." Computers & Industrial Engineering 67 (2014): 139-145.
[3] Srijith, P., Shevade, S., and Sundararajan, S. (2013). Semi-supervised Gaussian process ordinal regression. In Machine Learning and Knowledge Discovery in Databases, 144-159. Springer.
[4] Seah, C.W., Tsang, I.W., and Ong, Y.S. (2012).Transductive ordinal regression. Neural Networks and Learning Systems, IEEE Transactions on, 23(7), 1074-1086.
[5] Pairwise Support Vector Machines and their Application to Large Scale Problems. Carl Brunner, Andreas Fischer, Klaus Luig, Thorsten Thies. Journal of Machine Learning Research 13 (2012) 2279-2292.
Figures