3662
ASL and multi-b-value DWI for longitudinal renal function evaluation of renal allografts1Tianjin First Center Hospital, tianjin, China, 2Tianjin First Center Hospital, Tianjin, China, 3MR collaboration, Siemens Healthcare Ltd., Beijing, China
Synopsis
Early evaluation and treatment of delayed graft function due to renal cold ischemia reperfusion injury has important clinical significance for prolonging donor kidney preservation times and improving the survival rates of allografts. Arterial spin labeling (ASL) and diffusion-weighted imaging (DWI) have been accepted for microstructure change evaluations of renal function. In this study, transplant recipients were collected for fMRI examination at 14d, 30d and 90d after transplantation. The parameters were compared to evaluate renal microstructure changes among different time points. The results showed ASL and DWI can reflect longitudinal changes of diffusion and perfusion properties for allografts after kidney transplantation .
INTRODUCTION
Renal cold ischemia reperfusion injury could increase the risk of delayed function and loss of grafts1-2. ASL imaging can be used to evaluate blood perfusion function changes of renal allograft3. This study aimed to investigate the value of ASL multi-b-value DWI MRI to evaluate longitudinal renal microstructural changes in allografts.METHODS
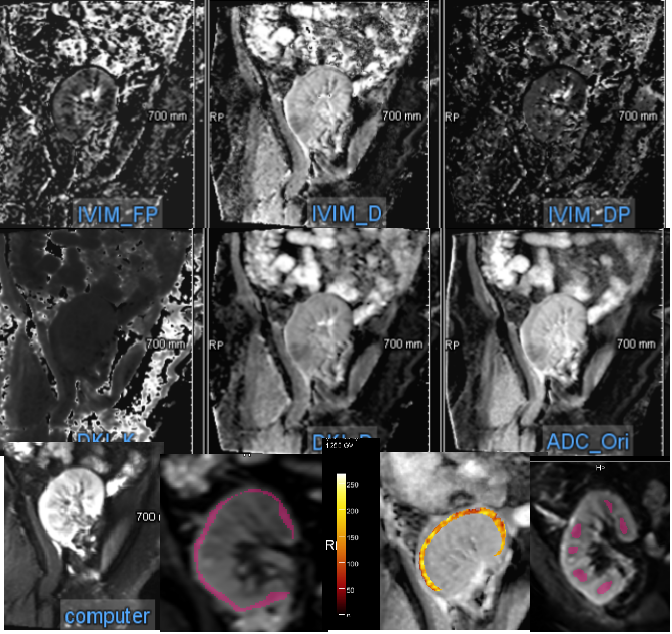
The transplant recipients were collected for funtional magnetic resonance imaging (fMRI) at 14d, 30d and 90d after transplantation. And the estimated golmerular filtration (eGFR) was collected at the same time. Four recipients with stable eGFR level were enrolled. Pulsed ASL(the measurements were 5) and multi-b-value DWI( b-values of 0, 10, 20, 30, 50, 100, 200, 300, 500, 800, 1000, 1500, and 2000 s/mm2 ) were performed on a 3T MR scanner (MAGNETOM Prisma, Siemens Healthcare, Erlangen, Germany) with an 16-channel body coil. DWI images were processed and analyzed using prototypic software (MR Body Diffusion Toolbox and MR Multiparametric Analysis, Siemens Healthcare, Erlangen, Germany).All b-value images were selected to generate apparent diffusion coefficient (ADC) maps from the mono-exponential model. Ten b-values (0, 10, 20, 30, 50, 100, 200, 300, 500, and 800 s/mm2) were selected to generate parametric maps from the bi-exponential model (real diffusion coefficient, D, false diffusion coefficient, Dp, and perfusion fraction, Fp). Five b-values (0, 500, 1000, 1500, and 2000 s/mm2) were selected to generate parametric maps from the kurtosis model (mean diffusion coefficient, mean kurtosis [MK], mean peak, and mean diffusivity [MD]).On the computed image of the MR Multiparametric Analysis software, sketch the renal cortex manually, including the whole cortex, and place 6-10 regions of interest (ROIs) respectively, as large as possible in the renal medulla of the upper, middle and lower poles of the kidney, and then automatically copy them to the ADC, D, Dp and Fp maps(Figure 1). ROI of RBF were the whole cortex(Figure 1).The renal cortex and medulla of allografts and the cortical RBF values were measured by two radiologists independently.The parametric differences(the mean values) at different time points were compared with ANOVA analyses. Spearman correlations were used to analyze the correlations between the renal cortical RBF and the parameters generated from multi-b-value DWI.RESULTS
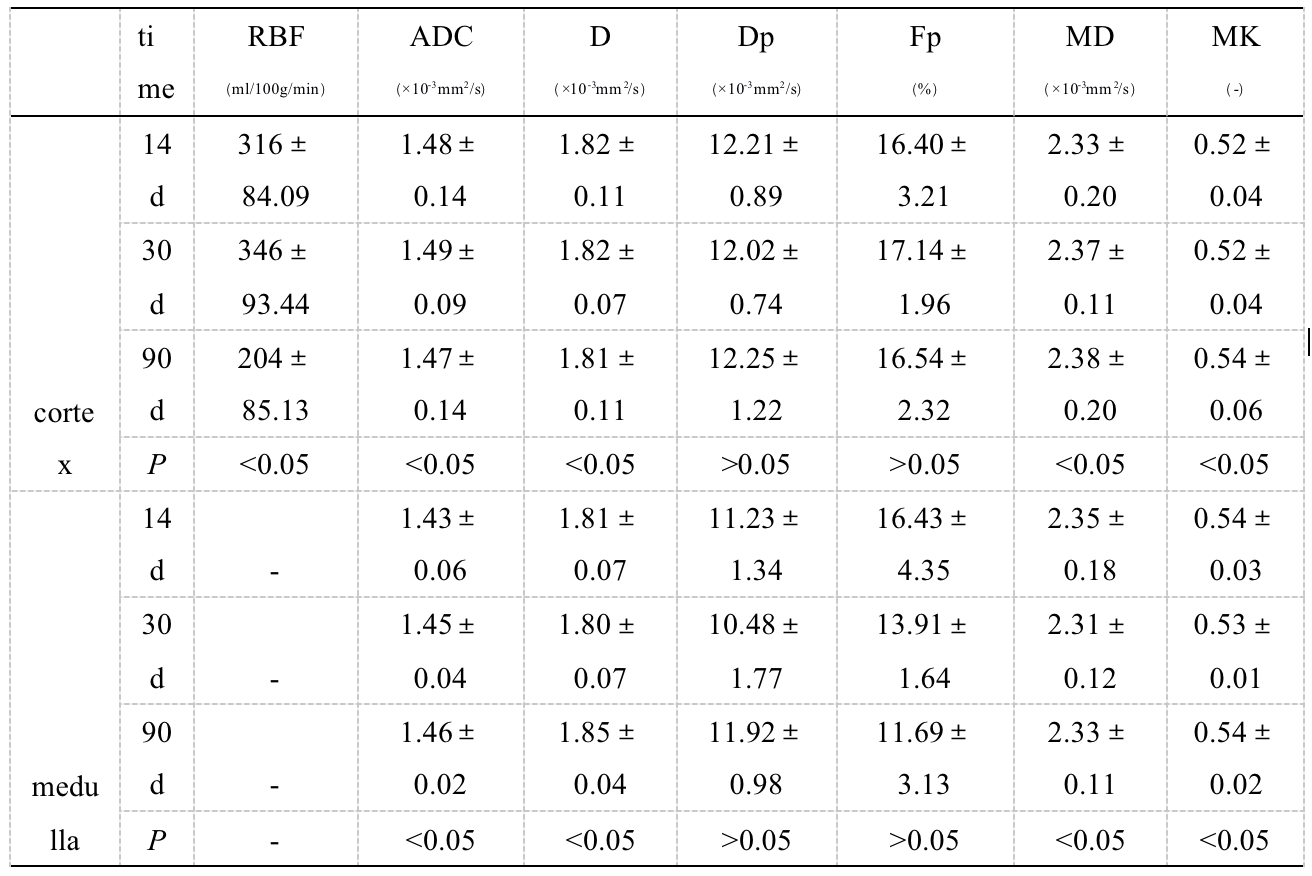
Figure 1 showed that the Fp, D, and Dp, MD, MK and ADC maps, and ROIs of computed map which can clearly displayed the cortex and medulla of allografts. The ROIs drawed on the computed map based on MR Multiparametric Analysis software, so the measurement was more objective and accurate.The cortical RBF, Fp, ADC and MD value decreased firstly at 30d, and then decreased (Figure 2). The medullary ADC, D, MD and MK values increased gradually (P<0.05). These parameters’ values were showed in Table1.A moderately positive correlation was seen between the cortical ADC values and cotical D, Fp and MD values (r=0.726-0.951, P<0.05).A good negative correlation correlation was seen between the cortical ADC values and cotical MK values (r=-0.977, P<0.05).DISCUSSION
At the early stage after transplantation, mitochondrial structural and functional damage, interstitial edema, cortical blood perfusion were obviously in the early stages after kidney transplantation. As renal tubular epithelium and compensation are repaired, cortical RBF, Fp, ADC and MD values recovered and increased at 30d, indicating that molecular water diffusion and the microcirculation perfusion fraction of cortex recovered quickly. The MD and MK value changes also indicated that the renal tubular epithelial cells could be repaired after kidney transplantation with the repair of damaged structures4.However, the values of medulla recovered more slowly.Although the eGFR value of the patients was stable, the stabilization of the microstructural changes of renal function may take at least three months and may be longer. Therefore, longer follow-up is needed to determine the stability time of renal function, and more DGF patients are needed to clarify the differences of their changes.CONCLUSION
ASL and multi-b-value DWI MRI can be used to evaluate molecular water diffusion, microcirculation perfusion, and the microstructural changes of renal tissue, detecting the pathophysiologic renal changes of allograft both quantitatively and noninvasively.Acknowledgements
No acknowledgement found.References
1. Hart A, Gustafson SK, Skeans MA, et al. OPTN/SRTR 2015 Annual Data Report: early effects of the new kidney allocation system[J]. Am J Transplant, 2017,17:543-564.
2. Francis A, Baynosa R. Ischaemia-reperfusion injury and hyperbaric oxygen pathways: a review of cellular mechanisms[J]. Diving Hyperb Med, 2017, 47:110-117.
3.Tao Ren, Chenglong Wen, Lihua Chen, Shuangshuang Xie, Yue Cheng, Yingxin Fu, Niels Oesingman, Andre de Oliveira, Panli Zuo, Jianzhong Yin, Shuang Xia, Wen Shen. Evaluation of renal allografts function early after transplantation using intravoxel incoherent motion and arterial spin labeling MRI. Magnetic resonance Imaging,2016,34(7):908-914.
4.Fattah H, Vallon V. Tubular recovery after acute kidney injury [J]. Nephron, 2018, 140(2): 140-143.
Figures