3660
Combination of Blood Oxygen Level-Dependent and Intravoxel Incoherent Motion MRI to Evaluate Chronic Kidney Disease in Renal Transplants
Pan Wang1, Min Li1, Xiangnan Li1, Jiyang Zhang1, Xin Zheng2, Chen Zhang3, Stemmer Alto4, and Tao Jiang1
1radiology department, Beijing Chao-Yang Hospital, Beijing, China, 2Urinary Surgery, Beijing Chao-Yang Hospital, Beijing, China, 3MR Scientific Marketing, Siemens Healthcare, Beijing, China, 4] MR Application Development, Siemens Healthcare, Erlangen, Germany
1radiology department, Beijing Chao-Yang Hospital, Beijing, China, 2Urinary Surgery, Beijing Chao-Yang Hospital, Beijing, China, 3MR Scientific Marketing, Siemens Healthcare, Beijing, China, 4] MR Application Development, Siemens Healthcare, Erlangen, Germany
Synopsis
Kidney transplantation is currently considered as the preferred treatment for end-stage renal disease, this study aims to explore the performance of BOLD-fMRI and IVIM of renal transplants kidney patients with CKD. The results showed the D value in renal cortical could well identify and distinguish normal kidney and diseased kidney. The R2* value could indirectly reflect deoxyhemoglobin to assess the degree of renal function impairment. BOLD-fMRI and IVIM can provide a more accurate and comprehensive understanding of the functional information of the chronic kidney metabolism.
Introduction
Kidney transplantation is currently considered as the preferred treatment for End-Stage Renal Disease (ESRD). With the improvement and maturity of renal transplantation surgical technology[1], especially the application of new immunosuppressants, the survival rate of early transplantation patients has increased significantly [2]. However, most kidney transplant patients still develop chronic kidney disease (CKD), and even face the risk of renal failure due to postoperative complications and other related factors[3,4],In the past, diffusion-weighted magnetic resonance imaging (DWI) and apparent diffusion coefficient (ADC) were used to access the transplanted kidneys, and the long-term outcome after Kidney transplantation has not been improved[5]. The progression of CKD is a process of renal interstitial fibrosis caused by pathophysiological processes such as ischemia and hypoxia, leading to a decrease in local blood flow[6].Therefore, this study aims to explore the performance of blood oxygen level dependent functional MRI (BOLD-fMRI) and intravoxel incoherent motion (IVIM) MRI of renal transplants kidney patients with CKD, and provide a basis for the application of fMRI in the evaluation of renal transplant function.Method
104 patients of stable disease after renal transplantation more than 3 months were retrospectively considered as the case group. The case group was divided into 3 groups according to eGFR: eGFR ≥ 60 ml / (min · 1.73 m2) for mild CKD group 1, 11 patients; 30 ml / (min · 1.73 m2) ≤ EGFR < 60 ml / (min · 1.73 m2) for moderate CKD group 2, 61patients; eGFR < 30ml / (min · 1.73 m2) for severe CKD group 3, 32 patients. 36 healthy volunteers were selected as control named 0 group,as shown in Table1. Clinical Routine MRI, BOLD-fMRI and IVIM MRI were performed in both cases and controls to measure the cortical and medullary, all data were collected on a 3T MR scanner (MAGNETOM Prisma, Siemens Healthcare, Erlangen, Germany) through an 18-element abdominal coil array. An integrated prototypical slice-by-slice shimming (iShim) technique was used which dynamically updatesthe frequency and the linear shim terms prior to the acquisition of each slice during the imaging phase. The parameters are as follows: TR/TE =3700/59ms, slice thickness=4mm, FOV=245×350mm2, Bandwidth = 2195 Hz/px, b-values = 0, 50, 100, 150, 200, 400, 800, 1200, 2000, 3000 s/mm2. BOLD were acquired using a multi-echo GRE protocol with the following parameters: TR=440ms, TE=2.46ms, 4.95ms, 7.39ms, 9.88ms, slice thickness=4 mm, in-plane resolution= 1.1×1.1 mm2, FOV=250×250mm2, flip angle= 25 deg, slices= 20, distance factor=10%. R2* values, D values, D* values, and fp values of kidneys in the control and case groups were acquired, as shown in Fig 1 and Fig 2. The analysis of these parameters between cortex and medulla in the control and case groups were performed by using SPSS 22.0 statistical software, t test, the One-Way ANOVA and LSD method.Result
Table 2 and 3,figure 1 and 2 show analysis results of R2* values, D values, D* values, and fp values of control and case groups. R2* values of renal medulla and D values of renal cortex between each group are statistically significant (all p < 0.05). D* values and fp values of renal cortex and medulla in control group are higher than group 2 and 3 (all p < 0.05). For case groups, R2* values of renal cortex、D values of renal medulla、D* values and fp values of renal cortex and medulla are also analyzed, there was no statistically significant difference (all p>0.05).Discussion and Conclusions
In this study,R2* value and D value can well distinguish the normal kidney tissue from the kidney tissue with functional impairment. BOLD-fMRI and IVIM can provide a more accurate and comprehensive understanding of the functional information of the chronic kidney metabolism, which is beneficial to selection treatment drug,and provides an important reference value for the diagnosis, staging, treatment and prognosis of CKD in transplanted kidneys.Acknowledgements
We sincerely thank the participants in this study.References
[1] Wolfe R A, Ashby V B, Milford E L, et al. Comparison of mortality in all patients on dialysis, patients on dialysis awaiting transplantation, and recipients of a first cadaveric transplant[J]. N Engl J Med, 1999, 341(23): 1725-30. [2] Haririan A. Current status of the evaluation and management of antibody-mediated rejection in kidney transplantation[J]. Curr Opin Nephrol Hypertens, 2015, 24(6): 576-81. [3] Meier-Kriesche H U, Schold J D, Srinivas T R, et al. Lack of improvement in renal allograft survival despite a marked decrease in acute rejection rates over the most recent era[J]. Am J Transplant, 2004, 4(3): 378-83. [4] Meier-Kriesche H U, Schold J D, Kaplan B. Long-term renal allograft survival: have we made significant progress or is it time to rethink our analytic and therapeutic strategies?[J]. Am J Transplant, 2004, 4(8): 1289-95. [5] Juillard L, Lerman L O, Kruger D G, et al. Blood oxygen level|[ndash]|dependent measurement of acute intra-renal ischemia[J]. Kidney International, 2004, 65(3): 944-950. [6] Eddy A A. Molecular basis of renal fibrosis[J]. Pediatric Nephrology, 2000, 15(3-4): 290-301Figures
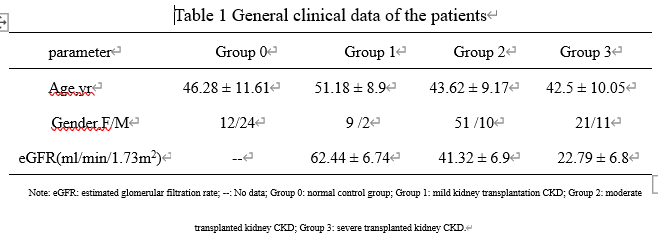
Table 1 General
clinical data of the patients
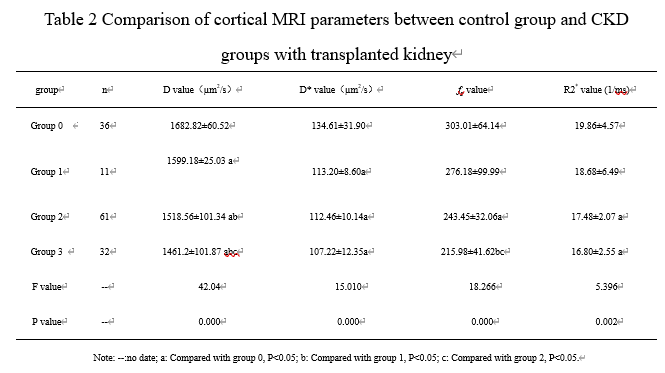
Table 2 Comparison of cortical MRI parameters
between control group and CKD groups with transplanted kidney
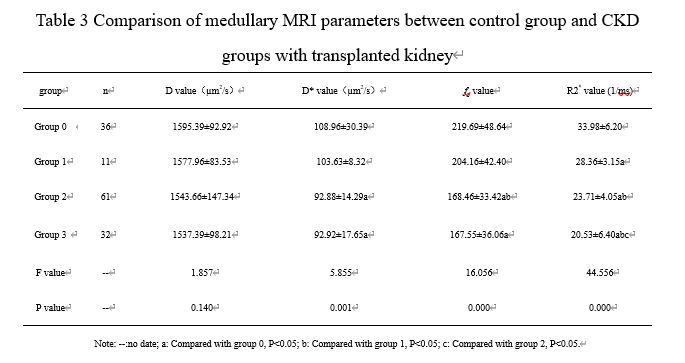
Table 3 Comparison of medullary MRI parameters between control group and
CKD groups with transplanted kidney
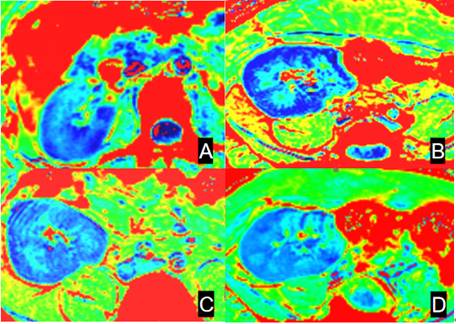
Figure 1 [RE1] R2* -weighted
images from BOLD-fMRI: A: group 0, B: group 1, C: group 2, D: group 3
[RE1]It is quite hard to read the white letters (A, B, C, D). Perhaps try
using a colored background to improve readability.
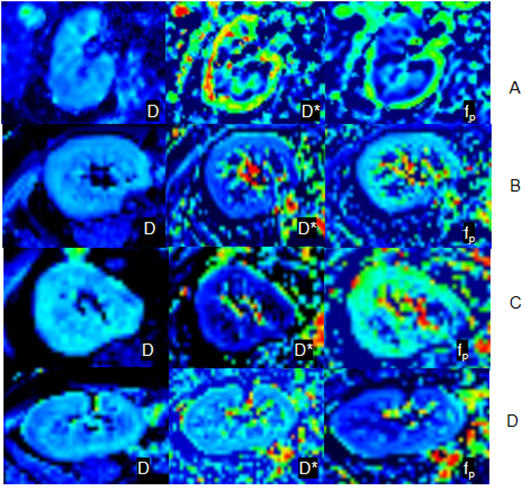
Figure 2 Results for DWI-IVIM: A: group 0, B: group 1, C: group 2, D: group 3
DOI: https://doi.org/10.58530/2022/3660