3656
Quantitative CAIPIRINHA-Dixon-TWIST-VIBE parameters correlate with molecular subtypes of invasive ductal carcinoma1Radiology, Fudan University Shanghai Cancer Center, Shanghai, China, 2MR Applications Development, Siemens Shenzhen Magnetic Resonance Ltd., Shenzhen, China, 3MR Application Predevelopment, Siemens Healthcare GmbH, Erlangen, Germany
Synopsis
In this study, we analyzed the relationship between CAIPIRINHA-Dixon-TWIST-VIBE (CDTV)-derived DCE parameters and clinicopathological factors, including molecular subtypes of invasive ductal carcinoma (IDC). Our results showed that the values of semi-quantitative parameters were similar for various prognostic factors and molecular subtypes of IDC. However, the values of quantitative inline pharmacokinetic kinetic parameters, kep_minimum and kep_difference, were significantly different for the luminal A and HER2-positive subtypes. AUC value for accurately distinguishing luminal A and HER2-positive subtypes based on combined kep_minimum and kep_difference values was 0.820. Therefore, our study demonstrates that CDTV-derived quantitative parameters are associated with molecular subtypes of IDC.
Introduction
The high temporal and spatial resolution of ultrafast DCE-MRI enables more detailed evaluation of various morphological and kinetic features of invasive cancers such as invasive ductal carcinoma (IDC) in a single session [1-3]. However, the prognostic significance of semi-quantitative parameters such as initial enhancement rates (IERs) and maximum slope (MS), and various quantitative in-line pharmacokinetic parameters derived from CAIPIRINHA-Dixon-TWIST-VIBE (CDTV) have not been reported for IDC subtypes. Therefore, in this study, we investigated the association between semi-quantitative and quantitative parameters derived from CDTV and clinicopathological factors, including molecular subtypes of IDC.Methods
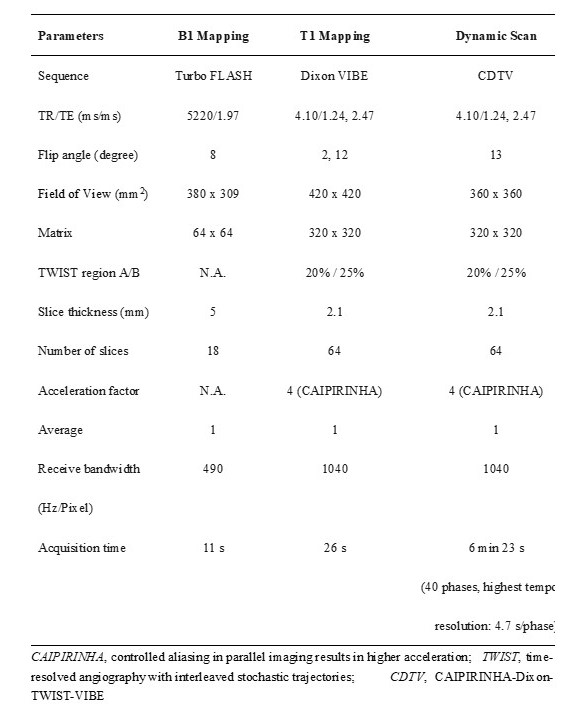
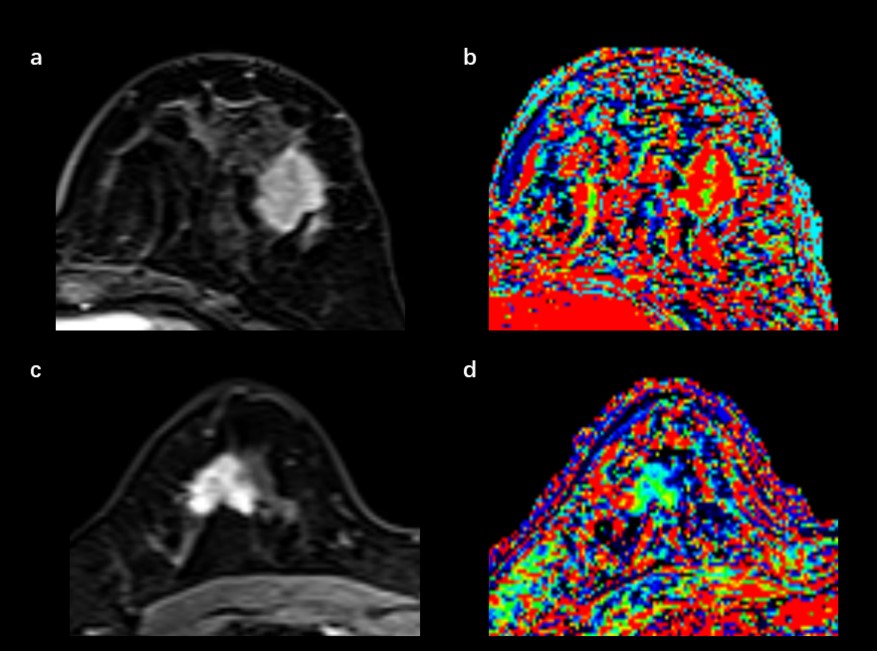
In this study, we prospectively included 152 breast cancer patients with invasive ductal carcinoma (IDC) between October 2018 and May 2019 from our site. All pathologic proofs were obtained by surgical specimens. Estrogen receptor (ER) status was considered positive if more than 1% of the nuclei stained positive. Positive human epidermal growth factor receptor (HER2) expression was defined by IHC (immunohistochemical) scores of 3+ or FISH amplification with a ratio ≥2.0. The cutoff value of 14% was used to divide Ki-67 into low-expression and high-expression groups. The patients were also classified into luminal A, luminal B, HER2-positive, and triple-negative (TN) subtypes [4]. Breast MRI examinations were performed using a 3 T MRI scanner (MAGNETOM Skyra,Siemens Healthcare, Erlangen, Germany). Prototype CDTV-DCE consisted of B1 mapping with Turbo FLASH sequence, T1 mapping with Dixon VIBE sequence, and multiple-phase dynamic scan with CDTV sequence (Table 1). The multiple-phase DCE MRI duration was 6 minutes 23 seconds (40 acquisitions). After three phases of dynamic scans were acquired, a rapid bolus of gadolinium contrast agent (Magnevist, Bayer Healthcare Pharmaceuticals Inc., Whippany, NJ, USA) was injected at a dose of 0.1 mmol per kilogram of body weight and a rate of 2 ml/sec followed by a 20 ml saline flush using an automatic injector. Quantitative pharmacokinetic quantitative parameters (Ktrans, kep and ve) were inline generated after data acquisition. The mean, minimum, and maximum values of these parameters were measured by manually placing regions of interest within the lesions. Intratumoral heterogeneity was calculated based on the differential value between minimum and maximum values for each quantitative parameter. Semi-quantitative parameters (initial enhancement rates [IERs] at 0.5, 1, 1.5 and 2 minutes, and maximum slope [MS]) were estimated from the concentration curves using the Mean Curve software (Siemens Healthcare, Erlangen, Germany) (Figure 1). Student’s t tests, Mann-Whitney U tests, Kruskal-Wallis tests, Steel-Dwass multiple comparison tests, and ROC curves were used for statistical analysis.Results
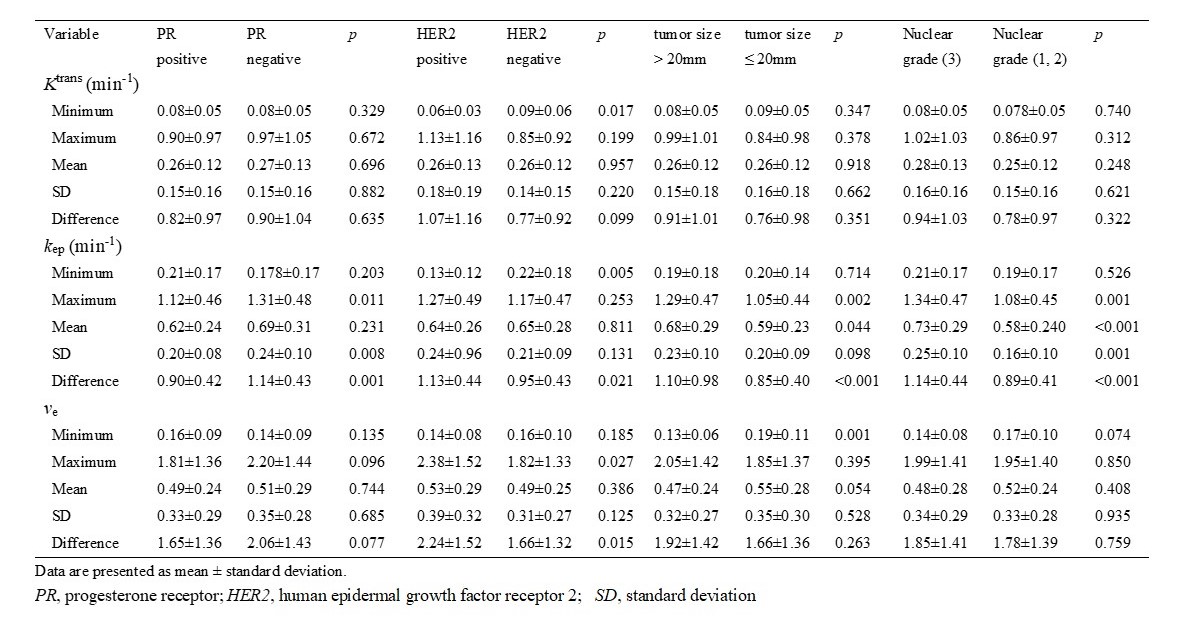
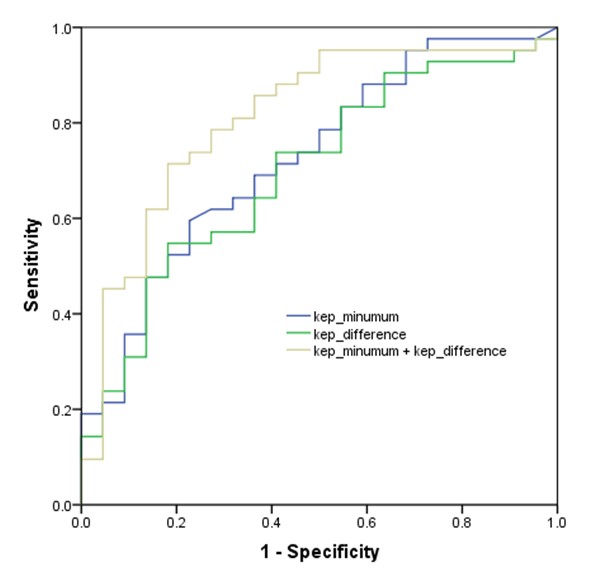
There were no significant differences in the values of IER and MS values for all prognostic factors and among the four molecular subtypes of breast cancer. However, the kep_minimum values for HER2-positive IDCs were significantly lower compared to the HER2-negative cancers (p = 0.005) (Table 2). The ve_minimum values were significantly different for the large and small breast tumors according to multivariate analysis (p = 0.011). The kep_mean and kep_difference values were independent predictors for distinguishing high and low nuclear grade groups (p = 0.013, 0.026, respectively). The post-hoc test confirmed that kep_minimum and kep_difference values for the luminal A subtype (0.23 min-1, 0.78 min-1, respectively) were significantly different compared to those for the HER2-positive subtype (0.11 min-1, 1.09 min-1, respectively) (p = 0.021, 0.049, respectively). ROC curve analysis showed that the AUC value for distinguishing the luminal A and HER2-positive subtypes based on combined kep_minimum and kep_difference values was 0.820 (95% confidence interval [CI]: 0.719-0.922) with a sensitivity of 76.2% and specificity of 86.4% (Figure 2).Discussion
The ultrafast DCE-MRI can be analyzed on a semi-quantitative and on a quantitative level, both of which evaluate metrics indicative of tissue perfusion. Multivariable analysis in our study showed that lower kep_minumum and higher kep_difference values were found in HER2-positive breast cancer than those in luminal A breast cancer, which may be due to the fact HER2 expression correlates with an overexpression of vascular endothelial growth factor (VEGF), which can increase angiogenesis [5].Conclusion
Our results showed that CDTV-DCE-derived inline pharmacokinetic quantitative parameters accurately distinguished the luminal A and HER2-positive subtypes of breast cancer. Hence, our results show that quantitative parameters derived from CDTV are potential preoperative prognostic factors that can distinguish between different molecular subtypes of IDC.Acknowledgements
No.References
1. Gruber L, Rainer V, Plaikner M, Kremser C, Jaschke W, Henninger B. CAIPIRINHA-Dixon-TWIST (CDT)-VIBE MR imaging of the liver at 3.0T with gadoxetate disodium: a solution for transient arterial-phase respiratory motion-related artifacts? Eur Radiol. 2018; 28:2013-2021
2. Hao W, Zhao B, Wang G, Wang C, Liu H. Influence of scan duration on the estimation of pharmacokinetic parameters for breast lesions: a study based on CAIPIRINHA-Dixon-TWIST-VIBE technique. Eur Radiol. 2015; 25:1162-1171
3. Li Z, Ai T, Hu Y et al. Application of whole-lesion histogram analysis of pharmacokinetic parameters in dynamic contrast-enhanced MRI of breast lesions with the CAIPIRINHA-Dixon-TWIST-VIBE technique. J Magn Reson Imaging. 2018; 47:91-96
4. Goldhirsch A, Wood WC, Coates AS et al. Strategies for subtypes--dealing with the diversity of breast cancer: highlights of the St. Gallen International Expert Consensus on the Primary Therapy of Early Breast Cancer 2011. Ann Oncol. 2011; 22:1736-1747
5. Brown LF, Berse B, Jackman RW et al. Expression of vascular permeability factor (vascular endothelial growth factor) and its receptors in breast cancer. Hum Pathol.1995; 26:86-91
Figures