3653
Free-breathing Water-fat Separation and T1 Mapping of the Whole Liver with Isotropic Resolution using 3D Golden Angle Radial Trajectory1Center for Biomedical Imaging Research, Department of Biomedical Engineering, School of Medicine, Tsinghua University, Beijing, China, 2School of Biomedical Engineering, ShanghaiTech University, Shanghai, China, 3Philips Healthcare, Beijing, China
Synopsis
T1 mapping of the liver has been used for the diagnosis and grading of the liver disease, and the evaluation of the liver function, while conventional liver T1 mapping techniques need breath-holding, have limited slice coverage or need multiple acquisitions. In addition, the accuracy of the T1 quantification is affected by the presence of fat in the liver. In this study, free-breathing water-fat separation and T1 mapping quantification of the whole liver was achieved within one scan using the proposed mGOAL-SNAP sequence. The quantitative accuracy and the in-vivo feasibility of mGOAL-SNAP have been demonstrated in phantom and volunteers studies.
Introduction
T1 mapping of the liver has been used for the diagnosis and grading of the liver disease, and the evaluation of the liver function1-3. Previous studies usually use variable flip angle technique1-3 or Modified Look-Locker Inversion recovery (MOLLI) sequence1,4-7 to quantify the T1 of the liver. However, these conventional liver T1 mapping techniques were usually performed under breath-holding1-3,6, and have limited slice coverage1,6 or relied on multiple acquisitions2,3,8. Therefore, free-breathing whole liver T1 quantitative technique in one single scan is needed. In addition, due to the different resonance frequencies between water and fat protons (~3.5 ppm), the accuracy of the T1 quantification is affected by the presence of fat in the liver, especially in patients with fatty liver disease. Thus, in this study, we aim to propose a simultaneous free-breathing water-fat separation and T1 mapping technique for the whole liver and investigate its clinical feasibility in phantom and volunteer studies.Methods
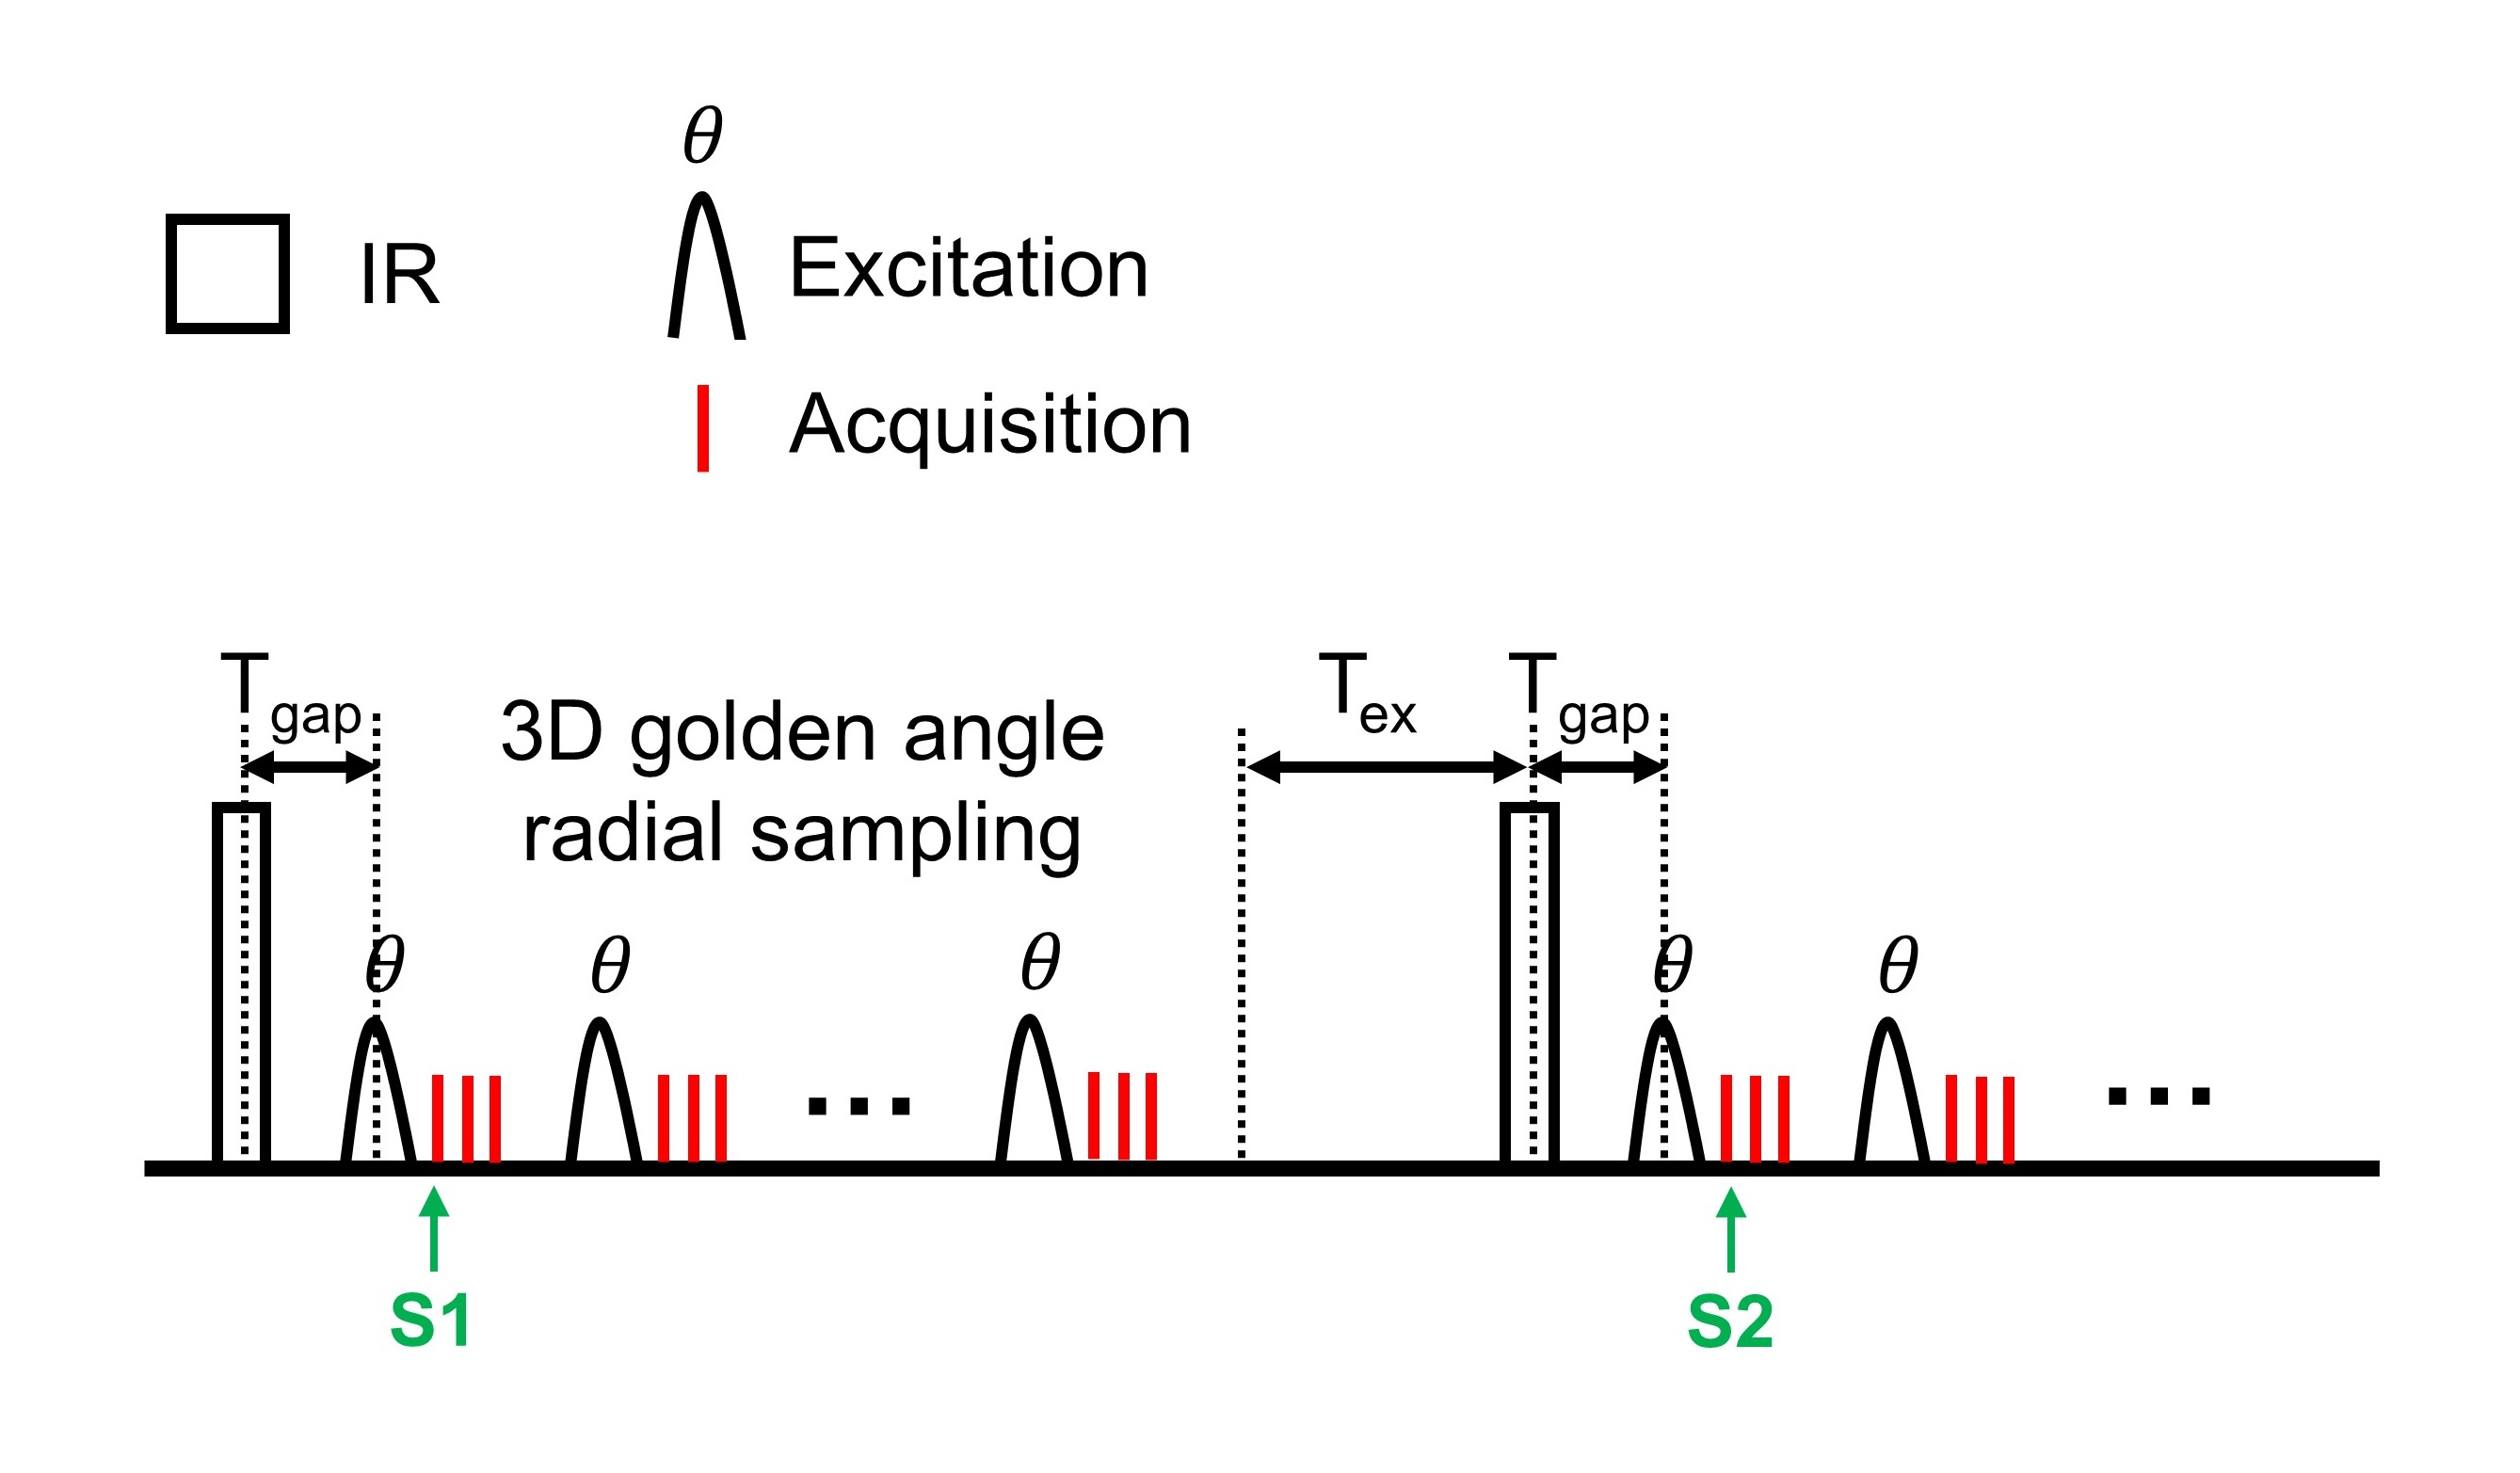
Sequence Design and Image Reconstruction: The proposed sequence (mGOAL-SNAP) consisted of an inversion recovery (IR) preparation pulse followed by a series of multi-echo 3D golden angle radial acquisition (Figure 1). Spokes acquired with the same inversion time (TI) (Figure 1, S1 and S2) followed the consecutive 3D golden angle distribution9. The scan parameters were: FOV=200×200×200 mm3 (2-fold oversampling), spatial resolution=2.5×2.5×2.5 mm3, TR=10 ms, 3 echoes, TE/ΔTE=1.02/1.40 ms, flip angle=8°, TFE factor=175, Tgap=10 ms, Tex=250 ms, scan duration=5 min. For each TE, a series of T1-weighted water-fat mixed images were reconstructed using a sliding window method10 with a temporal width of 25 spokes (temporal resolution=250 ms). Low-rank and sparsity constraint (LRS) reconstruction method11 was applied to further improve the image quality.Water-fat Separation and T1 mapping: For each TI, water and fat were separated using a graph cut algorithm based on a multi-peak fat model12. Then, separated water and fat T1 mapping of the liver was estimated by fitting the signal intensities extracted from a series of T1-weighted water or fat images to the T1 inversion recovery curve, respectively10. The proton density of the water (ρw) and fat (ρf) were calculated on the last TI images by taking the T1 recovery effects10 into account. The proton density fat fraction (PDFF) was defined as 100%×ρf/(ρw+ρf).
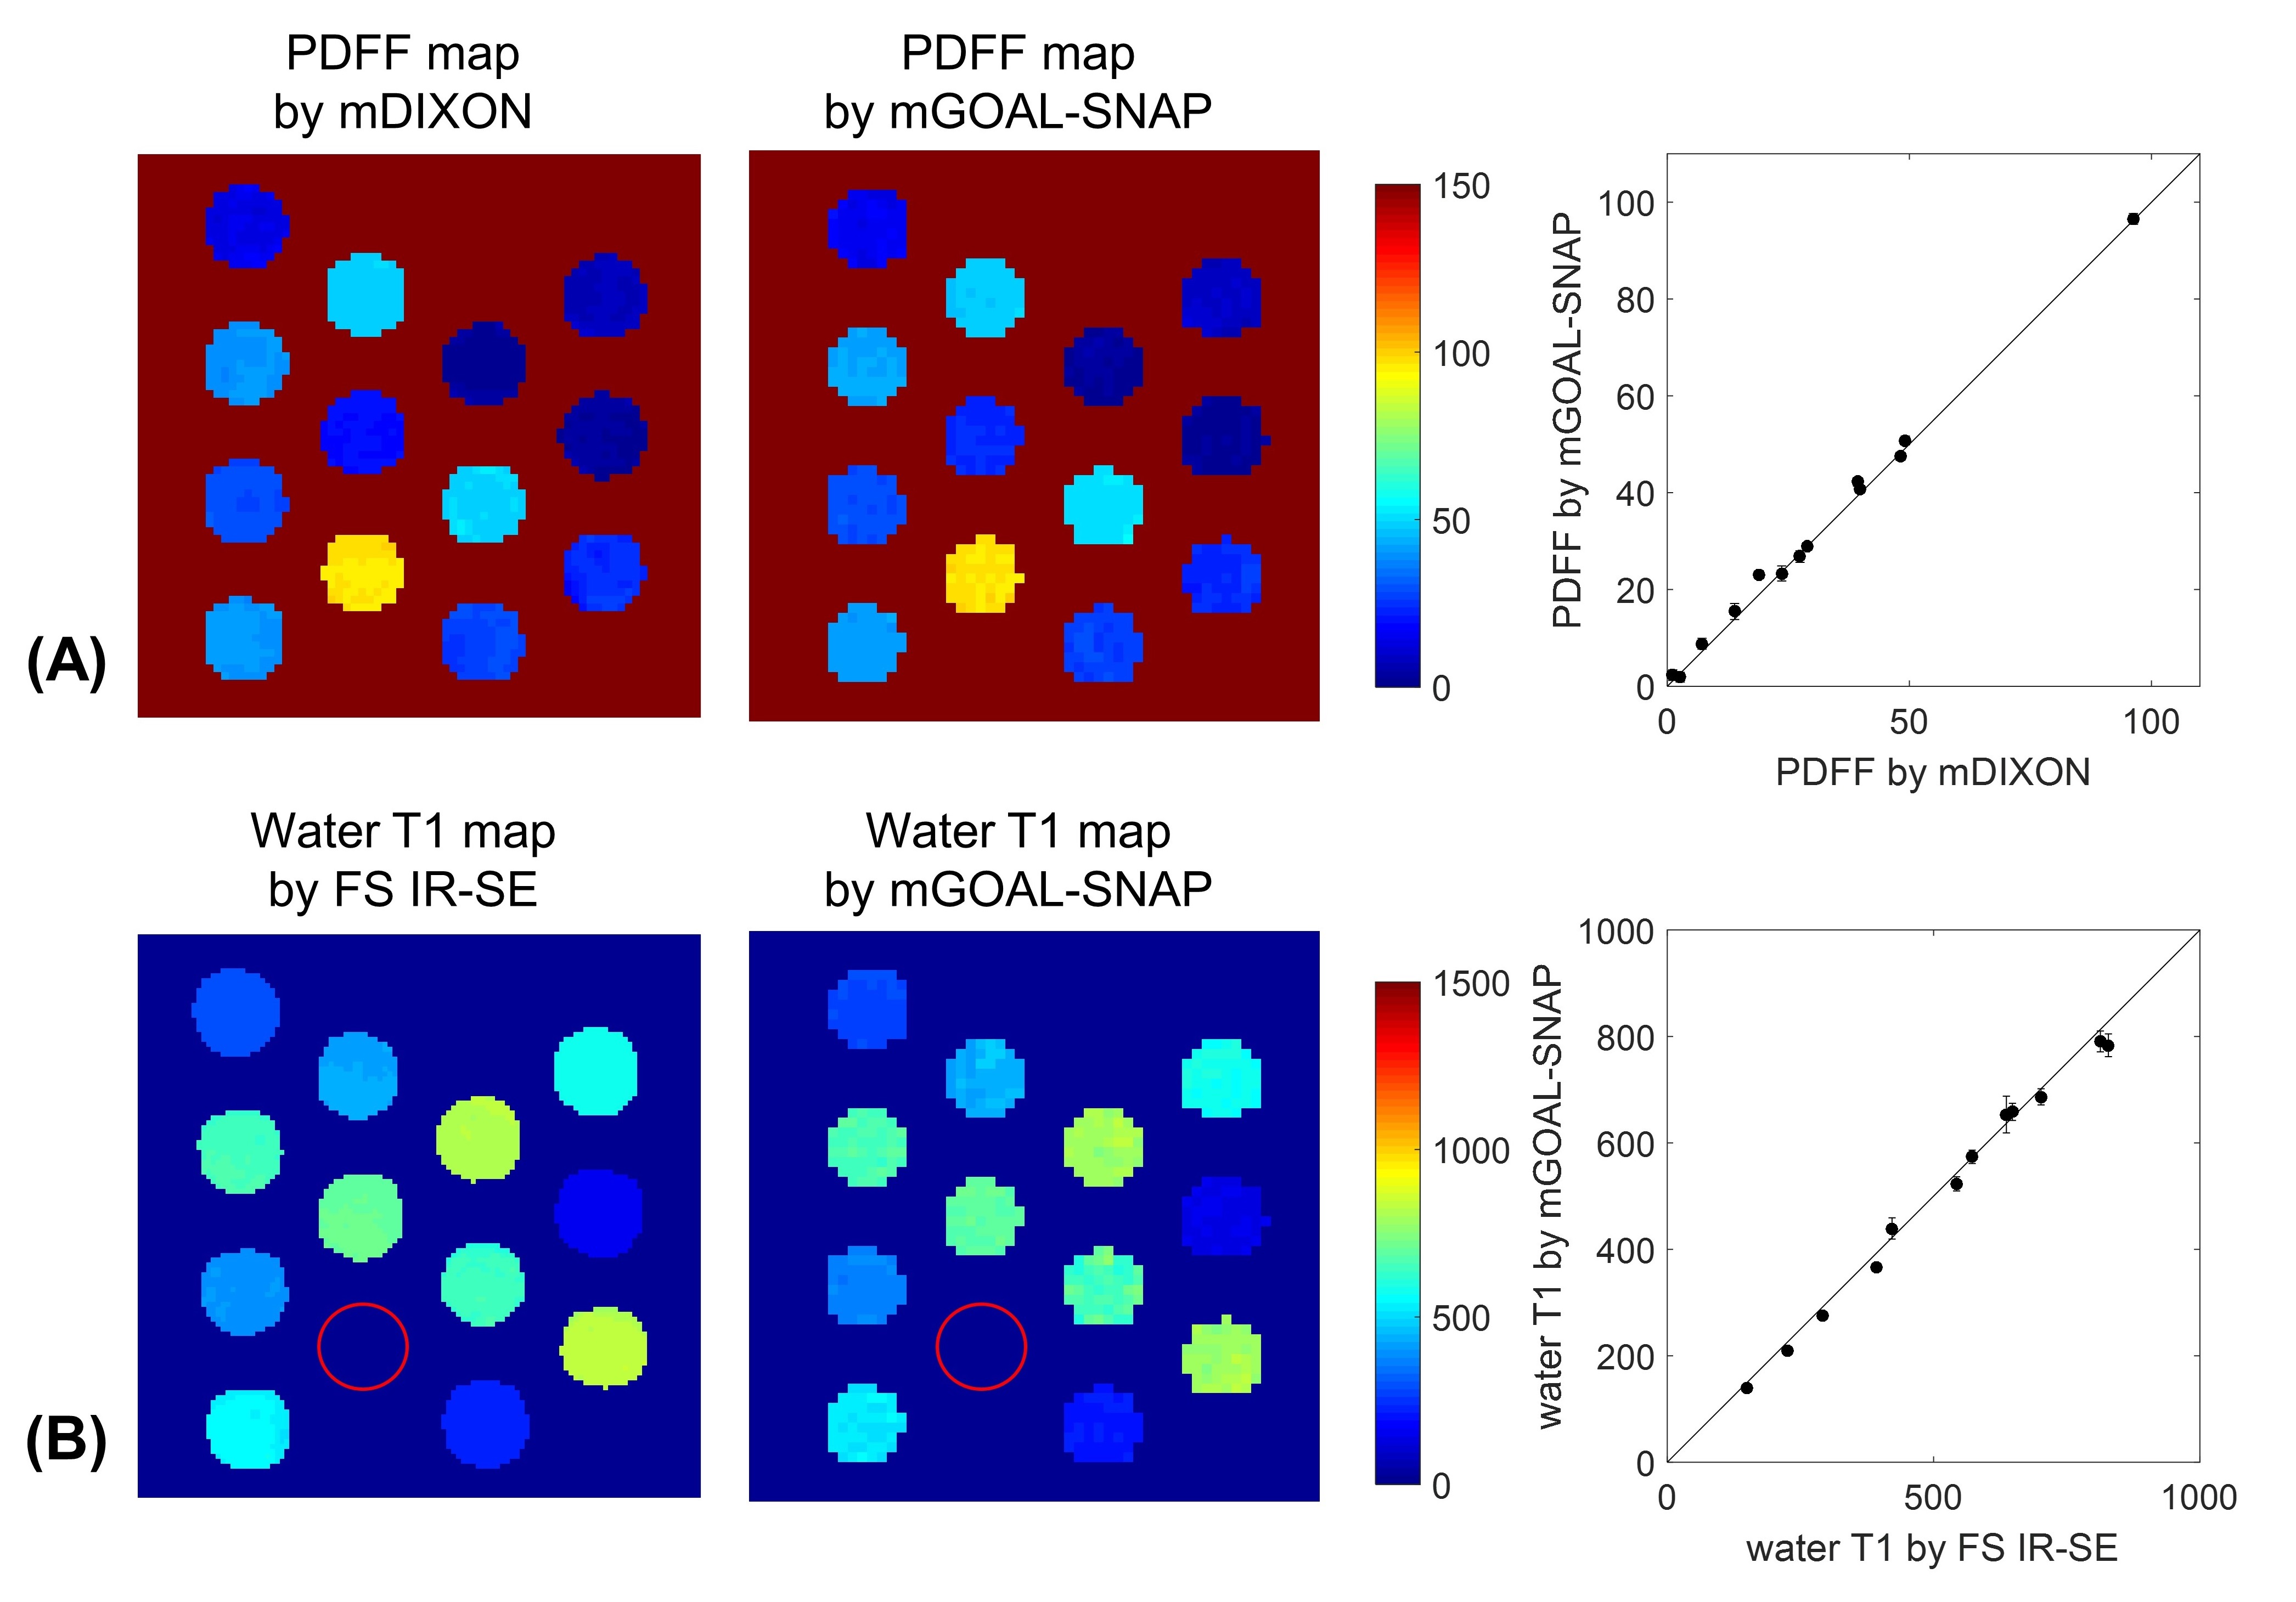
Phantom Study: In-house water-fat phantom13,14 with different T1 values (range 100-1000 ms) and fat fractions (range 0-50%, 100%) was scanned on a 3.0T MR scanner (Ingenia CX, Philips Healthcare, Best, Netherlands). Apart from the proposed mGOAL-SNAP sequence, modified DIXON (mDIXON) Quant and 2D fat-suppressed IR-SE sequences were used as the gold standard for the PDFF and water T1 quantification. The mean PDFF and the mean water T1 of each phantom estimated by mGOAL-SNAP were calculated and compared with those by mDIXON and fat-suppressed IR-SE using Pearson correlation.
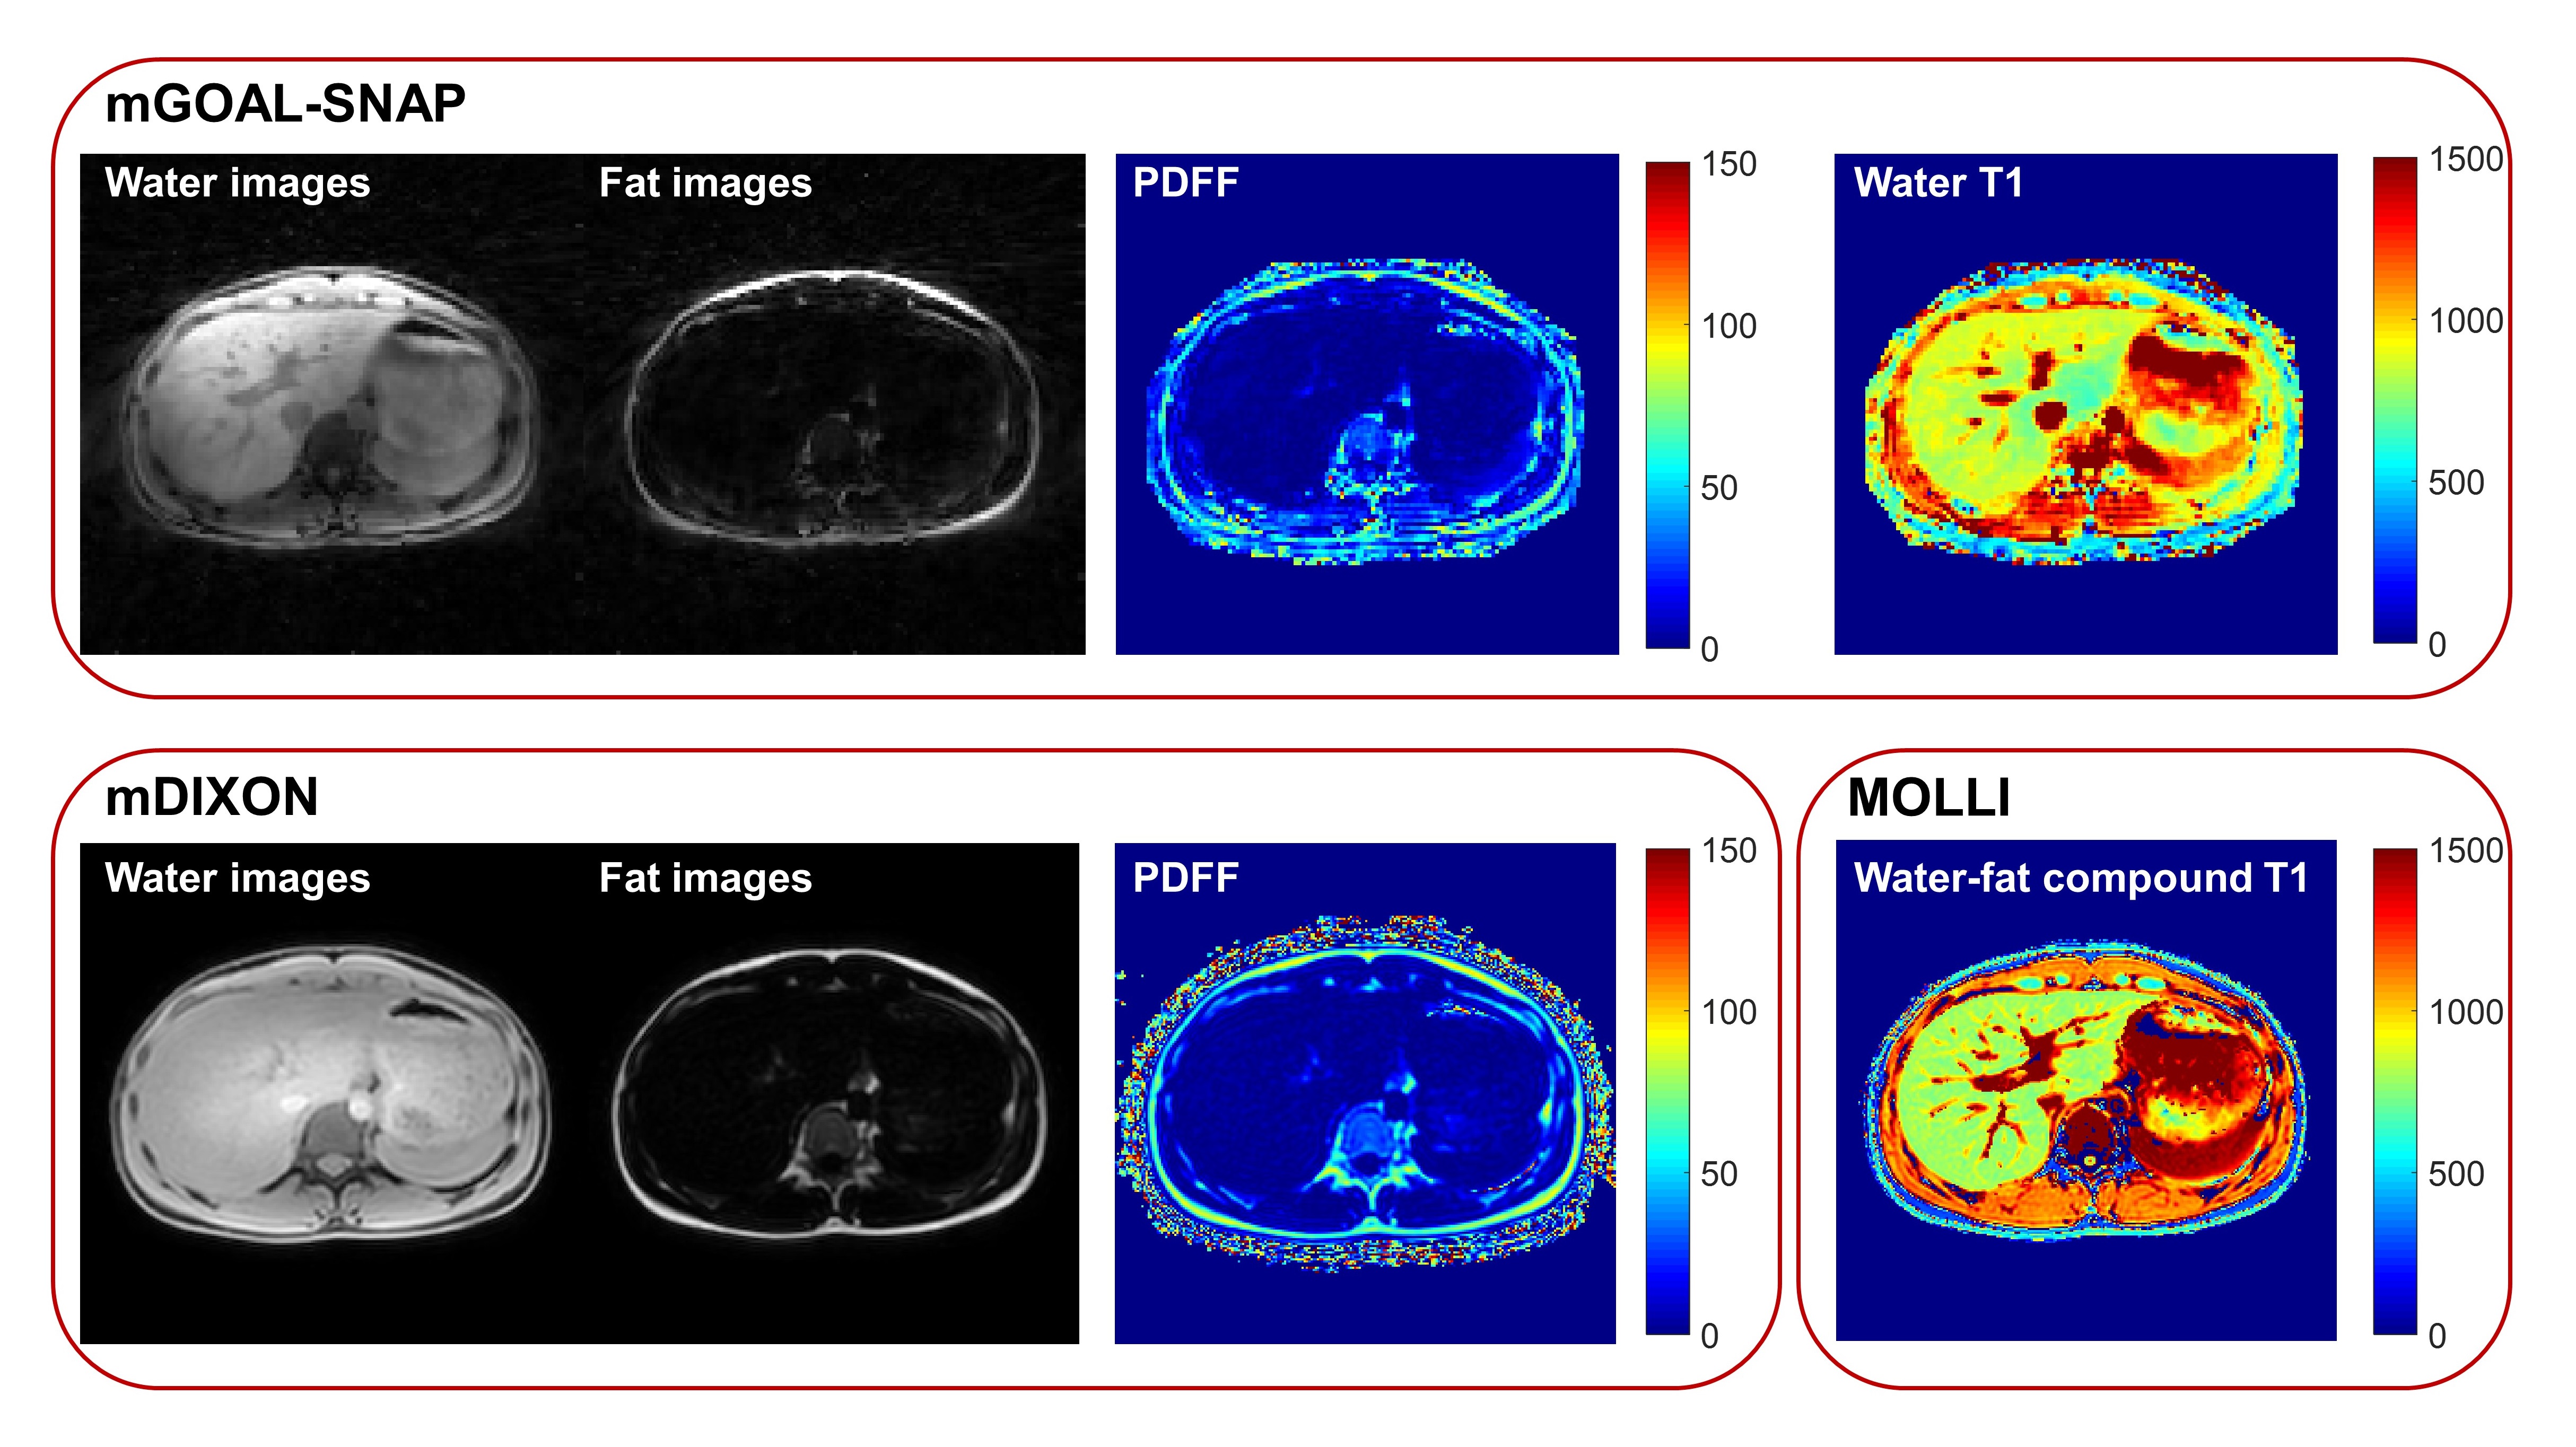
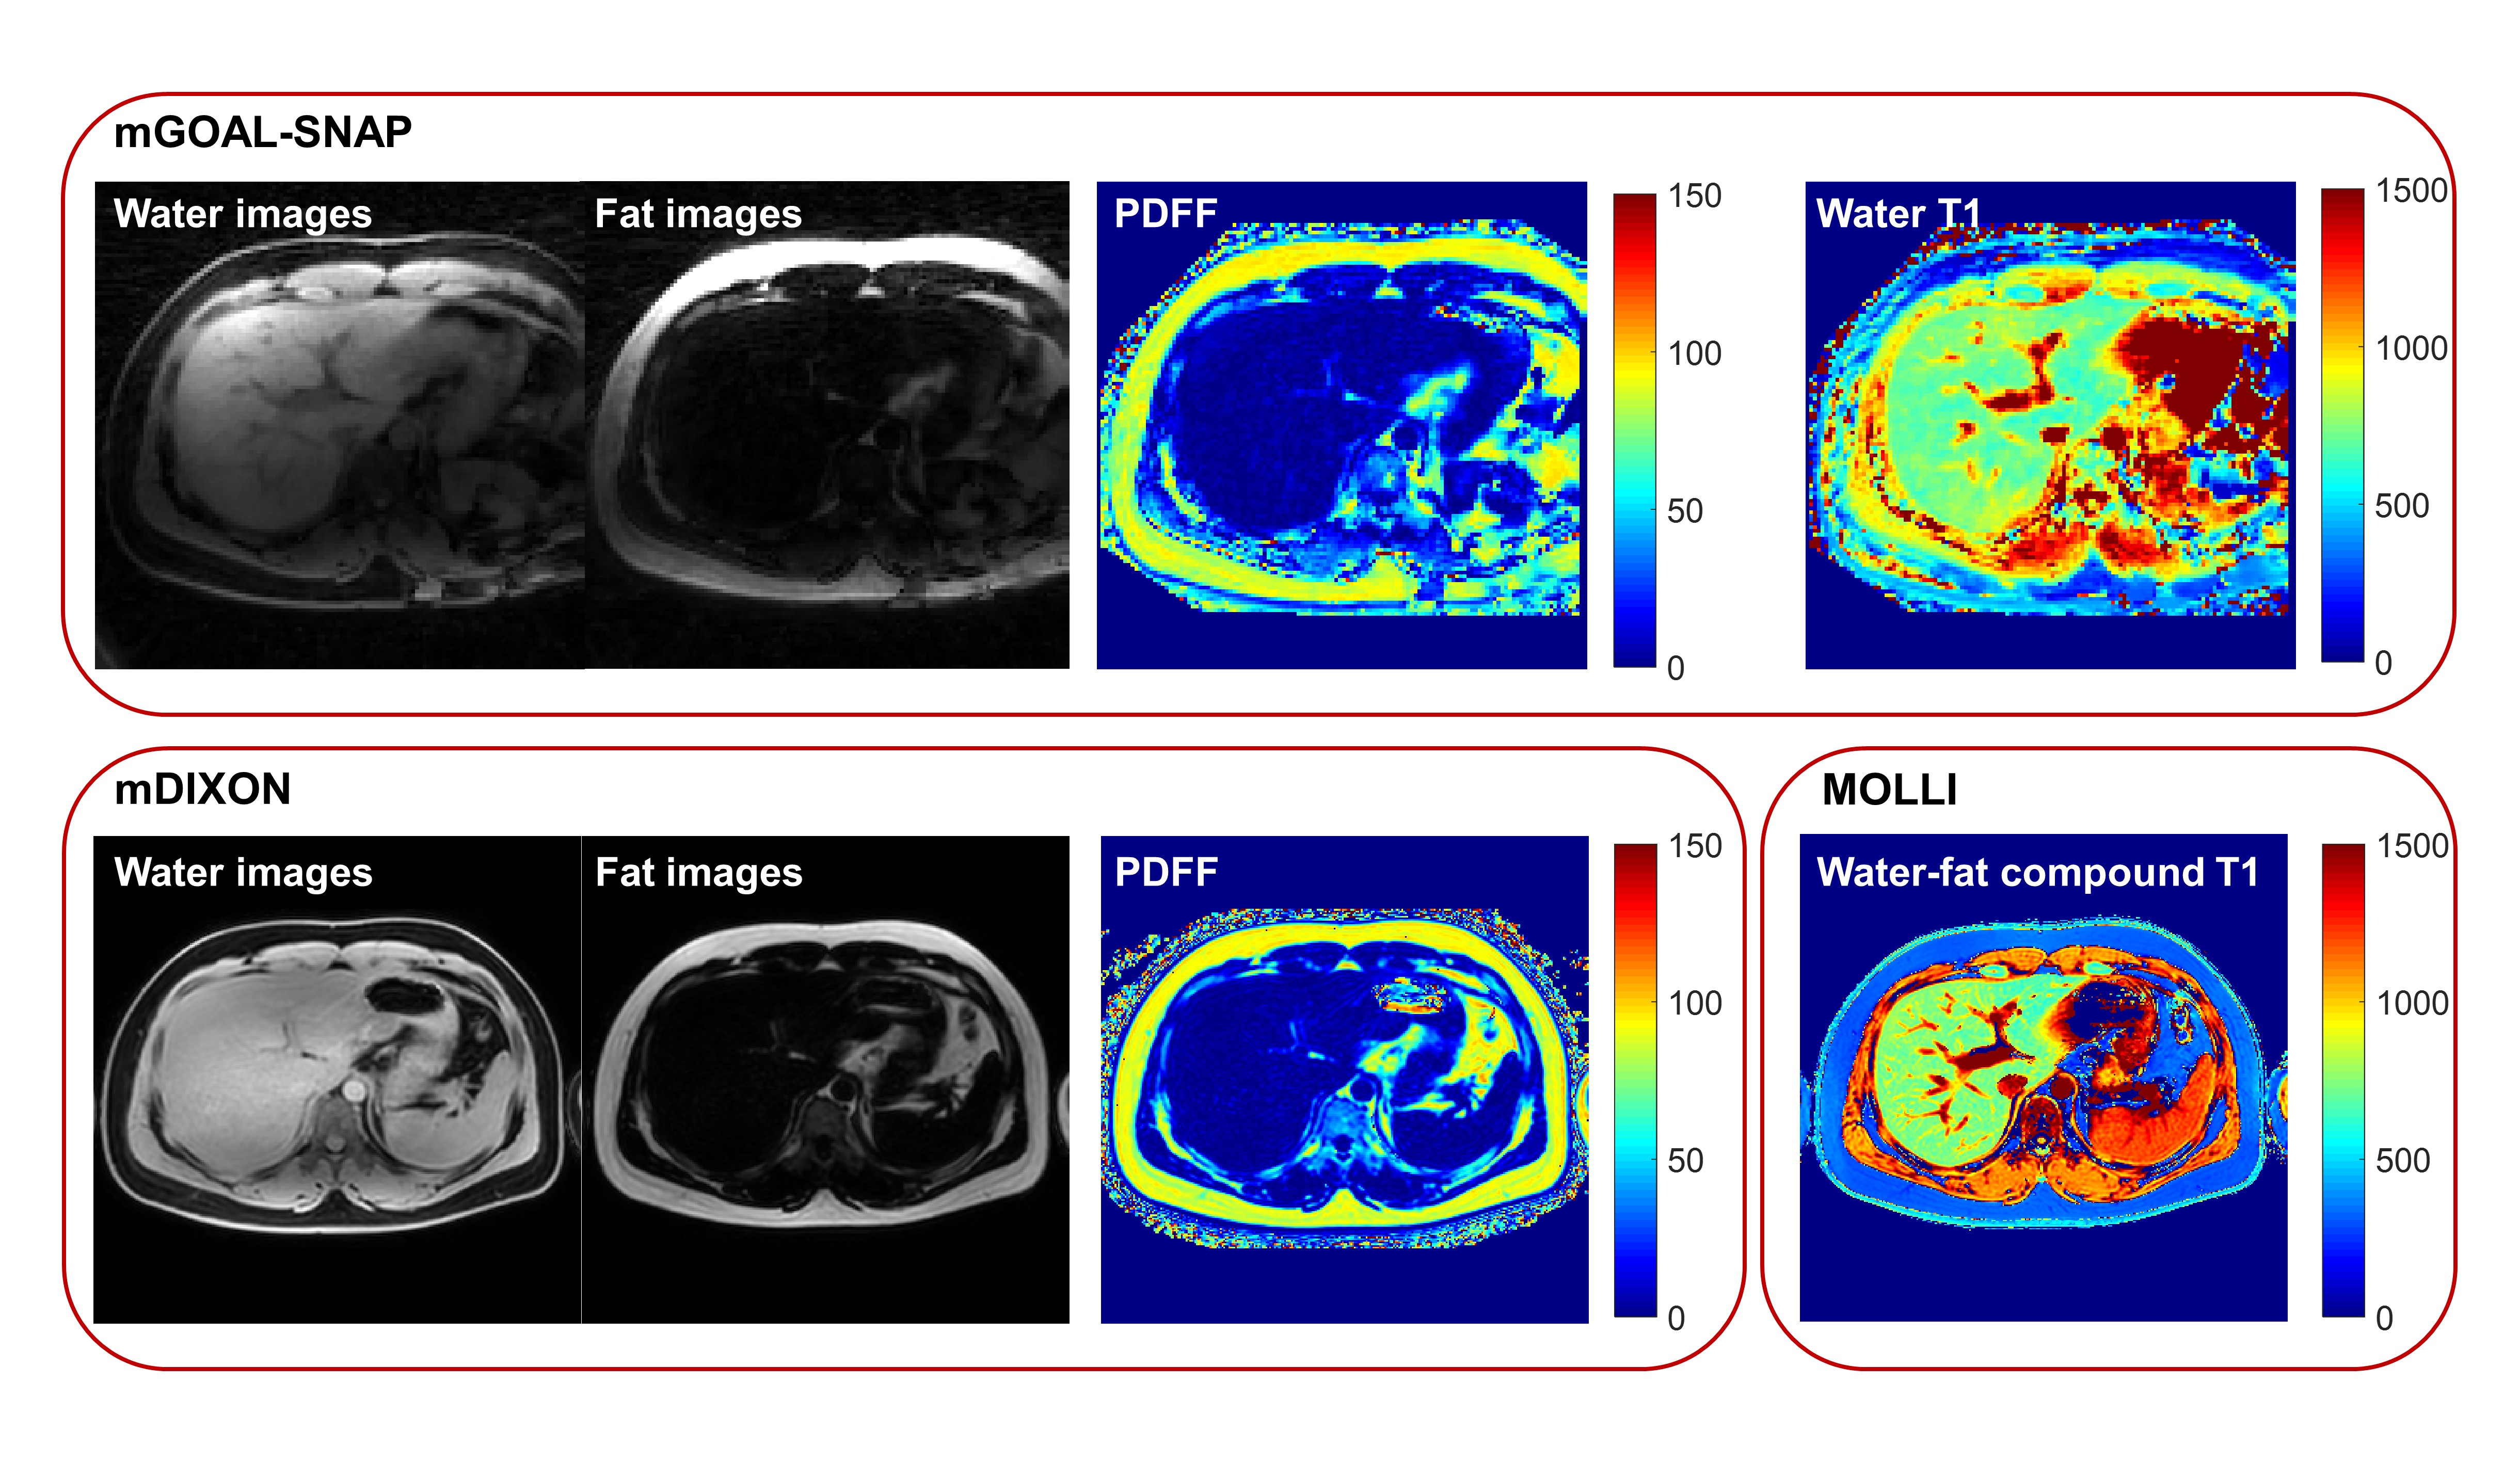
In Vivo Study: After the institutional review board approval and obtained informed consent, 4 volunteers (2 females, age 25.5±2.9 years) were recruited. All the scans were performed on a 3.0T MR scanner (Ingenia CX, Philips Healthcare, Best, Netherlands) using a 16-channel torso coil and a 16-channel posterior coil. Volunteers were instructed to breathe normally during mGOAL-SNAP acquisition. mDIXON Quant and 2D MOLLI15 sequences were also performed under breath-holding for PDFF and T1 comparison. mDIXON sequence covered the whole liver, and three different slices were imaged using three MOLLI sequences. For each volunteer, nine square ROIs (~100 mm2) were manually drawn within the liver region on mGOAL-SNAP, mDIXON, and MOLLI images on identical slices, respectively. The mean PDFF and the mean T1 within each ROI were averaged and compared using Wilcoxon signed-rank test.
Results
The PDFF and water T1 maps of the phantom estimated by the gold standard sequences and the proposed mGOAL-SNAP sequence were shown in Figure 2. The mean PDFF and the mean water T1 values within each tube estimated by mGOAL-SNAP showed good agreements with mDIXON (r = 0.998, p < 0.001), and FS IR-SE (r = 0.997, p < 0.001), respectively. All 4 volunteers completed the MRI acquisitions. The separated water and fat images, PDFF map, and T1 map of two volunteers estimated by mGOAL-SNAP and the compared sequences were shown in Figure 3 and Figure 4. The PDFF from all volunteers calculated by mGOAL-SNAP showed no significant difference with mDIXON (2.8±1.7% vs. 2.6±0.6%, p = 0.64). As volunteers all had extremely low fat fraction in the liver, the liver water T1 by mGOAL-SNAP showed comparable values with liver water-fat compound T1 by MOLLI (784.3±68.3 ms vs. 778.1±57.7 ms, p = 0.44).Discussion and Conclusion
In this study, free-breathing water-fat separation and T1 mapping of the whole liver was achieved simultaneously within one scan using the proposed mGOAL-SNAP sequence. The 3D golden angle radial trajectory used in the proposed sequence is insensitive to motion, thus the estimated PDFF and water T1 maps of volunteers didn’t show obvious motion artifacts. In the future, respiratory motion correction algorithms can be applied to further improve the quantification accuracy, especially in subjects with large respiratory motion. Furthermore, more in-vivo studies on patients with fatty liver are required to explore the clinical value of the proposed technique.Acknowledgements
None.References
1. Kim JE, Kim HO, Bae K, Choi DS, Nickel D. T1 mapping for liver function evaluation in gadoxetic acid-enhanced MR imaging: comparison of look-locker inversion recovery and B(1) inhomogeneity-corrected variable flip angle method. European radiology. 2019;29(7):3584-3594.
2. Zhou ZP, Long LL, Qiu WJ, et al. Evaluating segmental liver function using T1 mapping on Gd-EOB-DTPA-enhanced MRI with a 3.0 Tesla. BMC medical imaging. 2017;17(1):20.
3. Yoon JH, Lee JM, Kim E, Okuaki T, Han JK. Quantitative Liver Function Analysis: Volumetric T1 Mapping with Fast Multisection B(1) Inhomogeneity Correction in Hepatocyte-specific Contrast-enhanced Liver MR Imaging. Radiology. 2017;282(2):408-417.
4. Luetkens JA, Klein S, Traeber F, et al. Quantitative liver MRI including extracellular volume fraction for non-invasive quantification of liver fibrosis: a prospective proof-of-concept study. Gut. 2018;67(3):593-594.
5. Luetkens JA, Klein S, Träber F, et al. Quantification of Liver Fibrosis at T1 and T2 Mapping with Extracellular Volume Fraction MRI: Preclinical Results. Radiology. 2018;288(3):748-754.
6. Obmann VC, Mertineit N, Marx C, et al. Liver MR relaxometry at 3T - segmental normal T(1) and T(2)* values in patients without focal or diffuse liver disease and in patients with increased liver fat and elevated liver stiffness. Scientific reports. 2019;9(1):8106.
7. Fahlenkamp UL, Ziegeler K, Adams LC, Böker SM, Engel G, Makowski MR. Native T1 mapping for assessment of the perilesional zone in metastases and benign lesions of the liver. Scientific reports. 2020;10(1):12889.
8. Mansour JC, Aloia TA, Crane CH, Heimbach JK, Nagino M, Vauthey J-N. Hilar Cholangiocarcinoma: expert consensus statement. HPB. 2015;17(8):691-699.
9. Chan RW, Ramsay EA, Cunningham CH, Plewes DB. Temporal stability of adaptive 3D radial MRI using multidimensional golden means. Magnetic resonance in medicine. 2009;61(2):354-363.
10. Qi H, Sun J, Qiao H, et al. Carotid Intraplaque Hemorrhage Imaging with Quantitative Vessel Wall T1 Mapping: Technical Development and Initial Experience. Radiology. 2018;287(1):276-284.
11. Qi H, Qiao H, Sun A, et al. Highly Undersampled Kooshball Reconstruction with Low-rank Modeling and Sparsity Constraints for High-resolution T1 Mapping. Paper presented at: In Proceedings of the 26th Annual Meeting of ISMRM 2018; Paris, France.
12. Hernando D, Kellman P, Haldar JP, Liang ZP. Robust water/fat separation in the presence of large field inhomogeneities using a graph cut algorithm. Magnetic resonance in medicine. 2010;63(1):79-90.
13. Hines CD, Yu H, Shimakawa A, McKenzie CA, Brittain JH, Reeder SB. T1 independent, T2* corrected MRI with accurate spectral modeling for quantification of fat: validation in a fat-water-SPIO phantom. Journal of magnetic resonance imaging: JMRI. 2009;30(5):1215-1222.
14. Bernard CP, Liney GP, Manton DJ, Turnbull LW, Langton CM. Comparison of fat quantification methods: a phantom study at 3.0T. Journal of magnetic resonance imaging: JMRI. 2008;27(1):192-197.
15. Messroghli DR, Radjenovic A, Kozerke S, Higgins DM, Sivananthan MU, Ridgway JP. Modified Look-Locker inversion recovery (MOLLI) for high-resolution T1 mapping of the heart. Magnetic resonance in medicine. 2004;52(1):141-146.
Figures