3650
Evaluating Repeatability of Low b-value DTI of CSF using Novel Angular Tensor-Correlation-Coefficient1FUJIFILM Healthcare Corporation, Tokyo, Japan, 2Hokkaido University Graduate School of Medicine, Sapporo, Japan
Synopsis
Low b-value DTI (Low-b DTI) has been recently proposed for investigating the CSF pseudorandom flow. High repeatability of Low-b DTI is essential for the investigation; however, an efficient index evaluating repeatability of both shape and orientation of DT has not been presented. In this study, a new index, angular tensor-correlation-coefficient (ATCC), was proposed and was demonstrated to have good features in understanding the degree of repeatability by Monte Carlo simulation. ATCC was used to evaluate the repeatability of an experiment about Low-b DTI of CSF and showed high repeatability of this experiment.
Introduction
Low b-value diffusion tensor imaging (Low-b DTI) was reported to quantify the CSF pseudorandom flow1. Low-b DTI showed high repeatability regarding the mean diffusivity (MD) and the fractional anisotropy (FA); however, it showed moderate repeatability regarding the dispersion of principal eigenvector (DPE). Precisely, DPE varied depending on the shape of DT, ex. DPE became higher when FA was lower, because DPE is determined only by orientations of DT, which is suitable for evaluating stability of fiber orientation in the white matter (WM) where DT is prolate with high FA2,3. Conversely, Low-b DTI of CSF takes both prolate and oblate DTs and mostly takes lower FA compared to DTI of WM. Accordingly, an efficient index is needed for evaluating repeatability of both shape and orientation of Low-b DTI. In this study, a new index, angular tensor-correlation-coefficient (ATCC), was proposed and demonstrated its efficiency.Methods
Definition of Angular Tensor-Correlation-CoefficientA new index ATCC is defined as the following equation based on tensor-correlation-coefficient (TCC) which was proposed for evaluating similarity between metabolites DTs4,5:$$
ATCC\left(\Lambda,\Psi\right)=\left(\pi/2\right)\arcsin\left(\sqrt{TCC(\Lambda,\Psi)}\right)=\left(\pi/2\right)\arcsin\left(\sqrt{\sum_{i=1}^3\sum_{j=1}^3\lambda_{i}\psi_{j}\left(v_{i}\cdot{w_{j}}\right)^{2}/\sqrt{\left(\sum_{i=1}^3\lambda_{i}^2\right)\left(\sum_{j=1}^3\psi_{j}^2\right)}}\right),$$
where λi and vi are eigenvalues and eigenvectors of Λ, ψj and wj are eigenvalues and eigenvectors of Ψ, and · denotes the inner product of two vectors. Uncorrelations, 1–TCC and 1–ATCC, are used to show dissimilarity of DTs. To compare features of DPE, 1-TCC and 1-ATCC, these values of two crossing same spheroids were calculated for various λ1 and crossing angle θ (Fig. 1). 1-ATCC shows good features to measure dissimilarity of DTs, such that it takes 0 when λ1 = 1 or θ = 0 and it linearly increases with distance of λ1 from 1 or distance of θ from 0.Deviation index 1-ATCC of repeated scan is defined as the following equation:$$
1-ATCC\left(\left\{\Lambda_{i}\right\}_{i=1,N}\right)=Mean\left(1-ATCC\left(\Lambda_{i},\bar{\Lambda}\right)\right),$$
where Λi is the i-th measured DT and $$$\bar{\Lambda}$$$ is the mean DT of measured DTs.
Monte Carlo Simulation
To investigate statistical features of proposed deviation index 1-ATCC, the following simulation was performed. Target diffusion tensors were modeled as spheroid of which MD = 10 × 10-9 m2/s and λ1/MD changes from 0.2 to 2.6. DW signals of each model were generated 10,000 times with the assumption that diffusion gradients with b = 0/100 × 106 s/m2 and 15 non-colinear directions, and by adding normally-distributed noise of which SNR = 1, 3, 5, or 7%. DTs were calculated from the DW signals, and the coefficient of variance (CV) of the MD, the standard deviation (SD) of FA, DPE, 1–TCC and 1-ATCC were compared at each λ1 and SNR.
Repeatability of Low-b DTI of CSF
This study was approved by the ethics committee of FUJIFILM Healthcare Corporation. The same data in the repeatability test of ref. 1 was used. Three healthy volunteers were scanned three times using a 3T MRI (TRILLIUM OVAL, FUJIFILM Healthcare Corporation, Tokyo, Japan) and DW-EPI with same b-values and directions described in the Monte Carlo simulation. A dedicated offline program was used to calculate Low-b DTI of CSF. To assess repeatability of Low-b DTI, CV(MD), SD(FA), DPE, 1–TCC and 1-ATCC were calculated at representative ROIs.
Results
Figure 2 shows the results of the Monte Carlo simulation. DPE is high and independent from SNR when λ1/MD ≤ 1, and changes too drastically at small λ1/MD ≥ 1. Contrarily, 1-ATCC shows almost the same linear response to SNR at all λ1/MD like CV(MD) and SD(FA).Figure 3 shows the results of the repeatability of Low-b DTI of CSF. Although DPE shows moderate dispersion (0.2 – 0.4), it takes lower values in higher FA ROIs (a,b) and higher value in lower FA ROI (f). Contrarily, 1-ATCC consistently takes low deviation (0.02 – 0.09) at all the ROIs.
Discussion
Monte Carlo simulation shows that DPE is harder to be used when the shape of DT is closer to a sphere because only the small noise largely changes the direction of the principal eigenvector. DPE is useful for testing the stability of the orientation of DT; however, the shape of DT, such as FA, should be taken into account for understanding the value. Contrarily, 1–ATCC has good statistical features, for example, its linear response to SNR regardless of the shape of DT is easy to understand the value.Evaluation of Low-b DTI of CSF clearly shows the high repeatability by using 1-ATCC similar with CV(MD) and SD(FA) in this experiment. However, the measurement parameter of Low-b DTI of CSF, such as TR, TE, DW, and so on, have not been well established; and thus, a well-designed index is necessary for testing the repeatability. The proposed deviation index using 1-ATCC is expected to be used for this test.
Conclusion
Novel index ATCC was proposed for evaluating repeatability of DTI. Monte Carlo simulation reveals that ATCC has suitable statistical features, such as an almost linear response with SNR. ATCC was used for evaluating repeatability of Low-b DTI of CSF; ATCC showed high repeatability at all the ROIs although the DPE showed moderate and altered repeatability depending on the FA of the ROIs. It demonstrates that ATCC can evaluate repeatability of shape and orientation of Low-b DTI of CSF in an integrated manner.Acknowledgements
No acknowledgement found.References
1. Bito Y, et al. Low b-value diffusion tensor imaging for measuring pseudorandom flow of cerebrospinal fluid. Magn Reson Med. 2021;86:1369-1382.
2. Basser PJ, et al. Statistical artifacts in diffusion tensor MRI (DT-MRI) caused by background noise. Magn Reson Med. 2000;44:41-50.
3. Jones DK. Determining and visualizing uncertainty in estimates of fiber orientation from diffusion tensor MRI. Magn Reson Med. 2003;49:7-12.
4. Bito Y, et al. Diffusion tensor spectroscopic imaging of rat brains. In Proc ISMRM, 2011, p. 408.
5. Brandejsky V, et al. Proton diffusion tensor spectroscopy of metabolites in human muscle in vivo. Magn Reson Med. 2015;73:481-487.
Figures
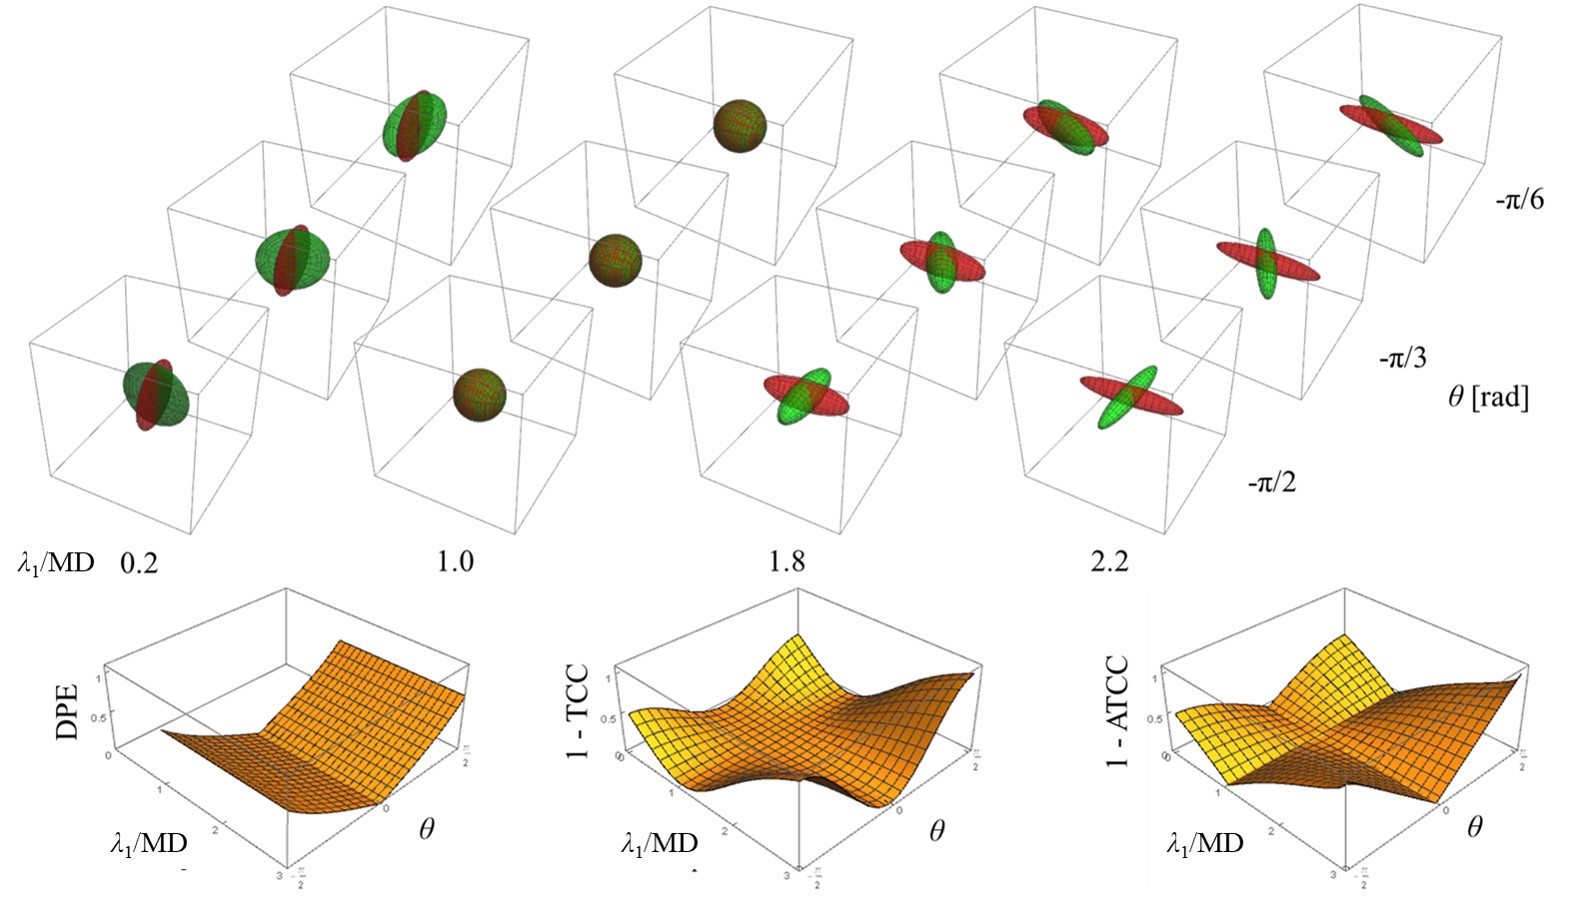
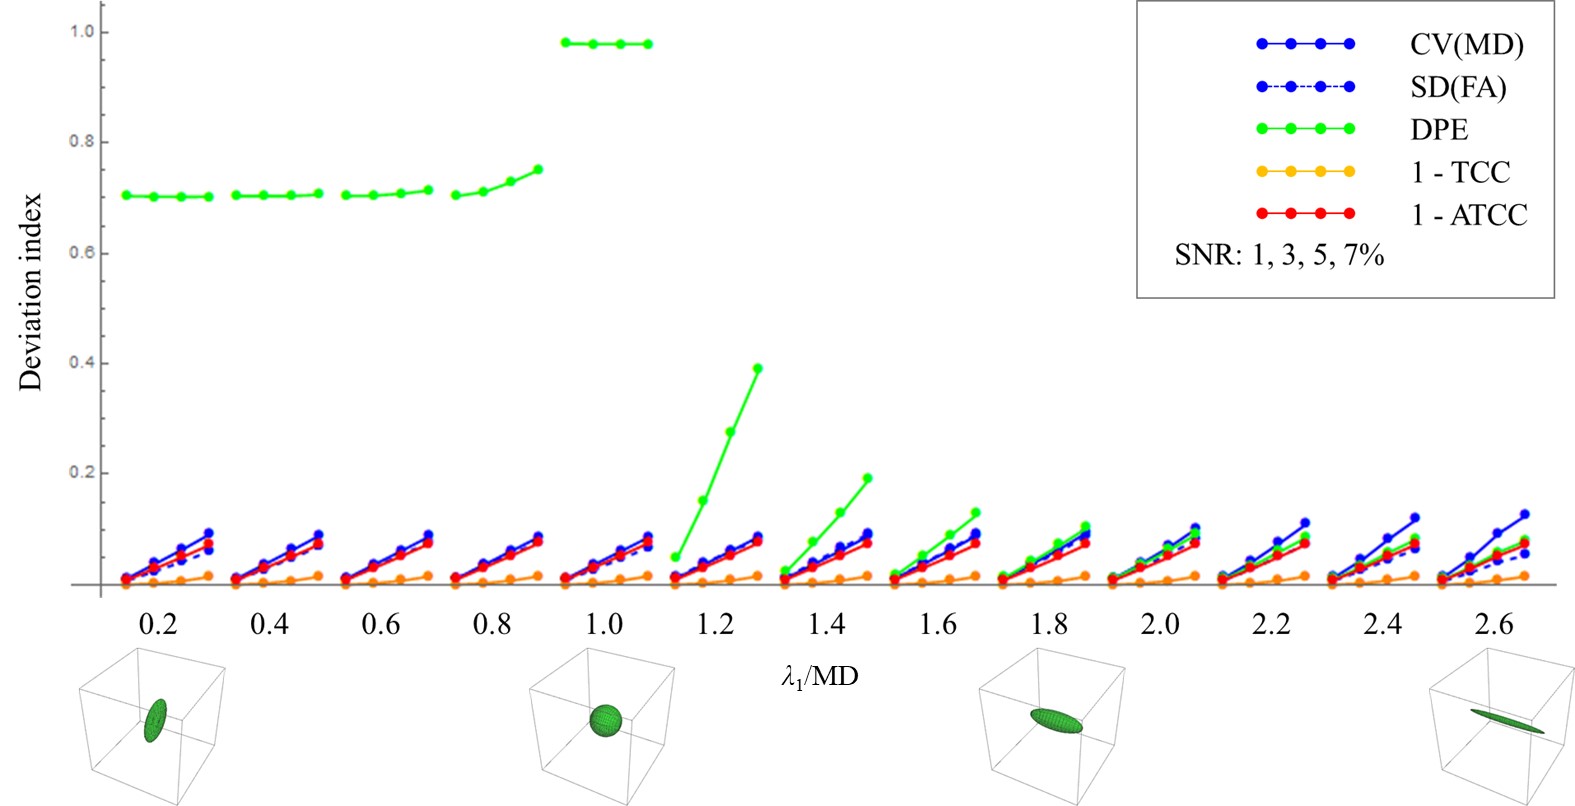
Figure 2. Resultant deviation indexes of Monte Carlo simulation with various eigenvalue λ1 and SNR. CV(MD) and SD(FA) change almost linear with SNR for all λ1. DPE does not reflect SNR at all when λ1/MD ≤ 1, and drastically changes with SNR at small λ1/MD ≥ 1. 1-TCC does not change so much with SNR. 1-ATCC changes almost linear with SNR for all λ1.
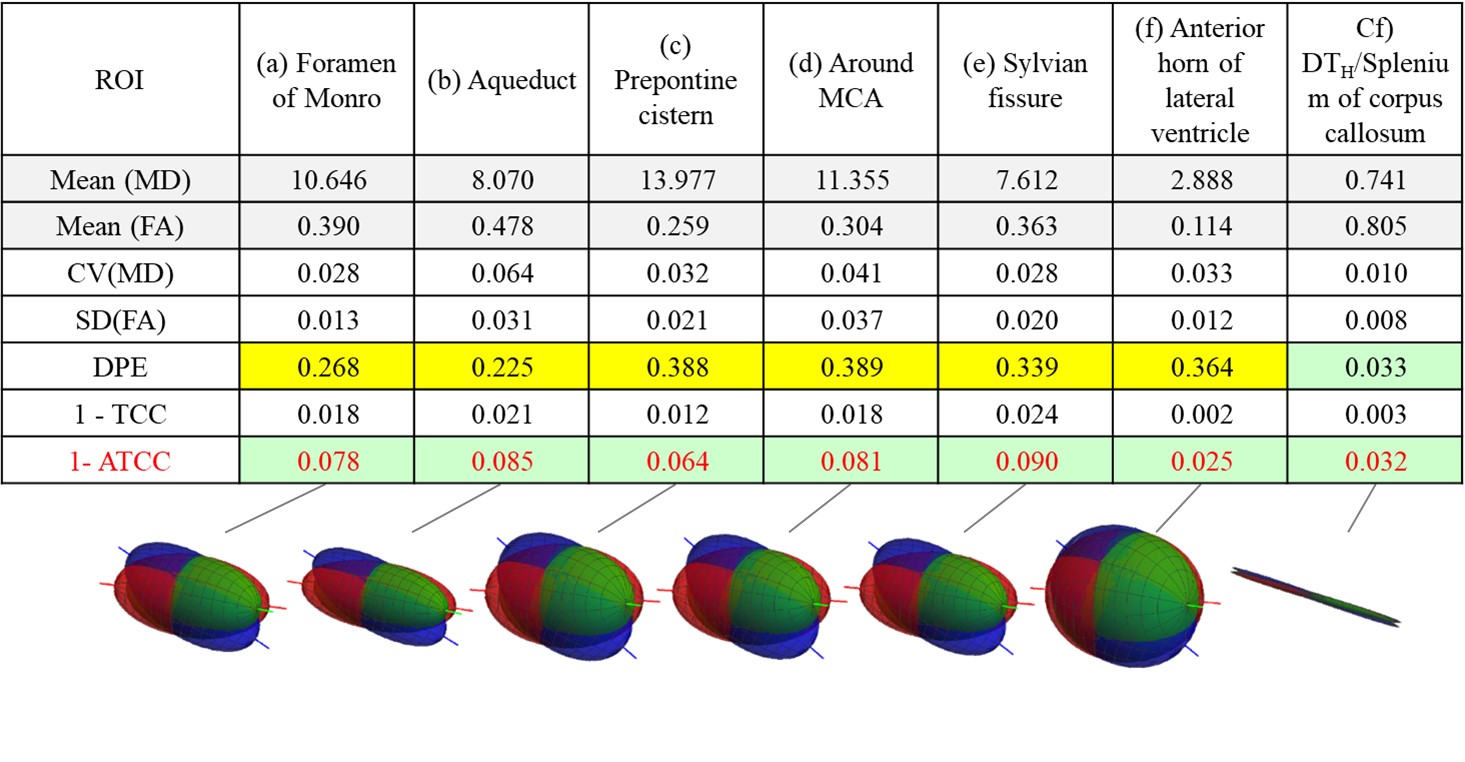
Figure 3. Statistical results about repeatability analysis of Low-b DTI of CSF. Deviation indexes, CV(MD), SD(FA), DPE, 1-TCC and 1-ATCC, are calculated at every ROI. Lower figure schematically shows three same spheroids with the Mean(FA) and the DPE at every ROI. CV(MD) and SD(FA) show high repeatability at all the ROIs. DPE shows moderate repeatability and takes higher value at ROIs with lower FA. Contrarily, 1-ATCC consistently shows high repeatability at all the ROIs.