3648
The Role of Electric Properties Tomography in Biochemical Analysis of the Cerebrospinal Fluid and Parameter Optimization for Improved Accuracy
Khin Khin Tha1, Ulrich Katscher2, Hiroyuki Hamaguchi3, Xinnan Li3, Tomohiro Kawasaki4, Shigeru Yamaguchi5, Ichiro Yabe5, and Hideki Hyodoh5
1Global Center for Biomedical Science and Engineering, Hokkaido University Faculty of Medicine, Sapporo, Japan, 2Philips Research, Hamburg, Germany, 3Hokkaido University Graduate School of Biomedical Science and Engineering, Sapporo, Japan, 4Hokkaido University Hospital, Sapporo, Japan, 5Hokkaido University Faculty of Medicine, Sapporo, Japan
1Global Center for Biomedical Science and Engineering, Hokkaido University Faculty of Medicine, Sapporo, Japan, 2Philips Research, Hamburg, Germany, 3Hokkaido University Graduate School of Biomedical Science and Engineering, Sapporo, Japan, 4Hokkaido University Hospital, Sapporo, Japan, 5Hokkaido University Faculty of Medicine, Sapporo, Japan
Synopsis
This study was aimed to evaluate if electrical conductivity (σ) by electric properties tomography (EPT) could detect variations in the cerebrospinal fluid (CSF) biochemical composition and if optimization of scan and analysis parameters improved the accuracy of in vivo σ measurements. σ values varied among patients and CSF samples with varying CSF biochemical composition, and showed significant correlation with CSF albumin concentration and total cell count. σ may be sensitive to CSF abnormalities. Optimization of scan and analysis parameters is important for the accuracy of in vivo σ measurements.
Background and Purpose
The cerebrospinal fluid (CSF) is composed of water, organic substances, and electrolytes1. Its composition varies in diseased states so that its biochemical analysis through lumbar puncture is often performed to diagnose neurological diseases. However, lumbar puncture is invasive and associated with side effects. Therefore, a non-invasive alternative is desired. Electric properties tomography (EPT) is an MRI technique that noninvasively estimates the tissues' electrical conductivity (σ) from the phase of an MRI scan2. Previous studies have documented its potential diagnostic role in glioma3,4, breast tumors5,6, and hepatic fibrosis7. Phantom experiments have also shown an increase in σ with increasing saline and protein concentrations8. Thus, σ may detect a variation in the CSF composition. However, α measurement in the CSF can be severely affected by flow-related artifacts9.This study was aimed to evaluate if σ by EPT could detect variations in the CSF biochemical composition and if optimization of scan and analysis parameters improved the accuracy of in vivo σ measurements.
Methods
To evaluate if σ could detect variations in the CSF biochemical composition, ex vivo and in vivo experiments were conducted. The former was performed using 42 serial cadaveric CSF samples, and the latter included 13 serial patients with known CSF biochemical composition. For both experiments, phase-based EPT was conducted using a 3T scanner and a 32-channel head coil. A 3D-SSFP sequence (TR/TE=3.5/1.7 ms, FA=25o, non-selective RF pulse) was used. σ was calculated by using the formula σ= ∇2 φ+/ (μω), where φ+=the phase of H+ {the positive circularized component of the magnetic field H+=(Hx+iHy)/2}, μ=magnetic vacuum permeability, and ω=Larmor frequency. In the ex vivo experiment, five ROIs were placed in the artifact-free CSF. The average σ histogram metrics (i.e., mean, median, mode, minimum, maximum) were extracted. For in vivo experiments, ten ROIs were placed at lateral ventricles. The histogram metrics were then extracted. These histogram metrics were then tested for correlation with the CSF composition. Pearson's product-moment correlation analyses were used to determine significance as P<0.05.Three repeated scans were performed in a volunteer under three different conditions, i.e., (1) the whole brain coverage as in vivo experiment, 3 cm thick (2) axial, and (3) coronal slabs covering the third and lateral ventricles, to evaluate if optimization of scan parameters improved the measurement accuracy. For (2) and (3), 20 dynamic scans were acquired (TR/TE=4.2/2.1 ms, FA=30o), and σ reconstruction was done by calculating the upper quartile of the conductivity over the dynamics. The ICC values among scans were then extracted to evaluate reproducibility.
The CSF of the 13 patients from the in vivo study was semiautomatically segmented to evaluate if optimization of analysis parameters improved the accuracy of measurements. The extraction of histogram metrics followed. Correlation with the CSF biochemical composition was tested using Pearson's product-moment correlation analyses. The correlation coefficient values (r) were compared to those derived by manually-placed ROIs.
Results
In the ex vivo study, the mean, maximum, and median of σ showed a moderate positive correlation with the CSF polymorph count (Fig 1). In the in vivo study, a moderate positive correlation was observed between any σ histogram metric and the CSF albumin concentration and between the minimum σ and total cell count (Fig 2). Illustrative examples are given in Fig 3 and Fig 4.The serial σ maps generated with each scan condition are shown in Fig 5. The ICC values were excellent for axial (0.93-0.99) and coronal (0.91-0.97) slabs. That for the whole brain was moderate to excellent (0.73-0.90). However, the ICC among different scan planes was poor to moderate (0.46-0.67).
A trend toward an increase in the maximum σ of the semiautomatically segmented CSF with increasing immunoglobin G concentration (r=0.65, P=0.06) was observed. However, this correlation did not reach statistical significance. Furthermore, no other significant correlation was observed between the σ histogram metrics of the segmented CSF and the CSF biochemical composition (P>0.10).
Discussion
The results suggest that σ holds the potential to become a non-invasive lumbar puncture alternative in estimating CSF albumin concentration and cell counts. It is thought that an increase in albumin concentration or cell count triggered a change in ionic environment to induce an σ increase.The ICC for the whole brain scans suffers from the pulsation effects of CSF. It has been found that the applied combination of different dynamics can improve ICC. However, the acquired dynamic slabs allow essentially only a 2D differentiation of φ+ instead of its default 3D differentiation. The impact of the missing differentiation direction depends in first order on the spatial geometry of the tissue structure. It can be expected that this impact is similar across different patients. Thus, it enables a relative comparison of reconstructed conductivity across different patients for the same slab orientation and comparable placement of the slabs.
Evaluation of analysis parameters also showed superior performance of manually-placed ROIs over semiautomatically segmented ROIs. The reason may be the inclusion of artifacts in the segmented ROIs.
Conclusions
σ derived from EPT may have added value in estimating the CSF biochemical composition. Reproducibility of measurements may permit its application in serial assessments. Measurements with manually-placed ROIs are recommended if special measures against flow artifacts cannot be taken.Acknowledgements
This study was supported by JSPS KAKENHI Grant Number 20K12590.References
- Sembulingam K, Sembulingam P. "Cerebrospinal Fluid." In Essentials of Physiology for Dental Students, 679. Jaypee Brothers Medical Publishers (P) Ltd., 2016. http://dx.doi.org/10.5005/jp/books/12902_109.
- Katscher U, Kim DH, Seo JK. Recent progress and future challenges in MR electric properties tomography. Comput Math Methods Med. 2013;2013:546562.
- Tha KK, Katscher U, Yamaguchi S, Stehning C, Terasaka S, Fujima N, Kudo K, Kazumata K, Yamamoto T, Van Cauteren M, Shirato H. Noninvasive electrical conductivity measurement by MRI: a test of its validity and the electrical conductivity characteristics of glioma. Eur Radiol. 2018 Jan;28(1):348-355.
- Park JE, Kim HS, Kim N, Kim YH, Kim JH, Kim E, Hwang J, Katscher U. Low conductivity on electrical properties tomography demonstrates unique tumor habitats indicating progression in glioblastoma. Eur Radiol. 2021 Sep;31(9):6655-6665.
- Kim SY, Shin J, Kim DH, Kim MJ, Kim EK, Moon HJ, Yoon JH. Correlation between conductivity and prognostic factors in invasive breast cancer using magnetic resonance electric properties tomography (MREPT). Eur Radiol. 2016 Jul;26(7):2317-26.
- Mori N, Tsuchiya K, Sheth D, Mugikura S, Takase K, Katscher U, Abe H. Diagnostic value of electric properties tomography (EPT) for differentiating benign from malignant breast lesions: comparison with standard dynamic contrast-enhanced MRI.Eur Radiol. 2019 Apr;29(4):1778-1786.
- Tha KK, Kikuchi Y, Ishizaka K, Kamiyama T, Yoneyama M, Katscher U. Higher Electrical Conductivity of Liver Parenchyma in Fibrotic Patients: Noninvasive Assessment by Electric Properties Tomography. J Magn Reson Imaging. 2021 Nov;54(5):1689-1691.
- Tha KK, Katscher U, Yamaguchi S, Yabe I, Hyodoh H, Noninvasive Assessment of the Cerebrospinal Fluid Composition by MRI: Does Electric Properties Tomography Have A Role? 2021-SP-15793-RSNA
- Katscher U, Stehning C, Tha KK. The impact of CSF pulsation on reconstructed brain conductivity. Proc Intl Soc Mag Reson Med 2018;26:546.
Figures
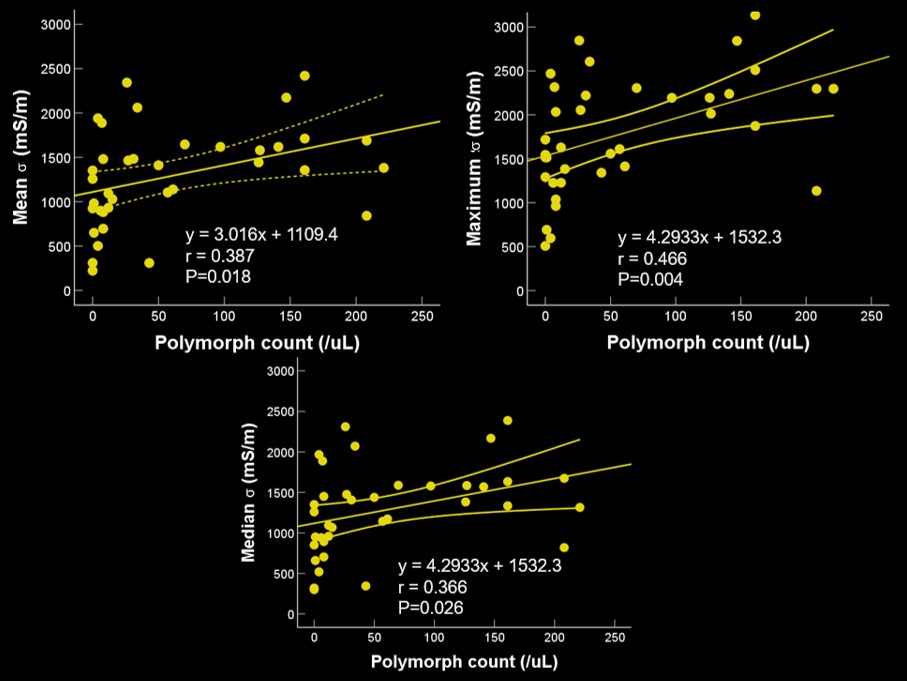
Pearson's product-moment correlation analyses show a moderate positive correlation between the mean, maximum, and median of electrical conductivity (σ) and the cerebrospinal fluid (CSF) polymorph count. Statistical significance is set as P<0.05. The straight and dotted lines indicate the mean and 95‰ confidence interval.
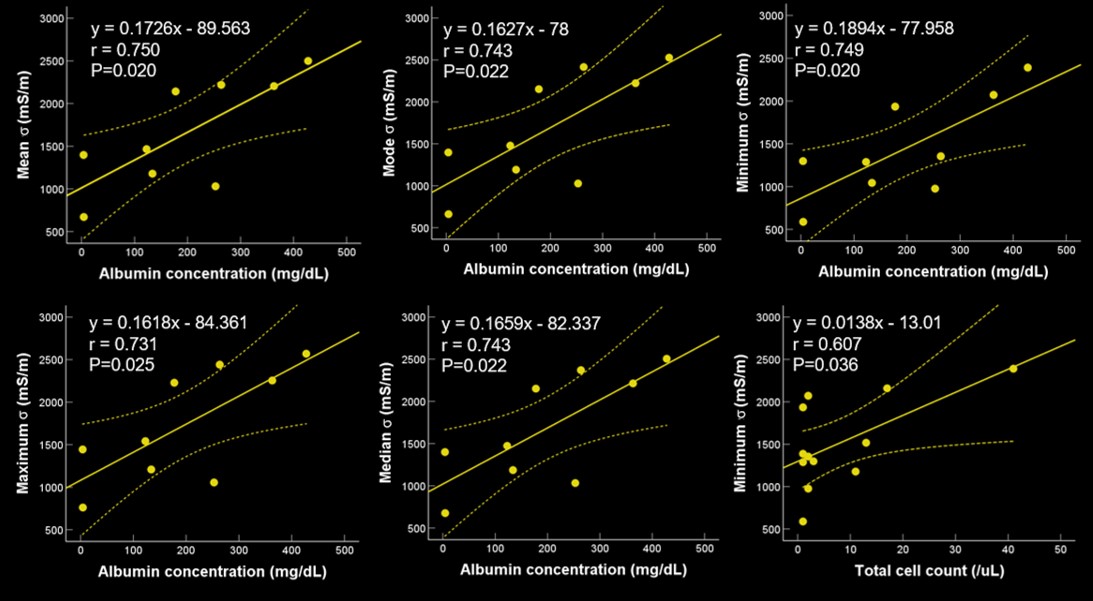
Pearson's product-moment correlation analyses show a moderate positive correlation between the electrical conductivity (σ) histogram metrics and the cerebrospinal fluid (CSF) albumin concentration and between the minimum σ and total cell count. Statistical significance is set as P<0.05. The straight and dotted lines indicate the mean and 95‰ confidence interval.
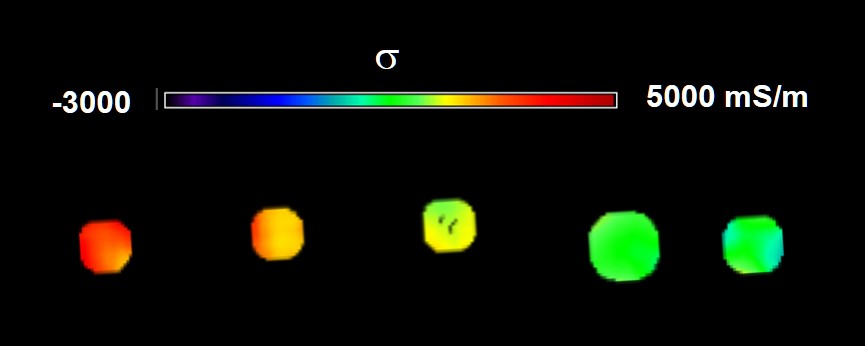
The electrical conductivity (σ) maps of cadaveric cerebrospinal fluid (CSF) samples show variation in σ of the CSF across cadaveric CSF samples. The look-up table indicates values in mS/m.
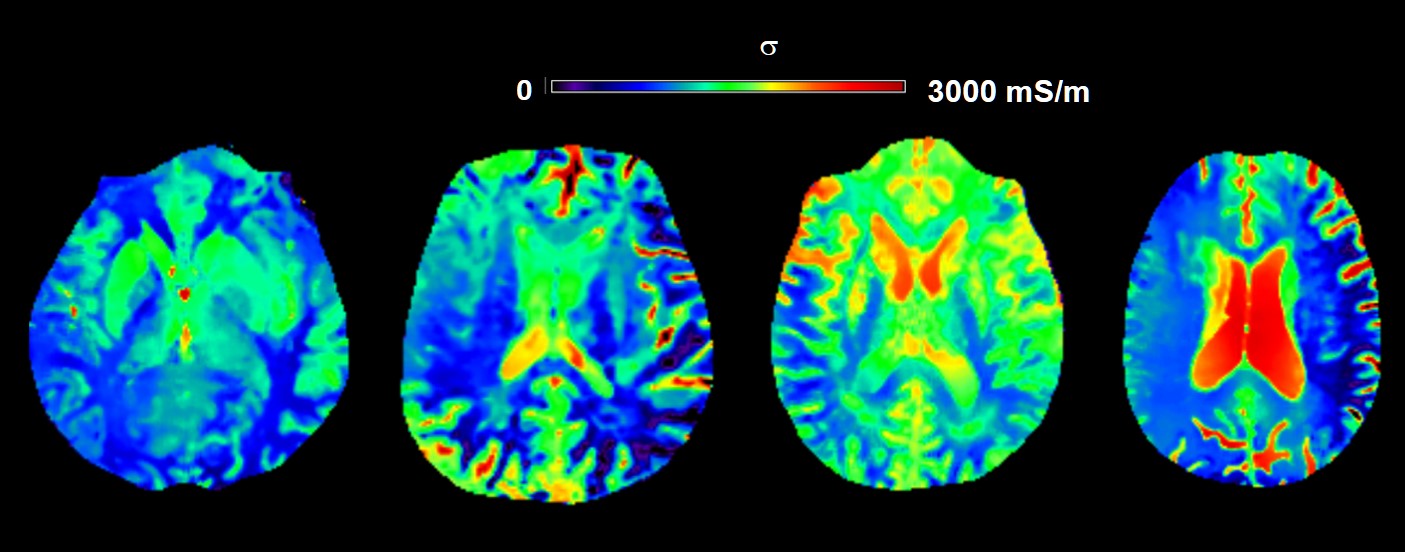
The electrical conductivity (σ) maps of 4 patients show variation in σ of the cerebrospinal fluid (CSF) within ventricles and sulci. The look-up table indicates σ values in mS/m.
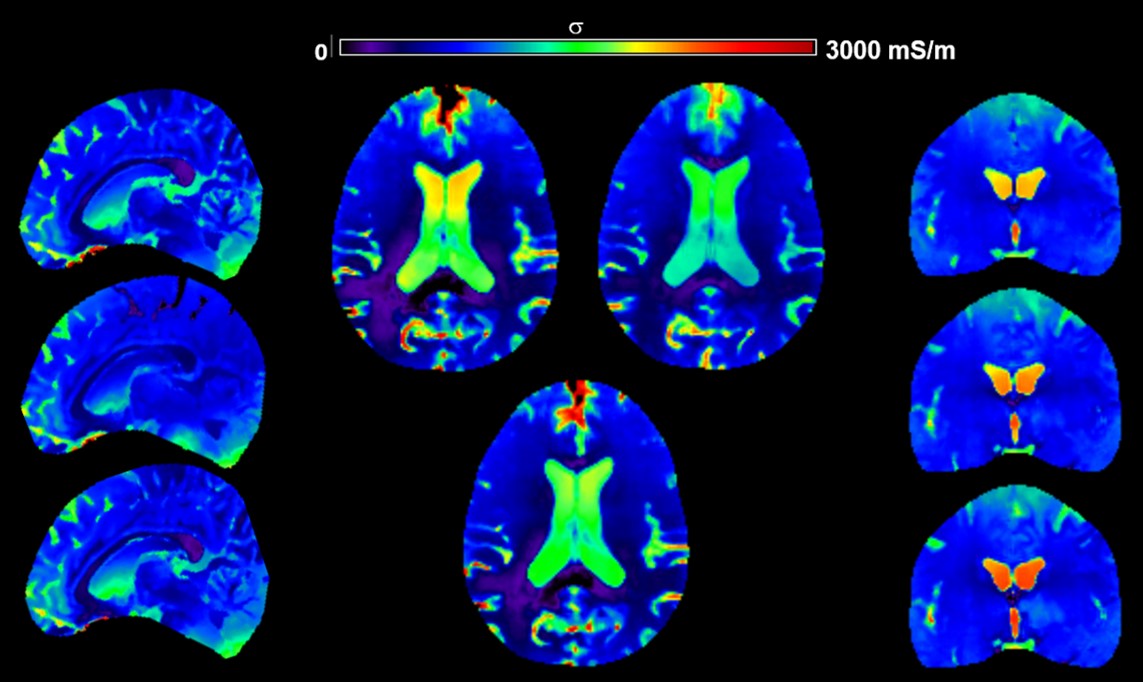
The serial electrical conductivity (σ) maps of a volunteer show the reproducibility of σ values of the CSF. From right to left are (1) the whole brain coverage, 3 cm thick (2) axial and (3) coronal slab covering the third and lateral ventricles. The look-up table indicates σ values in mS/m. Moderate to excellent intraclass correlation coefficient (ICC) is observed for the whole brain images (0.73-0.90), and excellent ICC is observed for axial (0.93-0.99) and coronal (0.91-0.97) slabs.
DOI: https://doi.org/10.58530/2022/3648