3646
Neuronal metabolic biomarkers in cerebellum of Spinocerebellar ataxia type 2 and 12 patients1Department of NMR & MRI Facility, All India Institute of Medical Sciences, New Delhi, India, 2Department of Neurology, All India Institute of Medical Sciences, New Delhi, India, 3School of Computer & Systems Sciences, Jawaharlal Nehru University, New Delhi, India
Synopsis
Spinocerebellar Ataxia (SCA) is a genetic and hereditary disorder that leads to severe disability in balance, speech, posture, etc. SCA2 and SCA12 are two sub-types, which have different CAG repeat expansion on chromosome with different pathologies. In vivo MR spectroscopy was acquired using single voxel Point Resolved Spectroscopy Sequence (PRESS) in the left cerebellum. SCA2 showed a decrease in NAA and Cho and increased mI concentration as compared to controls and an increase in mI values as compared to that in SCA12, which may be attributed to the motor and cognitive dysfunctions in SCA, reflecting more atrophy in SCA2.
Introduction
Motor control, voluntary activity (such as balance, speech, posture, etc.,) are believed to be controlled by cerebellum, which also plays a role in cognitive functions1. A correlation of the cerebellum with pre- and supplementary motor areas has also been reported2,3. Spinocerebellar Ataxia (SCA) is associated with atrophy of the cerebellum, its progressive degeneration and the CAG repeat expansion on chromosome4,5. Different types of SCA (SCA types: 1, 2, 3, 6, 7, 10, 12, 14 and 17) have various pathologies, viz., acquired, and/or genetically transmitted6. Spinocerebellar Ataxia Type 2 (SCA 2) is a progressive and genetic disease caused by mutations in the ATXN2 gene, with symptoms of uncoordinated slow movement or ataxia, speech and swallowing difficulties and dementia. SCA type 12 is a very rare disease and more prevalent in Indian subcontinent7. It is characterized by a slow progression of ataxia and onset of tremor of the upper body part. It also presents Parkinsonian features, dementia, action tremor signs in the patients. We used MR spectroscopy (MRS) to investigate neurochemical profiles as potential biomarkers of diagnosis, prognosis or severity of the disease in SCA.Methodology
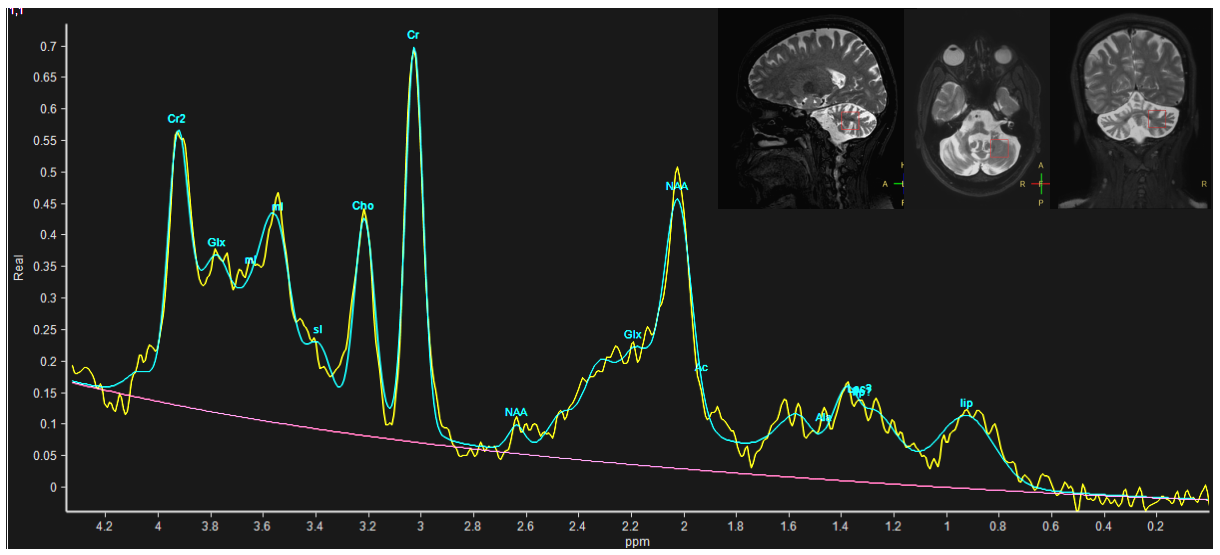
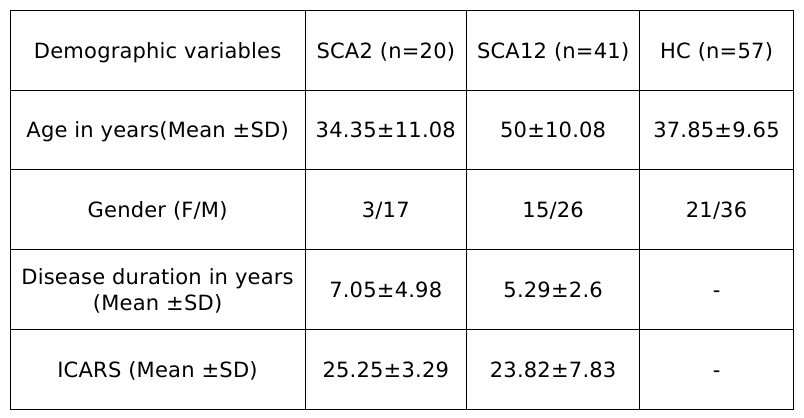
Symptomatic and genetically confirmed SCA2 (n=20, age 34.35±11.08 years), SCA12 (n=41, age 50±10.08 years) patients and healthy controls (HC, n=57, mean age 37.85±9.65 years) were recruited after institutional ethical clearance. MR data were acquired on a 3T MR scanner (Ingenia 3.0 T, M/s. Philips Healthcare, The Netherlands) using 32-channel phase array head coil. T1 weighted 3D Turbo Field Echo (TFE) sequence was used (TR/TE: 8.1 /3.7 ms; flip angle:8°; FOV-240*240; Slices -360 with no gap).MRS was acquired using single voxel Point Resolved Spectroscopy Sequence (PRESS) on the left cerebellum (TR/TE= 2000/35ms, 2000 Hz spectral Bandwidth, 20×20×20 mm3 VOI and 128 averages with automated shimming). MRS data were processed using Linear Combination Model (LC-Model Version 6.3-1R) software (Provencher, 1993) and peaks assigned by automated frequency-based analysis (in ppm). Using partial volume correction (PVC) from the segmented gray matter (GM), white matter (WM) and CSF of the voxel in T1 anatomical image, fraction VOI values were used for quantification of metabolic concentration using LC model from: WCONC = (43300 fGM + 35880 fWM + 55556 fCSF) / (1 − fCSF), where WCONC is the water concentration (in mM) in the voxel, f is the fraction of GM, WM and CSF. The MRS signal from single voxel of cerebellum acquired as a concentration and provided by the Cramér Rao Lower Bounds (CRLB) signal. All metabolites were chosen based on a previous study and cut off <20% of CRLB values8. Concentration of metabolites N-acetylaspartate (NAA), Glutamate (Glu), Glutamine (Gln), Glycerophosphocholine (GPC), myo-inositol (mI), N-acetylaspartylglutamate (NAAG), Glutamate plus Glutamine (Glu + Gln = Glx), total NAA (tNAA= NAA+NAAG), Creatine (Cr), total Creatine (tCr; the sum of Cr and phospho-creatine (Pcr)) and total Choline (tCho; sum of GPC and phosphocholine (Pch)) were analysed and get in the “Institutional Unit”(IU) by LC model software. 3D T1 MR images were analyzed using CAT12 toolbox of SPM (Statistic Parametric Mapping). Inter-group analyses were performed using one-way ANOVA between the SCA2, SCA12 and HC. The correlation was considered significant with a p-value p<0.05.Result
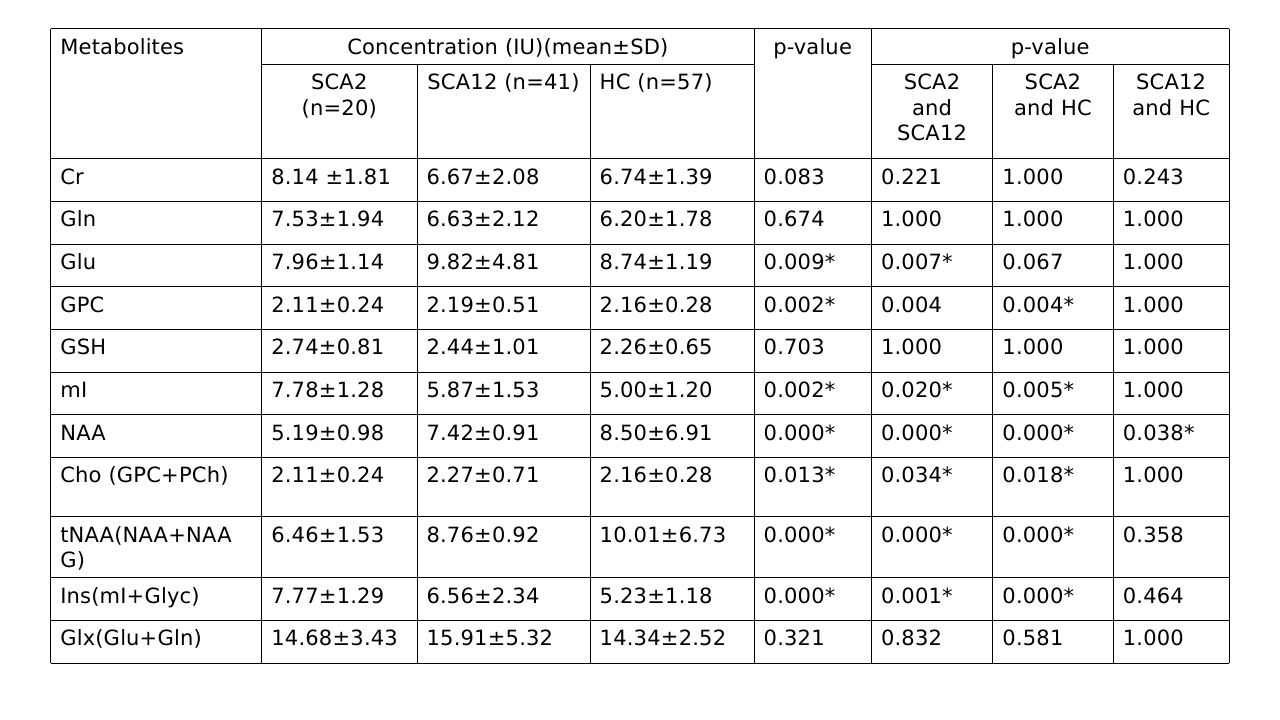
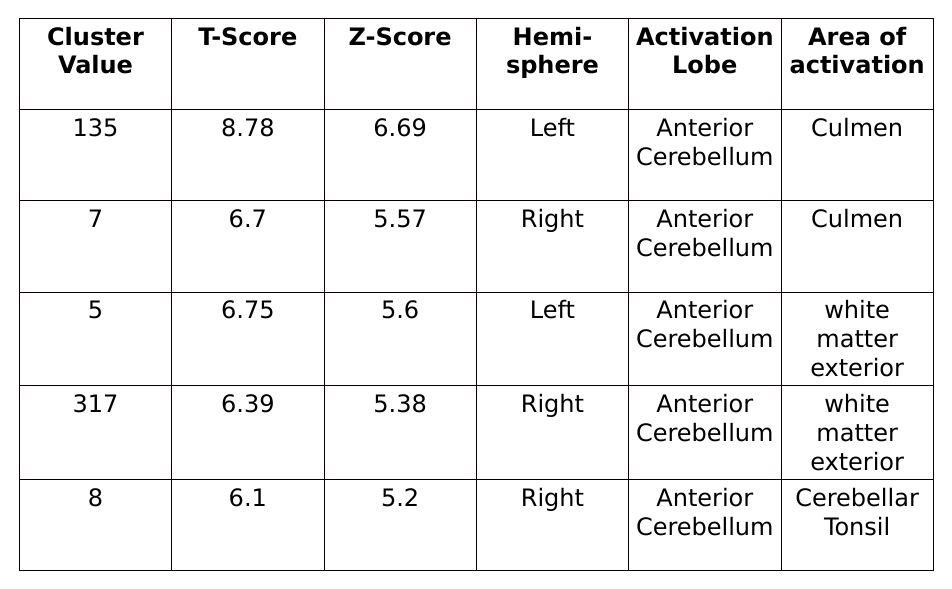
NAA levels were decreased in all SCA2 and SCA12 patients in cerebellum. A decrease in NAA, tNAA (NAA+NAG), Cho(GPC+PCh) and increased mI, Ins(mI+Glyc) concentration was observed in SCA2 as compared to controls. SCA2 exhibited a significant increase in mI values as compared to that in SCA12, and tNAA value was decreased in SCA2 in comparison with that in HC. Cerebellum atrophy of white matter in both bilateral anterior and posterior cerebellar lobes was observed in SCA2 with respect to healthy controls. SCA2 patients exhibited more atrophy in comparison to SCA12.Discussion
Deficits observed in SCA, viz, motor control and voluntary activity such as balance, speech and posture are controlled predominantly by cerebellum. Decreased tNAA (NAA+NAAG) concentration in SCA2 and SCA12 may reflect mitochondrial dysfunction as well as neuronal stress (or loss) as compared to that in controls, as NAA is an essential amino acid which is released from the breakdown of N-acetyl-aspartyl-glutamate, and mainly synthesized in the mitochondria of neurons. Myo-inositol (mI) is a metabolically inert molecule which influence the properties of biological fluids and hence increased mI in SCA2 may be associated with increased tremors9. tNAA and mI+Glyc may be used as potential biomarkers for discriminating SCA2 and SCA12.Conclusion
Structural and metabolic alterations in cerebellum in SCA patients may be attributed to the motor and cognitive dysfunctions. Increased atrophy in SCA2 (with respect to SCA12) may be associated with more tremor and dyskinesia in comparison with that in SCA12.Acknowledgements
We sincerely thank the Science and Engineering Research Board (SERB), Govt. India, New Delhi, India for funding and fellowship [Project No: EMR/2017/002294 & 03rd October 2018]References
1. Giocondo, F. & Curcio, G. Spinocerebellar ataxia: a critical review of cognitive and socio-cognitive deficits. Int. J. Neurosci. 128, 182–191 (2018).
2. Klockgether, T. et al. The natural history of degenerative ataxia : a retrospective study in 466 patients. 589–600 (1998).
3. Durr, A. Autosomal dominant cerebellar ataxias: polyglutamine expansions and beyond. Lancet Neurol. 9, 885–894 (2010).
4. Van de Warrenburg, B. P. C., et al. "Spinocerebellar ataxias in the Netherlands: prevalence and age at onset variance analysis." Neurology 58.5 (2002): 702-708.
5. Ruano, L., Melo, C., Silva, M. C. & Coutinho, P. The Global Epidemiology of Hereditary Ataxia and Spastic Paraplegia: A Systematic Review of Prevalence Studies. Neuroepidemiology 42, 174–183 (2014).
6. Hoche, F., Guell, X., Vangel, M. G., Sherman, J. C. & Schmahmann, J. D. The cerebellar cognitive affective/Schmahmann syndrome scale. Brain 141, 248–270 (2018).
7. Kumar, D., Srivastava, A., Faruq, M. & Gundluru, V. Spinocerebellar ataxia type 12: An update. Ann. Mov. Disord. (2019) doi:10.4103/aomd.aomd_5_19.
8. Öz, G. et al. Advanced single voxel 1H magnetic resonance spectroscopy techniques in humans: Experts’ consensus recommendations. NMR Biomed. 34, 1–18 (2021).
9. Brooker, S. M., Edamakanti, C. R., Akasha, S. M., Kuo, S.-H. & Opal, P. Spinocerebellar ataxia clinical trials: opportunities and challenges. Ann. Clin. Transl. Neurol. 8, 1543–1556 (2021).
Figures