3644
Posterior fossa radiomics based diagnosis of Essential tremor from T1-weighted MRI1Symbiosis Centre for Medical Image Analysis, Symbiosis International University, Lavale, Mulshi, Pune, India, 2Department of Clinical Neurosciences and Neurology, National Institute of Mental Health & Neurosciences, Bangalore, India, Bengaluru, India, 3Symbiosis Institute of Technology, Symbiosis International University, Lavale, Mulshi, Pune, India, 4Department of Neuroimaging & Interventional Radiology, National Institute of Mental Health & Neurosciences, Bangalore, India, Bengaluru, India, 5Department of Neurology, National Institute of Mental Health & Neurosciences, Bangalore, India, Bengaluru, India
Synopsis
The cerebellum and its connections (cerebellar peduncles) have been implicated to play a significant role in the pathogenesis of essential tremor (ET). However, these abnormalities may not be grossly evident on basic structural imaging. To this end, we employ radiomics on 3D-T1 weighted images to capture subtle features of pathology and use it in a machine learning framework to deliniate patients with ET. We demonstrate a test accuracy of 83% with radiomics features from dentate nucleus contributing the most, followed by the right V. It thus suggests the potential utility of radiomics features from these structures for diagnosis of ET.
Introduction
The cerebellum and its connections (cerebellar peduncles) have been implicated to play a significant role in the pathogenesis of essential tremor (ET) [1,2], however these abnormalities are not grossly evident on basic structural imaging. It is plausible that advanced techniques such as radiomics which possess the capability to extract subtle intensity, statistical and textural features could provide a biological signature for ET.Methods
Data were acquired from two different scanners. The T1 Weighted inversion recovery fast gradient echo MR images were acquired on a 3T Philips Acheiva MRI scanner with a 32-channel head coil from 40 ET patients (Age 44.95 ± 12.63, 13 Female) and 38 HC (Age 46.05 ± 9.59, 10 Female) that were a part of a previous study [1]. The following acquisition parameters were used: TR=8.2ms, TE=3.8ms, flip angle 8°, field of view (FOV) = 256 X 256 X 165. Additionally, T1 weighted MPRAGE images from 17 ET patients (Age 51.59, 4 Female) and 23 HCs (Age 41.79 ± 11.98 , 7 Female) acquired using a Philips Ingenia 3T scanner with a 32 channel head coil with TR=8.05ms, TE=3.6ms, flip angle=8°, field of view (FOV) = 256 X 256 X 211 mm, voxel size = 1x1x1mm, acquisition matrix = 256 mm was also added to this cohort (total n=118; 57 ET, 61 HC). Following conversion of DICOM images to NIFTI, the standard FreeSurfer pipeline was applied to the T1 weighted images [3,4]. Seventeen regions in the cerebellar lobules defined bilaterally from the SUIT atlas [5] included lobules I-IV, V, VI, Crus I, Crus II, Vermis Crus I, Vermis Crus II, VIIb, VIIIa, VIIIb, IX, Vermis IX, X, Vermis X, Dentate nuclei, Interposed nuclei and Fastigial nuclei. The inferior, superior and middle cerebellar peduncles defined bilaterally on a probabilistic atlas of cerebellar white matter[6] at a 50% probability threshold was used to define the cerebellar peduncles. All the cerebellar ROIs defined in the MNI space were non-linearly registered to individual subject space using advanced normalization tools [7] and the registration quality was manually assessed. The open-source package pyradiomics[8] was used to extract 18 first-order statistical features, 24 GLCM (Gray Level Co-occurance Matrix) based features, 16 GLRLM (Gray level Run-Length Matrix) based features, 16 GLSZM (Gray Level Size Zone Matrix) based features, 5 NGTDM based features (Neighbouring Gray Tone Difference Matrix) and 14 GLDM (Gray Level Depenedence Matrix) based features. An 80-20 split of the data (n=118) into training and testing sets was done, with 94 subjects in the training set and 24 in the testing set. Since data from two different scanners were used, a data harmonization procedure [9] was applied to the computed radiomics features to mitigate the effect of scanner differences in these features. A z-score normalization was performed on all the harmonized radiomics features following which a two-stage feature selection method was employed to reduce the dimensionality of the data and retain an optimum feature set by eliminating redundant features. The first stage was a univariate feature selection using the top 100 best of highest scoring features with the ANOVA F-value used as the scoring parameter. This reduced the feature set to 100 features. The second stage involved a Random Forest Recursive Feature Elimination with Cross Validation (RF-RFECV), with a 5-fold CV used as a standard evaluation strategy. The 60 most discriminant features of were used as the input to the final classifier. The sklearn machine learning library was used for all the implementations [10].Results
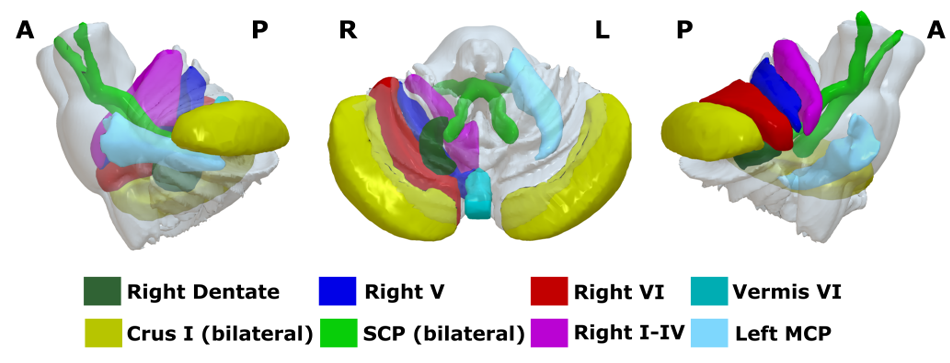
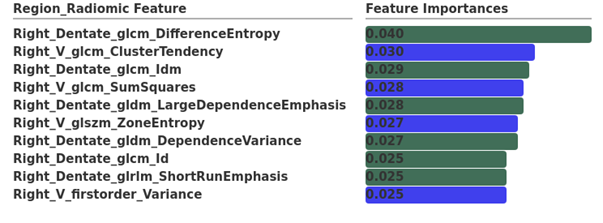
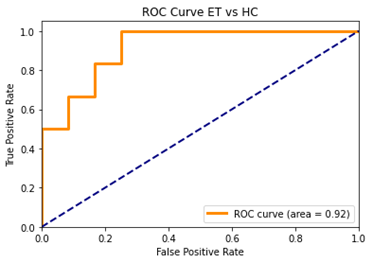
The radiomics based RF classifier performed with an accuracy of 83.33% (average CV accuracy 85.14%, Area under- ROC (AU-ROC) =0.92) (Figure.3 and Table 1). The 60 most important features that were retained after two-stage feature selection (Figure.1) included 22 GLCM features, 16 GLRLM, 9 first order, 6 GLDM and 7 GLSZM features. The ROIs that these belonged to were mostly right hemispheric, and consisted of the Right Dentate, Right V, Right VI, Right I-1V, bilaterally the Crus I and SCP, Vermis VI, and the Left MCP (Figure.1) of which Right Dentate and Right V alone contributed to the top ten of the most discriminative features (Figure.2).Conclusion
The top 10 most discriminative features identified in patients with ET include the dentate nucleus and the lobule V of the cerebellum. The dentate nucleus has been frequently suggested to be involved in the pathogenesis of ET, additionally, lobule V is part of the motor cerebellum which is involved in the cerebello-thalamo-cortical network, a part of the tremor network. These results suggest that radiomics was able to accurately identify regions suggested to be involved in the pathogenesis of ET. Future studies including other tremor disorders will be key to establish the utility of radiomics in diagnosing ET.Table 1: Classification results based on T1 radiomics
| Category | Precision | Recall | F1 score | Support | Test Accuracy | Avg CV Accuracy (5-fold) | |
| ET vs HC | ET | 0.83 | 0.83 | 0.83 | 12 | 0.83 | 0.85 |
| HC | 0.83 | 0.83 | 0.83 | 12 | |||
Acknowledgements
The authors would like to acknowledge the Department of Biotechnology grant no. BT/PR 27340/MED/122/130/2018 awarded to Dr. Jitender Saini, Dr. Madhura Ingalhalikar and Dr. Pramod Kumar Pal under which data acquisition was performed
References
1 Louis ED. (2016). Linking essential tremor to the cerebellum: neuropathological evidence. The Cerebellum, 15:235-242.
2 Cerasa A, Quattrone A. (2016). Linking essential tremor to the cerebellum—neuroimaging evidence. The Cerebellum, 15(3), 263-275
3 Fischl B, van der Kouwe A, Destrieux C et al (2004) Automatically parcellating the human cerebral cortex. Cereb Cortex 14:11-22
4 Desikan RS, Segonne F, Fischl B et al (2006) An automated labeling system for subdividing the human cerebral cortex on MRI scans into gyral based regions of interest. Neuroimage 31:968-980
5 Diedrichsen J, Maderwald S, Küper M et al (2011). Imaging the deep cerebellar nuclei: a probabilistic atlas and normalization procedure. Neuroimage 54(3):1786-1794.
6 Van Baarsen KM, Kleinnijenhuis M, Jbabdi S et al (2016). A probabilistic atlas of the cerebellar white matter. Neuroimage 124:724-732.
7 Avants BB, Tustison N, Song G (2009) Advanced normalization tools (ANTS). Insight j 2:1-35
8 van Griethuysen JJ, Fedorov A, Parmar C et al (2017) Computational radiomics system to decode the radiographic phenotype. Cancer research 77:e104-e107
9 Fortin, JP, Parker D, Tunç B et al. (2017). Harmonization of multi-site diffusion tensor imaging data. Neuroimage, 161, 149-170
10 Pedregosa F, Varoquaux G, Gramfort A et al (2011) Scikit-learn: Machine learning in Python. the Journal of machine Learning research 12:2825-2830
Figures