3640
Correlation between Iron Burden and Cognitive Status in Type 2 Diabetes Mellitus Patients Using Quantitative Susceptibility Mapping1Radiology, First Affiliated Hospital of Dalian Medical University, Dalian, China
Synopsis
The relationship between iron accumulation and cognitive decline in T2DM has not been fully revealed and publicized. This research focuses on assessing the global iron content and high iron content levels of the gray nucleus using QSM, and to analyze the correlation between MSV with significant differences and clinical laboratory indicators and cognitive scores in T2DM Patients. Excessive deposition and uneven distribution of iron protein occur in all nuclei in T2DM patients. Iron is important in the pathophysiology of T2DM, especially the MSVhi in the right PUT was significantly negatively correlated with MoCA (r = -0.485, P = 0.004).
INTRODUCTION AND PURPOSE
Type 2 Diabetes Mellitus (T2DM) patients suffer from cognitive deficits of memory, executive function, attention, visuospatial capabilities, and other domains 1. T2DM can be applied as an individual independent risk factor for Alzheimer’s disease (AD) 2. T2DM patients may be at a higher risk of developing AD 3. The relationship between iron accumulation and cognitive decline in T2DM has not been fully revealed and publicized. This research focuses on assessing the global iron content and high iron content (RII) levels of the gray nucleus using quantitative susceptibility mapping (QSM), and to analyze the correlation between magnetic susceptibility value (MSV) with significant differences and clinical laboratory indicators and cognitive scores in T2DM Patients.MATERIALS AND METHODS
34 cases of clinically confirmed T2DM and 14 age- and sex- matched healthy volunteers (HC) underwent conventional MR sequences and strategically acquired gradient echo (STAGE) scanning on a Philips Ingenia CX 3.0 T MR scanner. The magnetic susceptibility values of whole-structural (MSVwh) and regional high iron (MSVhi) areas on bilateral head of caudate nucleus (HCN), globus pallidus (GP), putamen (PUT), pulvinar thalamus (PT), subthalamic nucleus (STN), red nucleus (RN), substantia nigra (SN), dentate nucleus (DN) and gyri fasciolaris (GF) were measured in post processing QSM image using signal processing in nuclear magnetic resonance (SPIN) software in T2DM patients and HC’s. The MSVwh mean reduce 2SD of MSV in each nucleus of the HC group was used as the threshold to determine the MSVhi of patients. Clinical data, laboratory examination indexes and Mini-mental State Examination (MMSE), Montreal Cognitive Assessment (MoCA), California verbal learning test (CVLT), Symbol Digit modalities test (SDMT) were collected.Data analyses were performed using statistical package for social science (SPSS) version 25.0. ICC test was calculated to evaluate inter-observer reliability. Independent samples t-test (for normally distributed data) or Mann–Whitney U test (for non-normally distributed data) or chi-square test (Enumeration data) was used to compare the MSV of gray nucleus, clinical data, laboratory examination indexes and Cognitive scores between T2DM group and HC group. Pearson correlation analysis (for normally distributed data) or Spearman correlation analysis (for non-normally distributed data) was used to analyze the correlation between MSV with significant differences and clinical laboratory indicators and cognitive scores. P < 0.05 was considered statistically significant.
RESULTS
Significant differences were found in glycated hemoglobin (HbA1c), fasting plasma glucose (FG), SDMT between T2DM group and HC group (P < 0.05).Compared with HC group, the MSVwh values of all gray nucleus in T2DM group were increased by 9.8-25.7%, and there were significant differences in right HCN, right PUT, bilateral GP, right STN and left GF (P < 0.05, Fig.1-A). The correlation between the MSVwh of gray nucleus with significant differences and clinical laboratory indicators and cognitive scores in T2DM group is shown in Fig.2, where MSVwh in the right PUT is most relevant to MoCA (r = -0.482, P = 0.004) (Fig.4).
Compared with HC group, the MSVhi values of all gray nucleus in T2DM group were increased by 9.2-21.8%, and there were significant differences in right HCN, right PUT, bilateral GP and left GF (P < 0.05 Fig.1-B). The correlation between the MSVhi of gray nucleus with significant differences and clinical laboratory indicators and cognitive scores in T2DM group is shown in Fig.3, where MSVhi in the right PUT is most correlated with MoCA (r = -0.485, P = 0.004) (Fig.5).
DISCUSSION AND CONCLUSION
Increased iron deposition in the gray nucleus in T2DM patients were associated with cognitive deficits. Further evaluations are needed to research iron burden and their diagnostic role in dementia pathology of T2DM in the future.Acknowledgements
No acknowledgement found.References
1. McCrimmon RJ, Ryan CM, Frier BM. Diabetes and cognitive dysfunction. The Lancet 2012;379:2291-2299.
2. Moon Y, Han SH, Moon WJ. Patterns of Brain Iron Accumulation in Vascular Dementia and Alzheimer's Dementia Using Quantitative Susceptibility Mapping Imaging. J Alzheimers Dis 2016;51:737-745.
3. Redondo MT, Beltran-Brotons JL, Reales JM, Ballesteros S. Executive functions in patients with Alzheimer's disease, type 2 diabetes mellitus patients and cognitively healthy older adults. Exp Gerontol 2016;83:47-55.
Figures
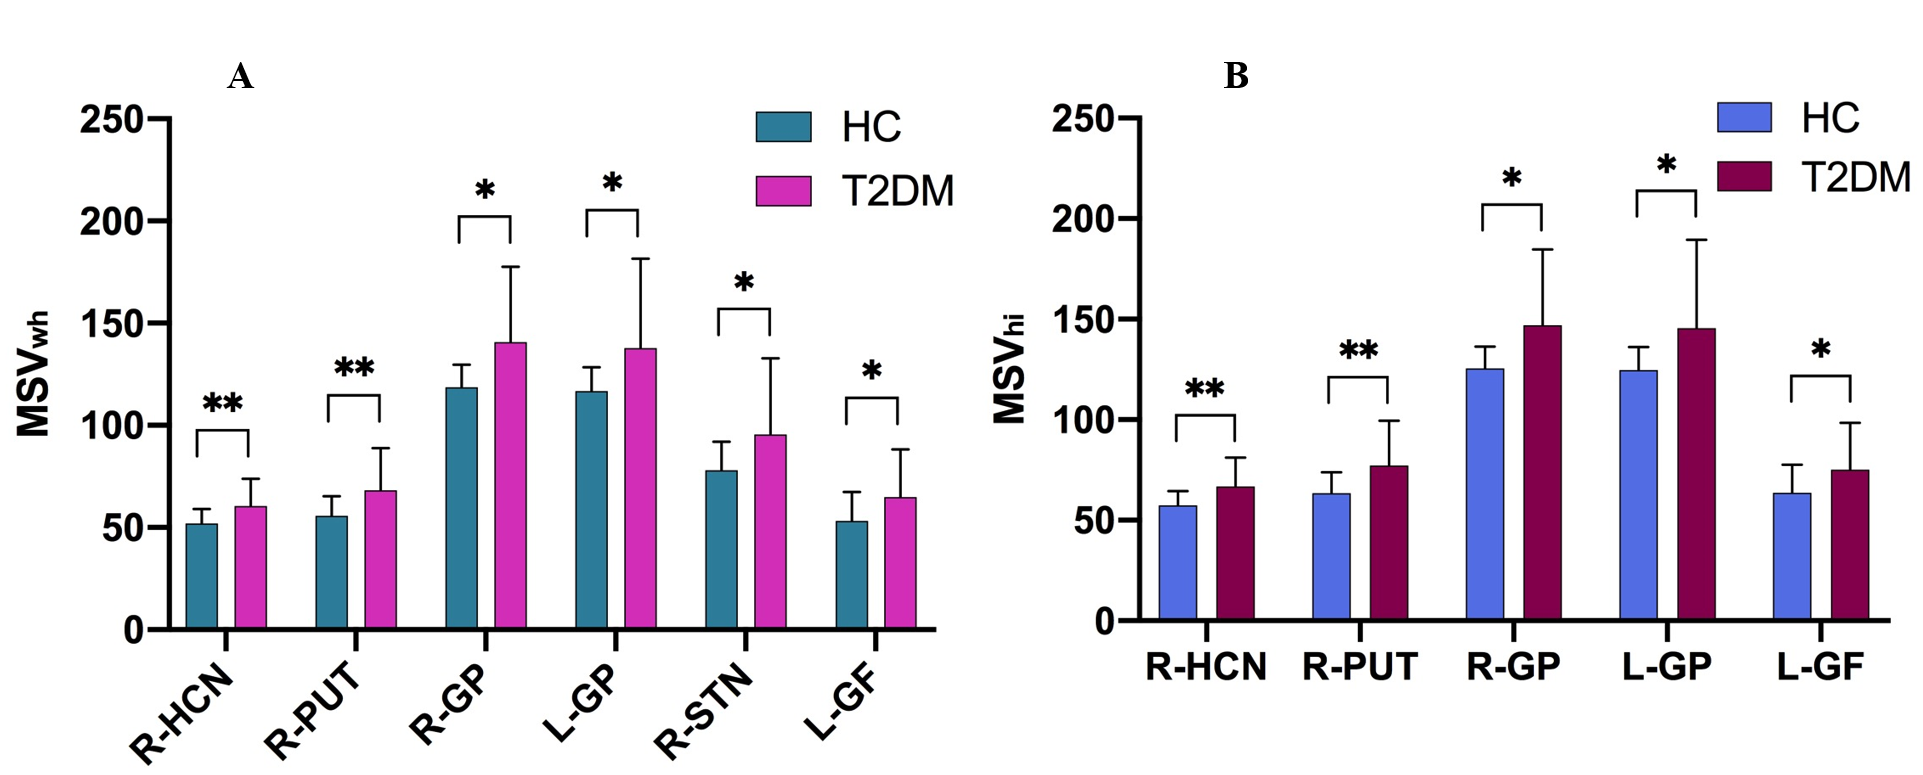
Fig 1A-B Comparisons of gray nucleus MSVwh and MSVhi with significant differences between T2DM group and HC group, ÞP < 0.05, ÞÞP < 0.01.
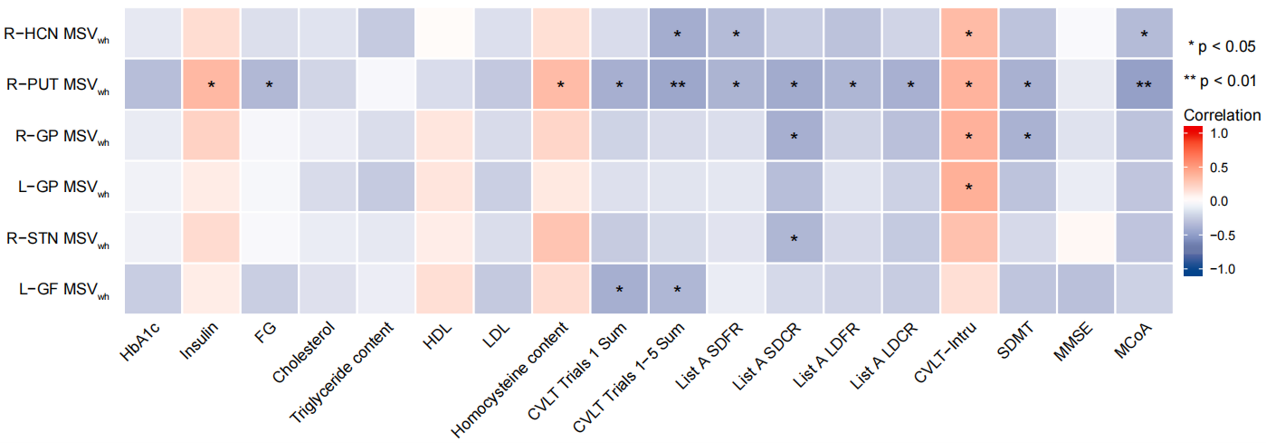
Fig 2 Heat map showing the correlation analysis between MSVwh with significant differences of gray nucleus and laboratory examination indexes and cognitive scores in T2DM group. Color bar on the right side displays the value of the correlation coefficient (higher from –1 to 1, and from blue to red). ÞP < 0.05, ÞÞP < 0.01.
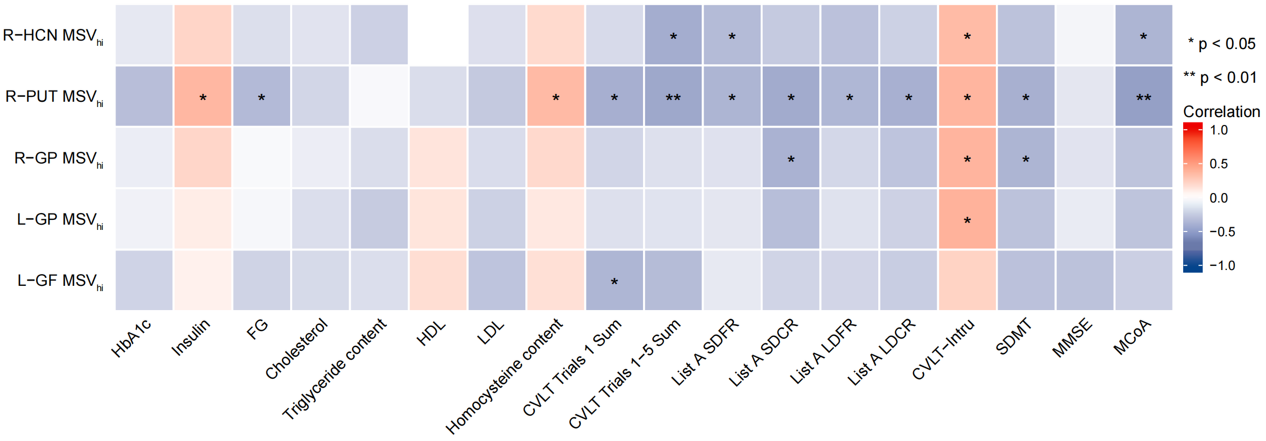
Fig 3 Heat map showing the correlation analysis between MSVhi with significant differences of gray nucleus and laboratory examination indexes and cognitive scores in T2DM group. Color bar on the right side displays the value of the correlation coefficient (higher from –1 to 1, and from blue to red). ÞP < 0.05, ÞÞP < 0.01.
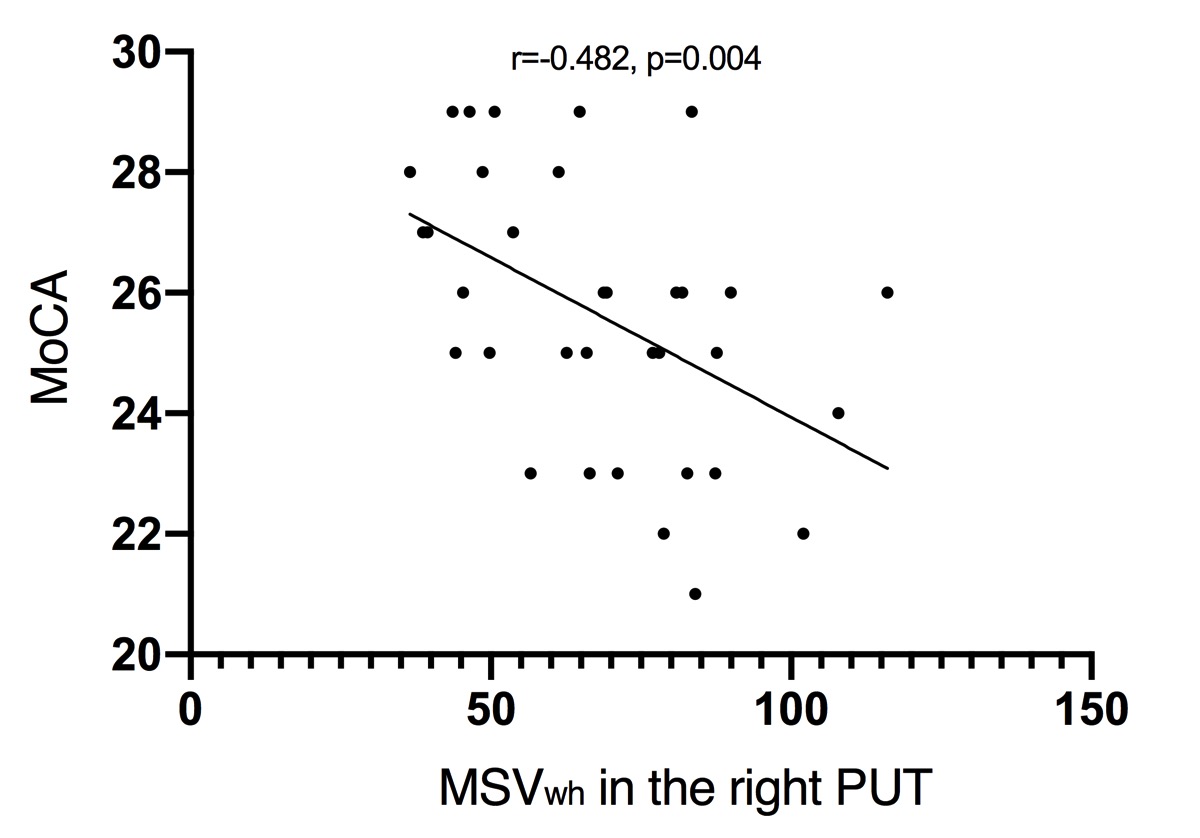
Fig 4 Correlations between MSVwh in the right PUT and MoCA.
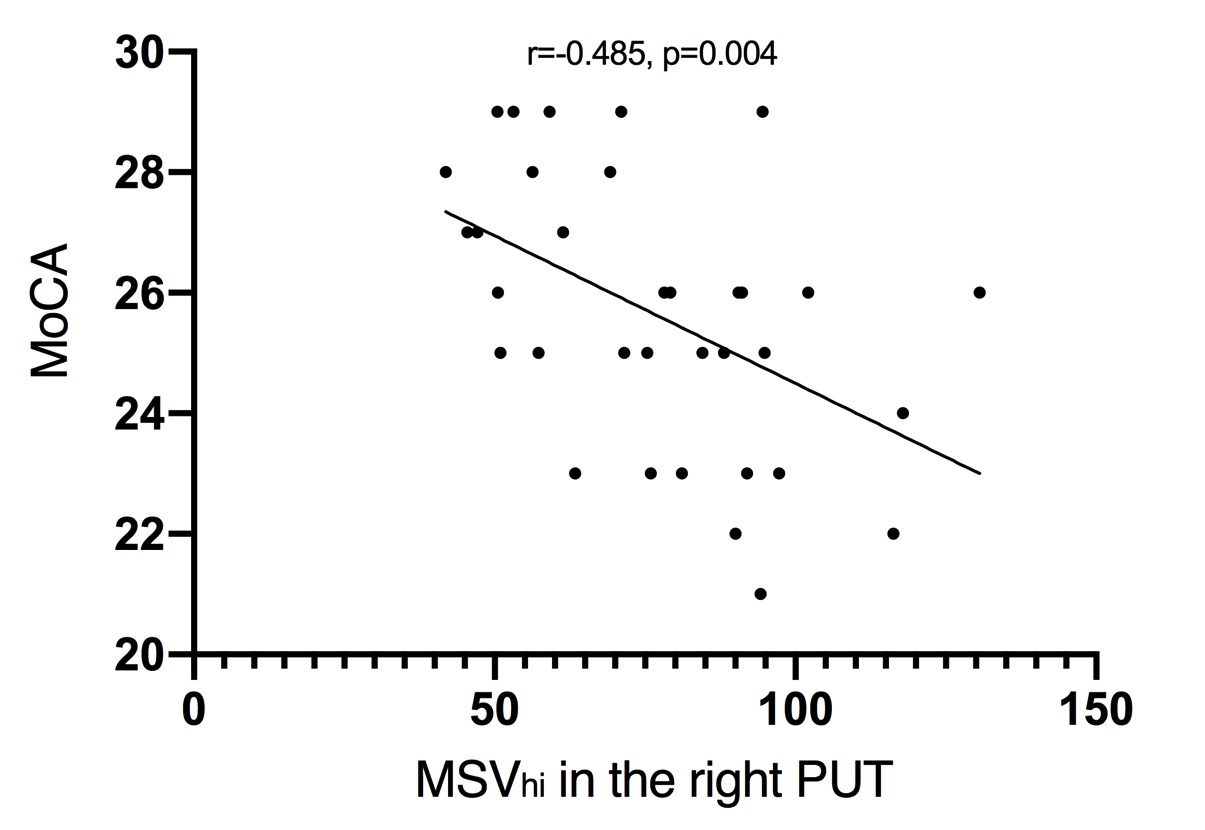
Fig 5 Correlations between MSVhi in the right PUT and MoCA.