3639
Global and Regional Iron Content Changes of Gray Nucleus Using Quantitative Susceptibility Mapping in Type 2 Diabetes Mellitus Patients1Radiology, First Affiliated Hospital of Dalian Medical University, Dalian, China
Synopsis
Assessing whole-structural and regional high iron content in deep gray matter nuclei using STAGE-based QSM in T2DM Patients. Excessive deposition and uneven distribution of iron protein occur in all nuclei in T2DM patients. The MSVwh of significant differences (P < 0.05) between groups were present in right HCN, right PUT, bilateral GP, right STN and left GF, with the largest AUC of 0.723 in the right GP. The MSVhi in right HCN, right PUT, bilateral GP and left GF were significant differences (P < 0.05) With a largest AUC of 0.714 in right GP.
INTRODUCTION AND PURPOSE
Abnormal iron metabolism is relevant to many neurodegeneration diseases. But the abnormal mode of brain iron accumulation in gray nucleus has not been fully elucidated in T2DM patients. The use of strategically acquired gradient echo (STAGE) imaging with multi-echo and multi-flip data helps to improve the signal-to-noise ratio in Quantitative susceptibility mapping (QSM) data and yields less artifacts1. Non-invasive quantitative analysis of brain iron deposition can be achieved by magnetic susceptibility value (MSV) measurement. In addition to the measurement of global iron content, we also carried out the measurement of high iron content region (RII) to compare the difference of global and regional iron content between normal people and T2DM because of the iron deposition across the entire gray nucleus is inhomogeneous.MATERIALS AND METHODS
34 cases of clinically confirmed T2DM and 14 age- and sex- matched healthy volunteers (HC) underwent conventional MR sequences and strategically acquired gradient echo (STAGE) scanning on a Philips Ingenia CX 3.0 T MR scanner. The magnetic susceptibility values of whole-structural (MSVwh) and regional high iron (MSVhi) areas on bilateral head of caudate nucleus (HCN), globus pallidus (GP), putamen (PUT), pulvinar thalamus (PT), subthalamic nucleus (STN), red nucleus (RN), substantia nigra (SN), dentate nucleus (DN) and gyri fasciolaris (GF) were measured in post processing QSM image using signal processing in nuclear magnetic resonance (SPIN) software in T2DM patients and HC’s. The MSVwh mean reduce 2SD of MSV in each nucleus of the HC group was used as the threshold to determine the MSVhi of patients.Data analyses were performed using statistical package for social science (SPSS) version 25.0. ICC test was calculated to evaluate inter-observer reliability. Independent samples t-test (for normally distributed data) or Mann–Whitney U test (for non-normally distributed data) was used to compare the MSV of gray nucleus between T2DM group and HC group. The area under Receiver operating characteristic (ROC) curve was used to evaluate the effectiveness of MSV values in diagnosing T2DM. P < 0.05 was considered statistically significant.RESULTS
Compared with HC group, the MSVwh values of all nuclei in T2DM group were increased by 9.8-25.7%. For the global iron content, the MSVwh of significant differences between groups were present in right HCN, right PUT, bilateral GP, right STN and left GF (P < 0.05, Fig.1). ROC analysis showed that MSVwh of the right GP had the largest AUC of 0.723, with a threshold of 131.90, the sensitivity was 58.8% and the specificity was 85.7% (Fig.3).Compared with HC group, the MSVhi values of all nuclei in T2DM group were increased by 9.2-21.8%. For the local high iron content region, the MSVhi in right HCN, right PUT, bilateral GP and left GF were significant differences (P < 0.05, Fig.2). With a threshold of 137.24, the MSVhi of the right GP had the largest AUC of 0.714, the sensitivity of 61.8% and the specificity of 85.7% (Fig.4).
DISCUSSION AND CONCLUSION
QSM is useful for evaluating the iron change of gray nucleus in T2DM patients. Regional analysis can further reveal the uneven distribution of brain iron.Excessive deposition and uneven distribution of iron protein occur in all nuclei in T2DM patients, just like Parkinson’s disease2, atypical parkinsonian disorders3, Alzheimer’s disease4.
Acknowledgements
No acknowledgement found.References
1. Gharabaghi S, Liu S, Wang Y, et al. Multi-Echo Quantitative Susceptibility Mapping for Strategically Acquired Gradient Echo (STAGE) Imaging. Front Neurosci 2020;14:581474.
2. Ghassaban K, He N, Sethi SK, et al. Regional High Iron in the Substantia Nigra Differentiates Parkinson's Disease Patients From Healthy Controls. Front Aging Neurosci 2019;11:106.
3. Lee JH, Lee MS. Brain Iron Accumulation in Atypical Parkinsonian Syndromes: in vivo MRI Evidences for Distinctive Patterns. Front Neurol 2019;10:74.
4. Nikseresht S, Bush AI, Ayton S. Treating Alzheimer's disease by targeting iron. Br J Pharmacol 2019;176:3622-3635.Figures
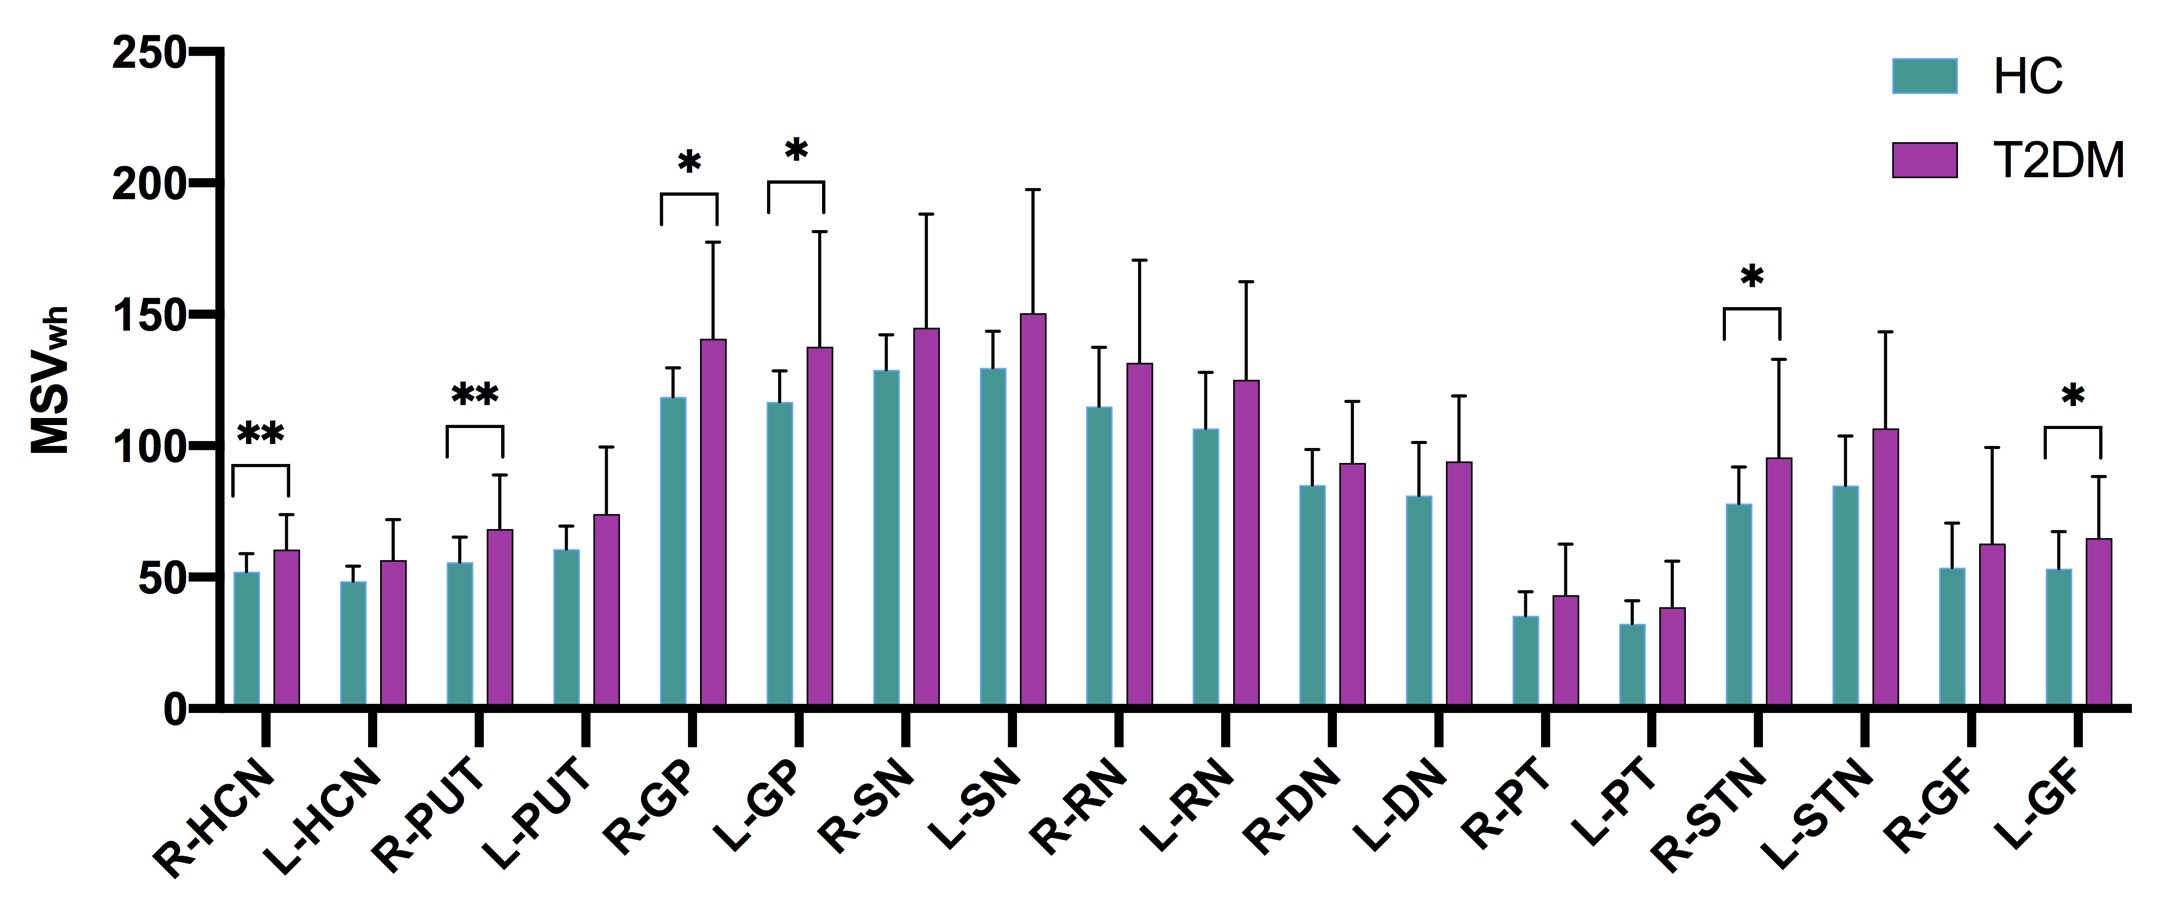
Fig 1 Comparisons of gray nucleus MSVwh between T2DM group and HC group in the global iron content, ÞP < 0.05, ÞÞP < 0.01.
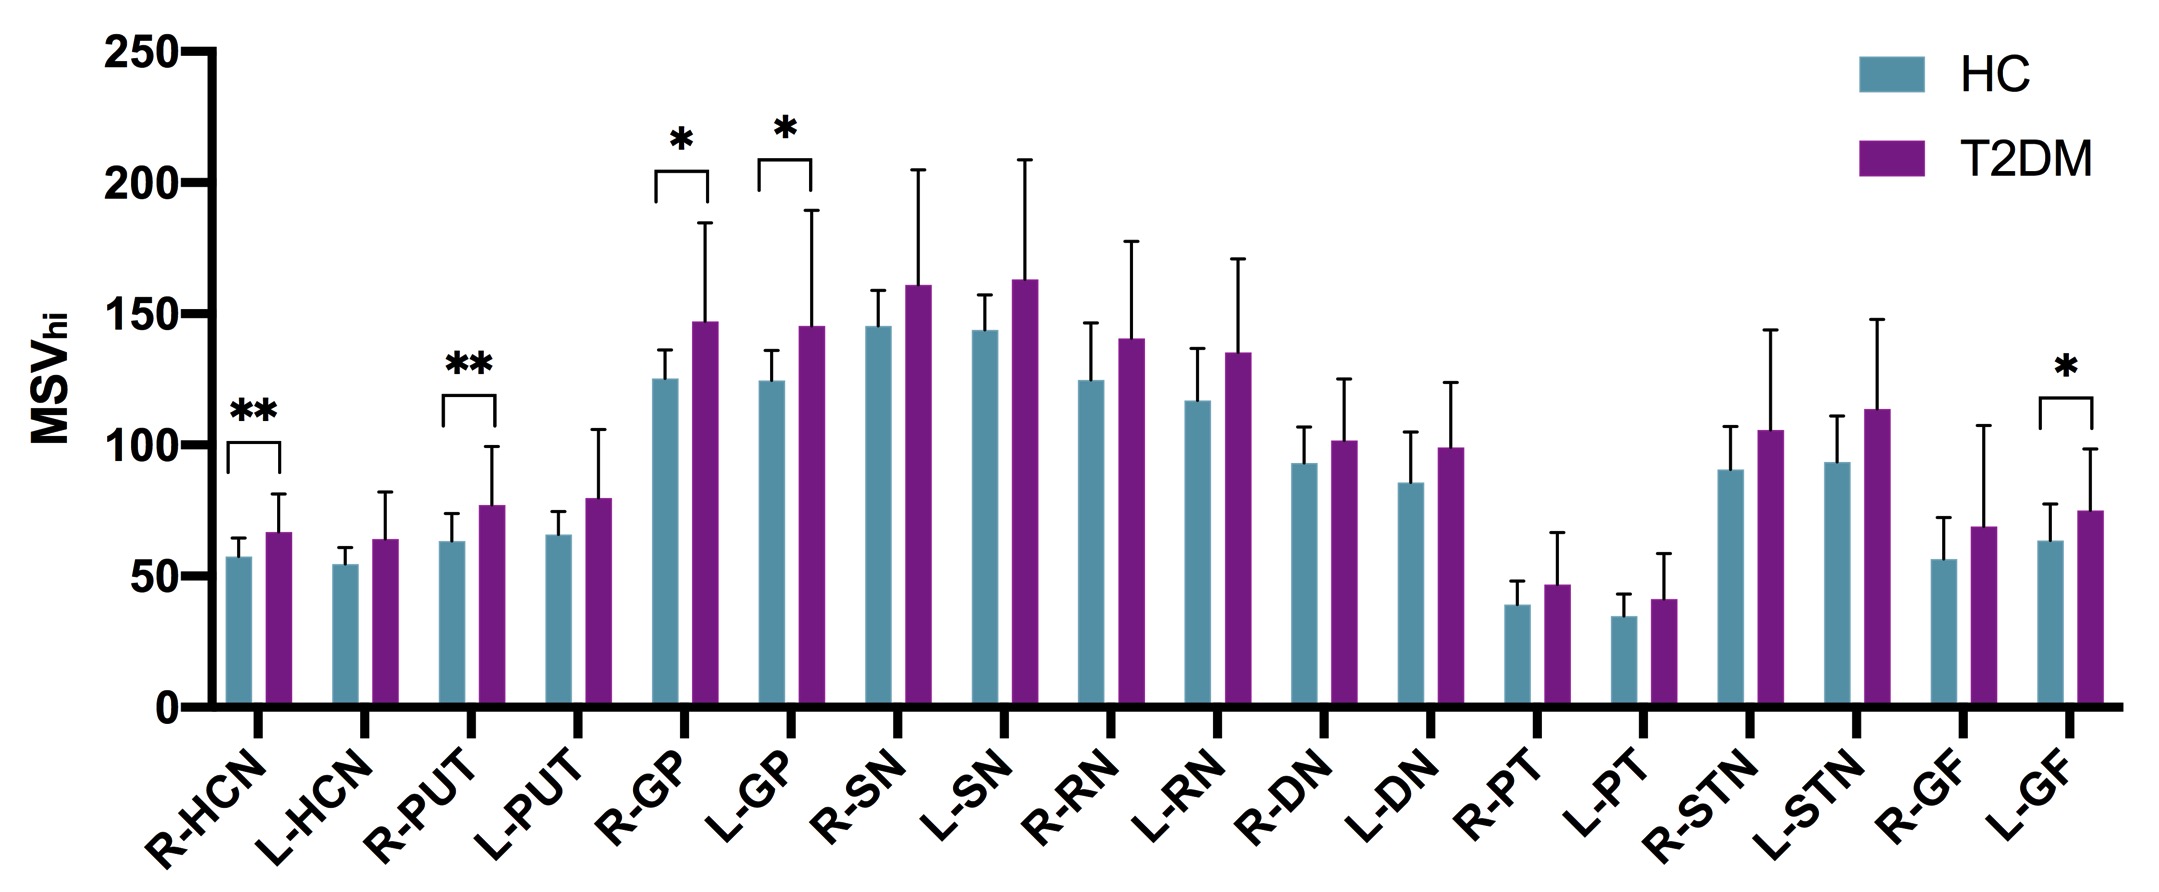
Fig 2 Comparisons of gray nucleus MSVhi between T2DM group and HC group in the local high iron content region, ÞP < 0.05, ÞÞP < 0.01.
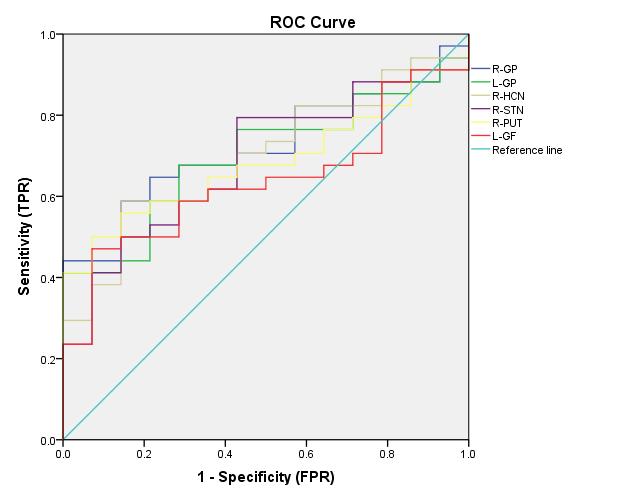
Fig 3 The ROC map of MSVwh value in the global iron content. MSVwh of the right GP had the largest AUC of 0.723, with a threshold of 131.90, the sensitivity was 58.8% and the specificity was 85.7%.
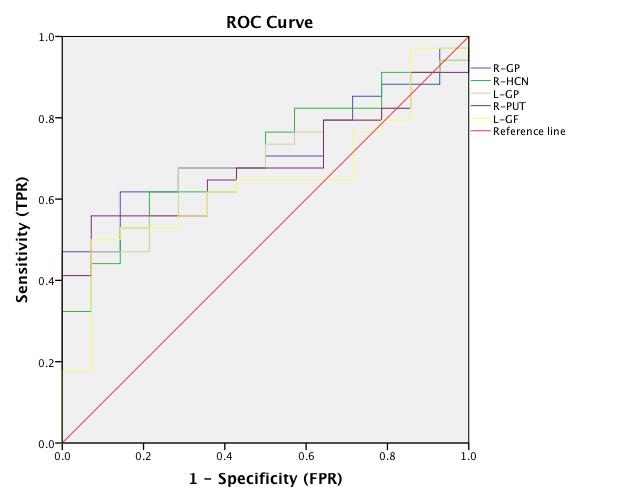
Fig 4 The ROC map of MSVhi value in the high iron content region. MSVhi of the right GP had the largest AUC of 0.714, with a threshold of 137.24, the sensitivity was 61.8% and the specificity was 85.7%.